Day Hagan Tech Talk: #!%@!
A downloadable PDF copy of the Article:
Summary
Within the context of a supportive price pattern of a higher trough & higher peak (Figure 2), Wall Street appears frustrated as domestic equity market indices struggle with overhanging selling pressure (resistance). It’s not clear yet whether a consolidation pattern develops or if further downside probing occurs.
Anger, Frustration, or Rage
The more economically sensitive Small Cap proxy and technology-centric NASDAQ and S&P 500 fell 3.39%, 2.41%, and 1.11% respectively during last week’s tape action. I believe the title of this report—a grawlix, which conveys an outburst or anger, frustration, or rage through typographical symbols—accurately describes the current short-term mindset of certain Wall Street participants, especially those associated with the “FANG” and “MEME” (low-quality/high-beta stocks) complex. See Table 1 and Figure 1.
Table 1: NYSE Fang Plus Index – one week performance of select components, through 2.10.23. | As we move through early 2023, I would not be surprised by a continuation of this type of volatility, in both directions, on a daily and weekly basis. To better visual this type of volatility, in addition to the figures shown below, please refer to the January 31, 2023 Tech Talk report.
Figure 1: NYSE FANG+ Index and MEME exchange-traded fund – Year-to-Date Performance, through 2.10.23.|A good example of how near-term, “straight-up” type moves usually end—a price correction, not a consolidation—and why it is prudent to manage risk along the way.
Figure 2: S&P 500 – weekly with 200-week MA. | A non-trading perspective shows a supportive price structure of a higher trough and higher peak. So far, so good.
Resistance To Support: A Mean Reversion Type Move?
Partially due to a higher U.S. Dollar and higher 10-year U.S. treasury yield (both short-term), my bias towards the SPX leans towards a period of consolidation with a slightly lower bent from here (see support in Figure 3). However, more important than my opinion will be how equity market indices and risk-on areas of the equity market react to tomorrow’s CPI report. This will help discern whether “stocks” consolidate or experience further downside probing, as alluded to in our summary statement.
Figure 3: S&P 500 – daily. | Will we get some Valentine’s Day love following the CPI report, or not? While we wait for some resolve, please be cognizant of the resistance and support levels shown inside the chart. Note: The 200-day MA, not shown and currently at 3945, is no longer declining but starting to stabilize—a positive change.
Figure 4: iShares Russell 2000 ETF – Small Cap proxy. | Through resistance that became support (lower horizontal red/green line), up to resistance (red horizontal line), and back down to support. A violation of either area will likely dictate the proxy’s next short-term directional move.
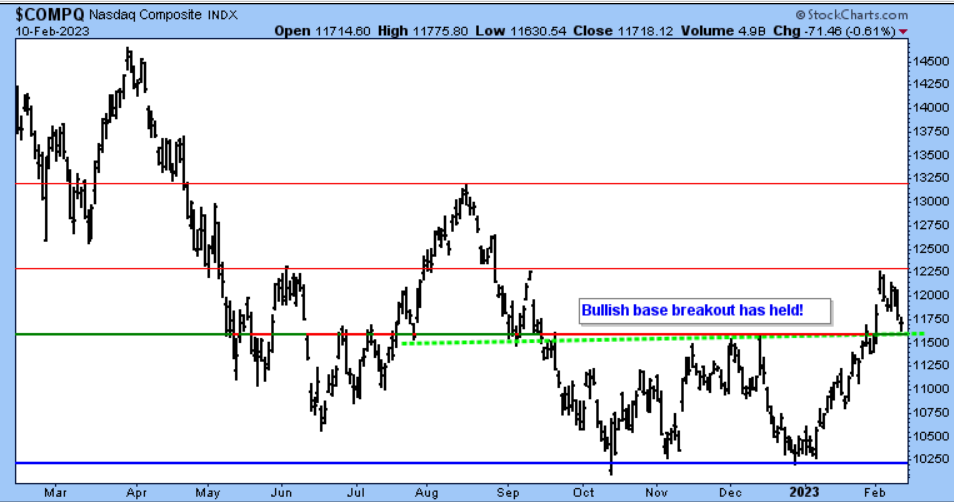
Figure 5: NASDAQ Composite – daily. | Similar to Figure 4, through resistance that became support (lower red/green line), up to resistance (red line), and back down to support (red/green line and green dashed line). A violation of either area will likely dictate the index’s next short-term directional move. NOTE: It’s encouraging that the top end of the recent base breakout contained last week’s decline.
The Day Hagan/Ned Davis Research Smart Sector strategies utilize measures of price, valuation, economic trends, monetary liquidity, and market sentiment to make objective, unemotional, rational decisions about how much capital to place at risk, as well as where to place that capital. Please reach out for specifics.
Day Hagan Asset Management appreciates being part of your business, either through our research efforts or investment strategies. Please let us know how we can further support you.
Art Huprich, CMT®
Chief Market Technician
Day Hagan Asset Management
—Written 2.12.2023. Chart and table source: Stockcharts.com unless otherwise noted.
Future Online Events
Disclosure: The data and analysis contained herein are provided “as is” and without warranty of any kind, either express or implied. Day Hagan Asset Management (DHAM), any of its affiliates or employees, or any third-party data provider, shall not have any liability for any loss sustained by anyone who has relied on the information contained in any Day Hagan Asset Management literature or marketing materials. All opinions expressed herein are subject to change without notice, and you should always obtain current information and perform due diligence before investing. DHAM accounts that DHAM or its affiliated companies manage, or their respective shareholders, directors, officers and/or employees, may have long or short positions in the securities discussed herein and may purchase or sell such securities without notice. The securities mentioned in this document may not be eligible for sale in some states or countries, nor be suitable for all types of investors; their value and income they produce may fluctuate and/or be adversely affected by exchange rates, interest rates or other factors.
Investment advisory services offered through Donald L. Hagan, LLC, a SEC registered investment advisory firm. Accounts held at Raymond James and Associates, Inc. (member NYSE, SIPC) and Charles Schwab & Co., Inc. (member FINRA, SIPC). Day Hagan Asset Management is a dba of Donald L. Hagan, LLC.


