Day Hagan Tech Talk: Who’s To Blame?
A downloadable PDF copy of the Article:
Summary
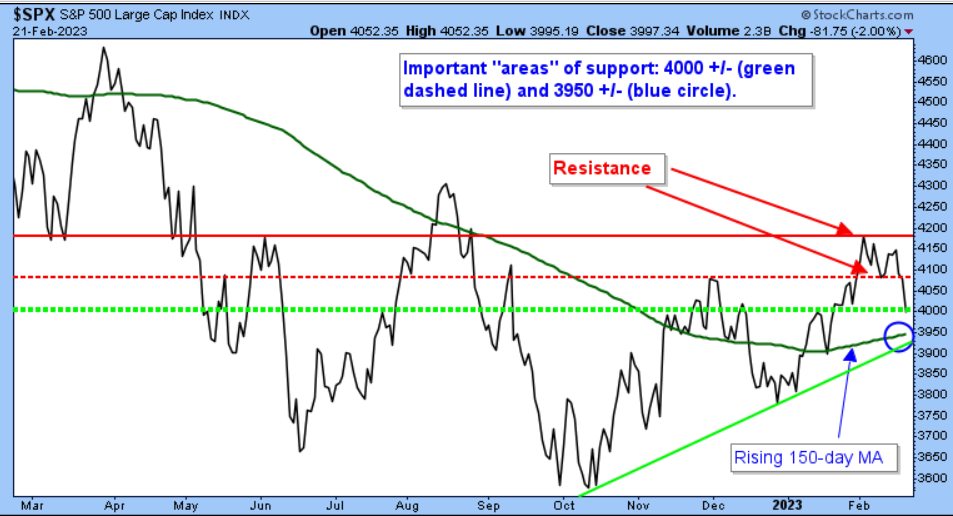
Everyone is blaming the Fed, two nonvoting FOMC participants, and related economic reports for yesterday’s sell off and last week’s price swings, including a lot of stock-specific weakness. For me, it was the continuation of prevailing conditions: overhanging selling pressure (resistance) making itself felt (Figure 1) and upward trending interest rates. As Wall Street debates the issues, I expect further volatility and for equity market proxies continue to consolidate/pullback—SPX 4000+/- to 3950+/-.
Head On A Swivel
I played lacrosse into the fall semester of my freshman year in college and my son later played defense in the game. Thus, I am very familiar with the term “head on a swivel,” used by defensemen (and the coaches) to remind the player to watch both the man he is defending as well as the ball. More generally, head on a swivel means to always be aware of your surroundings. In Wall Street terms, please use support and resistance appropriately.
Figure 1: Domestic Equity Market Indicators & Proxies with Resistance (red lines). | Resistance has been standing its ground for the past few weeks. I expect it to continue for a bit longer.
Figure 2: Dow Jones Industrial Average. | As the DJIA coiled (sideways activity with prices fluctuating between two converging trendlines), which ended yesterday with a move below the lower support line, I’ll say again: head on a swivel. Be aware of your surroundings—use support (shown below) & resistance (red lines) appropriately.
Figure 3: S&P 500 with rising 150-day MA (currently 3946). | A pullback that has relieved the previous overbought conditions and short-term sentiment extreme (too much bullish optimism) is consistent with the seasonal calendar: weakness into month-end/first week of March.
Meanwhile
Figure 4: Energy Proxy – Relative (top frame), Absolute (lower frame).
The Day Hagan/Ned Davis Research Smart Sector strategies utilize measures of price, valuation, economic trends, monetary liquidity, and market sentiment to make objective, unemotional, rational decisions about how much capital to place at risk, as well as where to place that capital. Please reach out for specifics.
Day Hagan Asset Management appreciates being part of your business, either through our research efforts or investment strategies. Please let us know how we can further support you.
Art Huprich, CMT®
Chief Market Technician
Day Hagan Asset Management
—Written 2.20-22.2023. Chart and table source: Stockcharts.com unless otherwise noted.
Future Online Events
Disclosure: The data and analysis contained herein are provided “as is” and without warranty of any kind, either express or implied. Day Hagan Asset Management (DHAM), any of its affiliates or employees, or any third-party data provider, shall not have any liability for any loss sustained by anyone who has relied on the information contained in any Day Hagan Asset Management literature or marketing materials. All opinions expressed herein are subject to change without notice, and you should always obtain current information and perform due diligence before investing. DHAM accounts that DHAM or its affiliated companies manage, or their respective shareholders, directors, officers and/or employees, may have long or short positions in the securities discussed herein and may purchase or sell such securities without notice. The securities mentioned in this document may not be eligible for sale in some states or countries, nor be suitable for all types of investors; their value and income they produce may fluctuate and/or be adversely affected by exchange rates, interest rates or other factors.
Investment advisory services offered through Donald L. Hagan, LLC, a SEC registered investment advisory firm. Accounts held at Raymond James and Associates, Inc. (member NYSE, SIPC) and Charles Schwab & Co., Inc. (member FINRA, SIPC). Day Hagan Asset Management is a dba of Donald L. Hagan, LLC.

