Day Hagan Tech Talk: Speaking Words of Wisdom: The Beatles and The Who
A downloadable PDF copy of the Article:
Day Hagan Tech Talk: Speaking Words of Wisdom: The Beatles and The Who (pdf)
Summary
With a Fed announcement Wednesday and many corporate earnings reports this week, considering domestic equity market indices’ proximity to resistance (previous price peaks and downtrend lines), will domestic equity market indices break out topside or pull back before moving higher? I’d like to see the latter, won’t be surprised by either, and expect volatility to go up again, in both directions.
Won’t Get Fooled Again, Or Will We?
While listening to The Who’s legendary song “Won’t Get Fooled Again,” you’ll hear, “Yeah. Meet the new boss, same as the old boss.” It seems Wall Street’s “hot money” was indeed listening as, reminiscent of 2021, the fear of missing out (performance anxiety, short squeeze) has been on full display on a year-to-date basis through 1.27.23—Figure 1. Corporate buybacks may also be adding/will add to the domestic equity markets’ move in early 2023.
Figure 1: NYSE FANG+ Index constituents’ year-to-date performance through 1.27.23. | Following massive declines in 2022, these stocks are a good example of a 2023 risk-on-pain trade.
From a short-term tactical perspective, the table above reminds me of the adage “Bulls make money, Bears make money, Pigs get slaughtered.” Tactically, tighten up short-term (trading) stops/take short-term (trading) profits in part or in whole.
Nowhere Man (Multi-Week/Month)
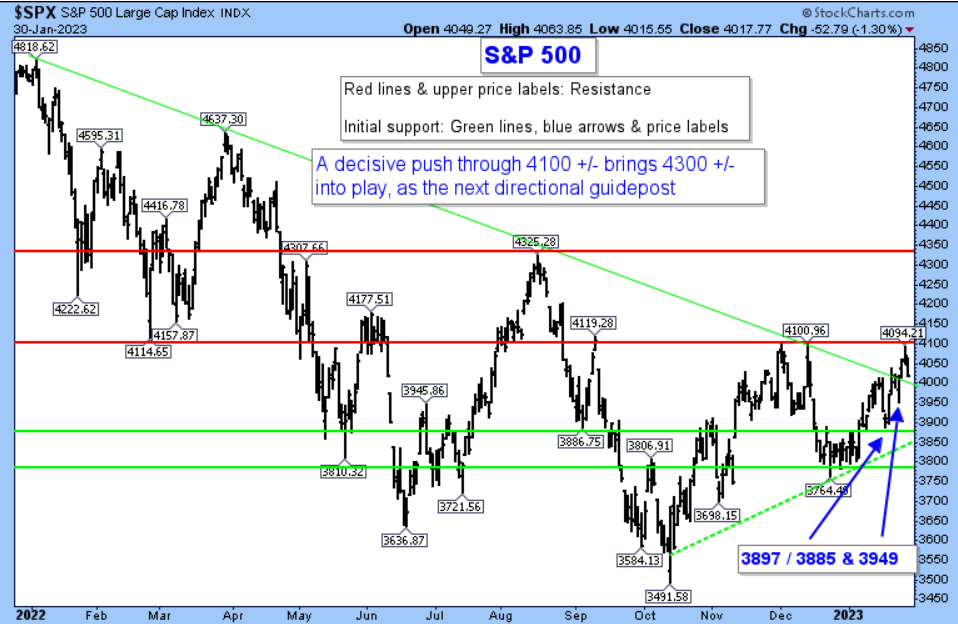
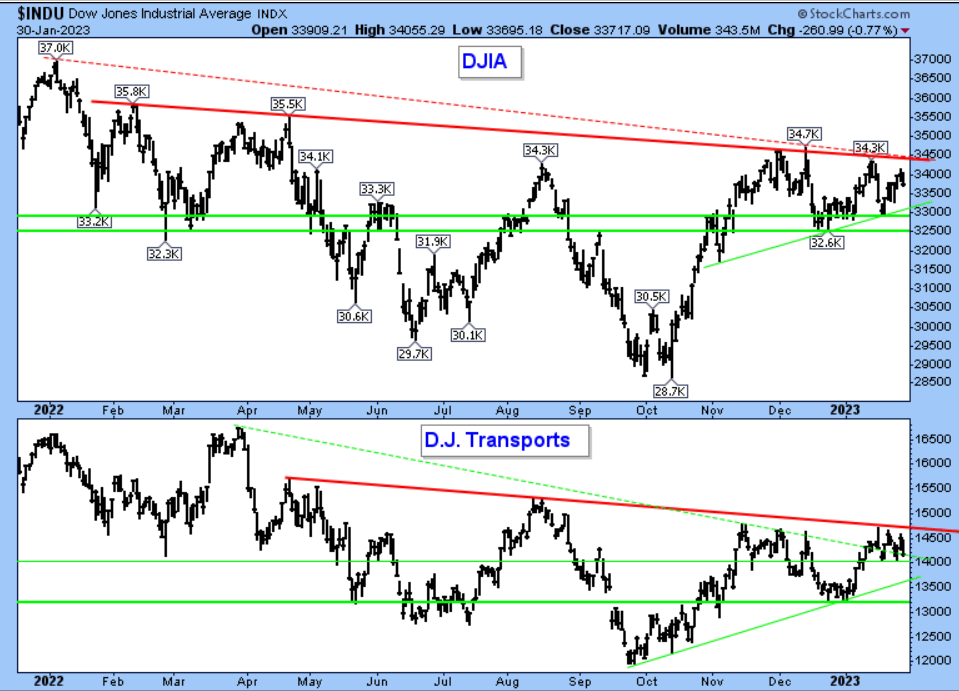
Turning to a time frame other than “year-to-date” and the Fed interest rate news on Wednesday, lyrics from the 1965 Beatles song “Nowhere Man” describe certain domestic equity market/large cap technology-driven indices: “Doesn't have a point of view; Knows not where he’s going to… Take your time, don't hurry; Leave it all 'til somebody else lends you a hand.” Figures 2-4.
Figure 2: S&P 500. | While broader domestic equity indices continue to act well (NYSE, Value Line, Russell 3000), in terms of this predominately technology-driven index, it is back to where it began in December 2022, almost 8 weeks ago. And the spring/summer of 2022, many months ago. Nowhere.curs.
Figure 3: Dow Jones Industrial Average and Dow Jones Transportation Average. | Leader to laggard and now resistance. Red lines and upper price labels = resistance. Green lines and lower price labels = support.
Figure 4: iShares Russell 2000 ETF – Small Cap proxy. | IWM continues to struggle with resistance in the $189-$190 area. A solid close above resistance could accelerate the trend higher as the Bears get squeezed.
Meanwhile
Figure 5: U.S. Dollar Index. | Coming in front of the Fed’s interest rate announcement on Wednesday afternoon, given the U.S. Dollar Index’s close proximity to support and slowly improving upside momentum (top frame), within a downtrend, an upside pop may pressure stocks lower. Tactically, tighten up short-term (trading) stops/take short-term (trading) profits in part or in whole.
Lastly
My colleague, the always-insightful Don Hagan, penned the following yesterday morning:
We do monitor cycle and seasonal indicators, though we view them as secondary inputs and do not include them as part of our quantitative evaluation. That being said, NDR notes in this morning’s Hotline that “The S&P 500 is closing in on a trifecta of positive seasonal indicators: Santa Claus, First Five Days, and January Barometer. After trifectas, the S&P 500 has risen 87% of the time by a median of 12.7%. If there was a bear in the previous year, trifecta years have seen even stronger gains in February-December.
The Day Hagan/Ned Davis Research Smart Sector strategies utilize measures of price, valuation, economic trends, monetary liquidity, and market sentiment to make objective, unemotional, rational decisions about how much capital to place at risk, as well as where to place that capital. Should the Catastrophic Stop model generate a sell signal, we will quickly move to a more defensive positioning. Please reach out for specifics and how we can support you in 2023.
Day Hagan Asset Management appreciates being part of your business, either through our research efforts or investment strategies. Please let us know how we can further support you.
Art Huprich, CMT®
Chief Market Technician
Day Hagan Asset Management
—Written 01.30.2023. Chart and table source: Stockcharts.com unless otherwise noted.
Future Online Events
Disclosure: The data and analysis contained herein are provided “as is” and without warranty of any kind, either express or implied. Day Hagan Asset Management (DHAM), any of its affiliates or employees, or any third-party data provider, shall not have any liability for any loss sustained by anyone who has relied on the information contained in any Day Hagan Asset Management literature or marketing materials. All opinions expressed herein are subject to change without notice, and you should always obtain current information and perform due diligence before investing. DHAM accounts that DHAM or its affiliated companies manage, or their respective shareholders, directors, officers and/or employees, may have long or short positions in the securities discussed herein and may purchase or sell such securities without notice. The securities mentioned in this document may not be eligible for sale in some states or countries, nor be suitable for all types of investors; their value and income they produce may fluctuate and/or be adversely affected by exchange rates, interest rates or other factors.
Investment advisory services offered through Donald L. Hagan, LLC, a SEC registered investment advisory firm. Accounts held at Raymond James and Associates, Inc. (member NYSE, SIPC) and Charles Schwab & Co., Inc. (member FINRA, SIPC). Day Hagan Asset Management is a dba of Donald L. Hagan, LLC.


