
Day Hagan Catastrophic Stop Update January 27, 2026
A downloadable PDF copy of the Article:
The Day Hagan Catastrophic Stop model held steady at 59.09%. The model continues to indicate that investors should maintain their benchmark equity exposure.
Figure 1: The Catastrophic Stop model would generate a sell signal by closing below 40% for two consecutive days. The current message remains constructive, indicating investors should maintain benchmark equity exposure.
The Daily Market Sentiment Composite remains in neutral territory.
Figure 2: Sentiment is neither overly optimistic nor pessimistic.
One of the most bullish signals in today’s market is the strength of U.S. corporate earnings. As the chart shows, the S&P 500 has tracked the steady rise in 12-month forward earnings estimates, which are now at record highs. Importantly, the recent three-month change in forward EPS is positive (+5.4%), indicating earnings momentum is accelerating—not rolling over.
History strongly supports this backdrop. When forward earnings estimates are rising, the S&P 500 has delivered +12.0% annualized returns, nearly double the +6.8% return when estimates are falling. These positive EPS periods occur about 79% of the time and come with much lower volatility (14.8% vs. 27.1%), resulting in over three times better risk-adjusted returns.
In short, rising earnings expectations remain a powerful tailwind and a key reason the primary market uptrend remains intact.
Figure 3: Earnings trends remain supportive.
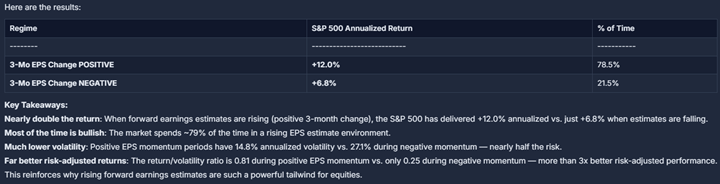
Figure 3A: Earnings trends remain supportive.
Interestingly, when forward 12-month EPS is near record highs, markets have historically trended higher, albeit with volatility. The chart highlights stronger returns and shallower drawdowns during these periods. While we, like many others, view earnings growth expectations as solid—and question whether optimism is elevated—history suggests that rising earnings expectations have generally been a powerful tailwind for equities.
Figure 4: Strong earnings growth is constructive.
Turning to volatility, the VIX and MOVE indexes have pulled back, and even the VXN (Nasdaq 100 Volatility Index) has retreated. This suggests that recent market pullbacks have been orderly rather than disorderly. We would further argue these moves reflect shifts in sentiment and positioning, not a deterioration in underlying fundamentals.
Figure 5: Volatility levels have retreated to supportive levels for equities.
Positioning indicators show systematic and algorithmic investors continuing to reduce risk from previously elevated exposure. This cohort is now closer to neutral rather than stretched, suggesting diminished forced selling pressure and increased dry powder on the sidelines. As a result, positioning leaves room for incremental buying if signals improve, meaning systematic flows could shift from a modest headwind to a latent source of demand in the next market leg.
Figure 6: Positioning is now less elevated, but still high-neutral.
DBMF’s negative equity exposure reflects a defensive stance, in our view. We have interpreted this divergence as signaling rising fragility—conditions more consistent with corrections or choppier markets than a full-fledged bear market—and that assessment remains intact. Notably, from a contrarian perspective, past instances in which DBMF’s exposure dipped below zero and subsequently reversed have often coincided with markets regaining upside momentum.
Figure 7: DBMF exposure to SPX is relatively low. Two ways to interpret this: 1) Systematic investors are nervous, and/or 2) Systematic investors are underinvested and are a potential source of demand.
Investment-grade and high-yield option-adjusted spreads remain near cycle tights, underscoring a still-constructive risk appetite and supportive technical backdrop. Overall, credit markets continue to price relatively benign default risk and ample liquidity, even in the face of heavy primary issuance and persistent macro uncertainty.
Figure 8: Credit spreads holding tight indicate that recent volatility isn’t likely to morph into a big bear market for equities. Note that, historically, when OAS credit spreads are below 1.00, max drawdowns have been muted.
The S&P 500 currently exhibits positive gamma. This environment reduces intraday volatility but can shift quickly.
Figure 9: SPX gamma condition is currently positive. Gamma flips to negative below 6,912.61.
The Japanese yen carry trade is facing growing headwinds as Japan’s interest rates drift higher and yield differentials narrow. Increased FX volatility, periodic yen strength, and lingering intervention risk have reduced the trade’s appeal and encouraged more hedging and position trimming. While conditions are clearly less supportive than in prior years, the trade is not yet experiencing a disorderly unwind. Instead, flows suggest a gradual cooling rather than an abrupt reversal—for now.
The Japanese yen carry trade—borrowing low-yielding yen to invest in higher-yielding assets—amplified risk-taking in early 2025, supporting global equities until bouts of yen strength triggered sharp, cross-asset de-risking. A similar dynamic played out during the LTCM crisis, when rapid yen appreciation forced leveraged unwinding. Today, the trade remains sizable, though less leveraged, with estimates suggesting hundreds of billions of dollars still linked to yen-funded positions globally.
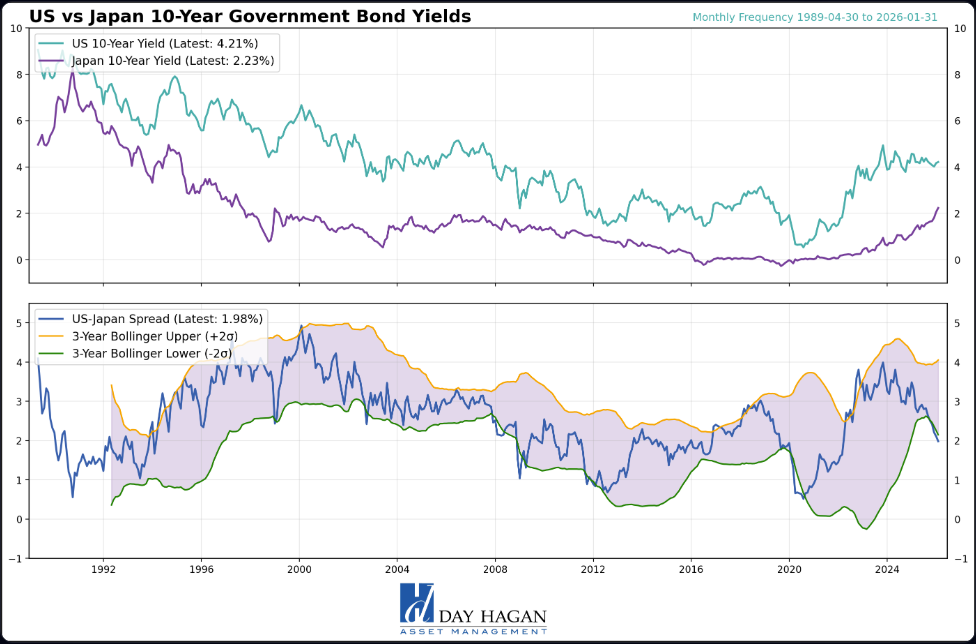
Figure 10: The carry trade isn’t crashing, but pressure is building. Higher Japanese yields, yen moves, and tightening funding conditions make it less lucrative — meaning the risk of a more meaningful unwind is rising.
Let’s discuss silver ripping higher—and remaining volatile. We have no opinion, but here are some thoughts because many of you asked. Momentum, ETF flows, weak real rates, and inflation-hedging have fueled gains, while its small market cap amplifies moves. Elevated SLV short interest adds fuel, though recent outflows (chart below) raise questions about sustainability. We view this as retail-driven FOMO, which often ends abruptly. Silver is a buy on macro and momentum support, but a sell given volatility, crowded positioning, and reversal risk. The question is, why does someone own it? A trade is far different from owning it as a hedge against currency risk, inflation, or geopolitical upheavals.
Figure 11: Relative to history, silver fundamentals lean constructive. Easing real yields, supportive liquidity, and an elevated gold–silver ratio favor upside, while industrial demand remains mildly bullish. Production costs are neutral. Rehypothecation may amplify rallies by increasing market fragility, reinforcing volatility rather than driving prices outright at this time.
U.S. Economic Releases:
Recent U.S. economic reports have generally beaten expectations, with the Citigroup Economic Surprise Index trending positive, signaling data coming in stronger than consensus forecasts. At the same time, U.S. flash PMIs remain in expansion territory, indicating ongoing growth in both manufacturing and services despite some moderation. Together, these suggest underlying economic resilience, which has underpinned risk assets and influenced monetary policy expectations.
Still out there: As of late January 2026, the U.S. Supreme Court has not yet ruled on the legality of President Trump’s tariff program after hearing oral arguments on November 5, 2025. The justices did not issue a decision during the January sittings and have not publicly scheduled the release of the tariff opinion. The next potential opinion days are expected when the Court returns after recess, with Friday, February 20, noted as the earliest likely session to issue decisions, though the timing remains uncertain.
Odds of a Fed rate cut tomorrow (Jan. 28, 2026): Markets are overwhelmingly pricing no rate cut at the upcoming FOMC decision. CME Group’s FedWatch tool and prediction markets show roughly a 95–99% probability that the federal funds rate stays at 3.50%–3.75%, with the chance of a 25 bp cut at around ~1–5% or lower.
As of the latest pricing, a rate cut at the March 18 meeting still shows strong odds of no change, and probabilities of a cut only climb meaningfully toward the June 17, 2026, FOMC, where pricing shows the chance of a lower target range (e.g., 3.25–3.50%) approaching or exceeding 50%. By late summer (July), markets increasingly price a cut as more likely than not.
Unemployment Claims on Thursday – so far, trending well.
PPI on Friday. The most recent U.S. Producer Price Index (PPI) for November showed a 0.2% monthly increase, in line with expectations, after a prior 0.1% gain. Final demand for goods rose 0.9%, driven largely by energy costs, while services were flat. On a 12-month basis, producer prices are up about 3.0 %, slightly above forecasts, suggesting ongoing wholesale inflation pressures. Core PPI also continues firm, though not accelerating sharply.
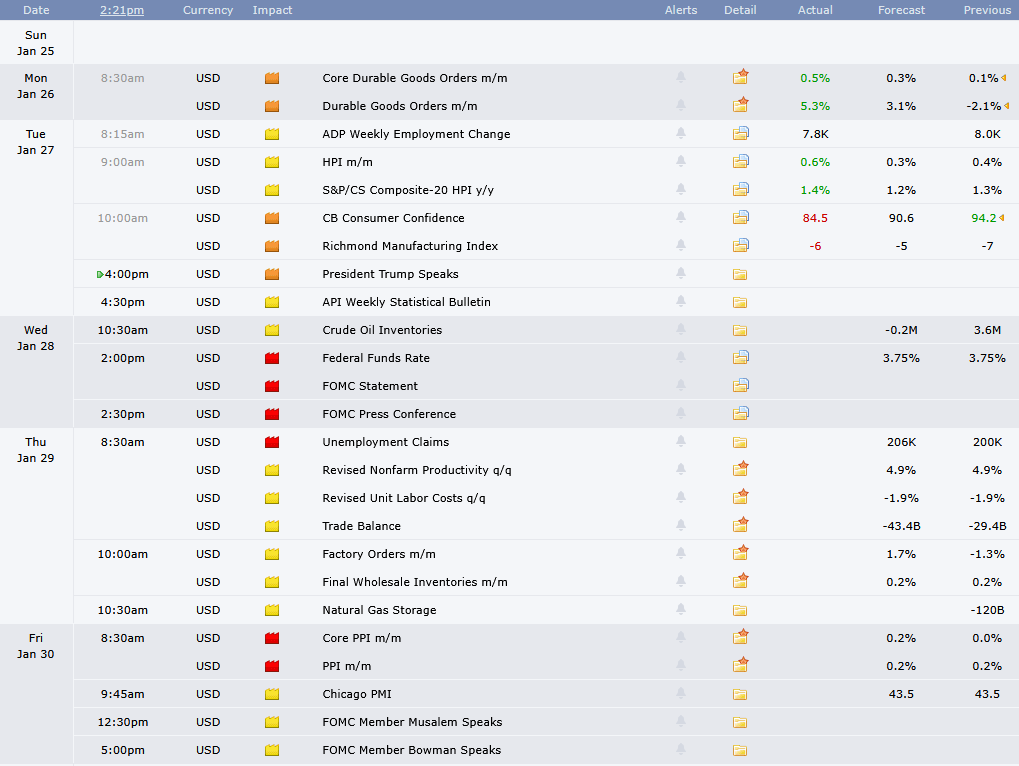
Figure 12: Economic release calendar.
Bottom Line: The U.S. equity outlook for early 2026 remains cautiously optimistic, though volatility is likely to stay elevated. Earnings growth expectations near the mid-teens, resilient economic data, and improving productivity trends provide support, even as markets push out the timing of Fed rate cuts toward mid-2026. Recent economic reports, a positive Citigroup Economic Surprise Index, and expansionary U.S. flash PMIs point to continued underlying strength. However, firm PPI readings, sticky services inflation, policy and trade uncertainty, and tentative labor-market cooling temper enthusiasm. In this environment, choppy markets should continue to reward high-quality, cash-rich companies, with AI-driven productivity, onshoring, and strong balance sheets supporting upside potential through disciplined, selective exposure.
For more details on each sector and current model levels, please visit our research page at https://dayhagan.com/research.
This strategy uses measures of price, valuation, economic trends, liquidity, and market sentiment to make objective, rational, and emotion-free decisions about how much capital to place at risk and where to allocate it.
If you would like to discuss any of the above or our approach to investing in more detail, please don’t hesitate to schedule a call or webinar. Please call Tyler Hagan at 941-330-1702 to arrange a convenient time for you.
Sincerely,
Donald L. Hagan, CFA
Chief Investment Strategist, Partner, Co-Founder
This material is for educational purposes only. Further distribution is prohibited without prior permission. Please see the information on Disclosures here: https://dhfunds.com/literature. Charts with models and return information use indices for performance testing to extend the model histories, and they should be considered hypothetical.
All Rights Reserved. © Copyright 2026 Day Hagan Asset Management. Data sources: Day Hagan Asset Management, 3Fourteen Research, J.P. Morgan, Goldman Sachs, Barchart, StreetStats, Atlanta Fed, St. Louis Fed, Koyfin, Yardeni, MarketEar, S&P Global, SPDR, FactSet.
Disclosures
S&P 500 Index—An unmanaged composite of 500 large-cap companies, this index is widely used by professional investors as a performance benchmark for large-cap stocks.
S&P 500 Total Return Index – An unmanaged composite of 500 large capitalization companies. Professional investors widely use this index as a performance benchmark for large-cap stocks. This index assumes reinvestment of dividends.
Sentiment – Market sentiment is the prevailing attitude of investors toward a company, a sector, or the financial market.
CBOE Volatility Index (VIX) – A real-time index that represents the market’s expectations for the relative strength of near-term price changes of the S&P 500 Index (SPX). Because it is derived from SPX index options with near-term expiration dates, it produces a 30-day forward volatility projection. Volatility, or how quickly prices change, is often seen as a way to gauge market sentiment, particularly the degree of fear among market participants.
OBOS Indicators—The overbought/Oversold (OBOS) index relates the difference between today’s closing price and the period’s low closing price to the trade margin of the given period.
NFIB – The National Federation of Independent Business advocates for America’s small and independent business owners.
Purchasing Manager Indexes (PMIs) – Purchasing Managers’ Indexes are survey-based economic indicators designed to provide timely insight into business conditions.
FOMC Meeting – The FOMC (Federal Open Market Committee) holds eight regularly scheduled meetings per year. At these meetings, the Committee reviews economic and financial conditions, determines the appropriate stance of monetary policy, and assesses the risks to its long-term goals of price stability and sustainable economic growth.
Consumer Price Index (CPI) – Measures the monthly change in prices paid by U.S. consumers. The Bureau of Labor Statistics (BLS) calculates the CPI as a weighted average of prices for a basket of goods and services representative of aggregate U.S. consumer spending.
Disclosure: The information contained herein is provided for informational purposes only and should not be construed as investment advice or a recommendation to buy or sell any security. The securities, instruments, or strategies described may not be suitable for all investors, and their value and income may fluctuate. Past performance is not indicative of future results, and there is no guarantee that any investment strategy will achieve its objectives, generate profits, or avoid losses.
This material is intended to provide general market commentary and should not be relied upon as individualized investment advice. Investors should consult with their financial professional before making any investment decisions based on this information.
Data and analysis are provided “as is” without warranty of any kind, either express or implied. Day Hagan Asset Management, its affiliates, employees, or third-party data providers shall not be liable for any loss sustained by any person relying on this information. All opinions and views expressed are subject to change without notice and may differ from those of other investment professionals within Day Hagan Asset Management or Ashton Thomas Private Wealth, LLC.
Accounts managed by Day Hagan Asset Management or its affiliates may hold positions in the securities discussed and may trade such securities without notice.
Day Hagan Asset Management is a division of and doing business as (DBA) Ashton Thomas Private Wealth, LLC, an SEC-registered investment adviser. Registration with the SEC does not imply a certain level of skill or training.
There is no guarantee that any investment strategy will achieve its objectives, generate dividends, or avoid losses.
For more information, please contact us at:
Day Hagan Asset Management
1000 S. Tamiami Trail, Sarasota, FL 34236
Toll-Free: (800) 594-7930
Office Phone: (941) 330-1702
Websites: https://dayhagan.com or https://dhfunds.com
© 2026 Day Hagan Asset Management
