
Day Hagan Catastrophic Stop Update February 4, 2026
A downloadable PDF copy of the Article:
The Day Hagan Catastrophic Stop model held steady at 59.09%. The model continues to indicate that investors should maintain their benchmark equity exposure.
Many of our indicators are situated near neutral levels. If the current decline (the SPX is just 2.3% below the all-time high) shows signs of becoming significant, our indicators are poised to signal risk-off.
Figure 1: The Catastrophic Stop model would generate a sell signal by closing below 40% for two consecutive days. The current message remains constructive, indicating investors should maintain benchmark equity exposure.
As of February 3, the S&P 500 is increasingly characterized by shorter-term oversold technical signals rather than overbought ones. Following yesterday’s decline, the index's Relative Strength Index (RSI) has moved away from overbought levels and is trending toward neutral or oversold territory. This shift is even more pronounced within specific sectors; for instance, a record 73% of software stocks are now screened as oversold.
Gamma Regime: Dealers are navigating into negative gamma, a scenario that typically amplifies market volatility. Currently, the market is just below critical support in the 6,890–6,900 zone, reinforced by 0DTE (zero days to expiration) put buying. Remember, gamma works both ways.
Volatility Outlook: The VIX rose and closed at 18 on February 3, but just moved above 20 as of this writing, and remains a focal point. Implied volatility for the SPX just moved to 16.5%, up from historic volatility of 9.66%. The IV rank is 18.33% while the IV percentile is 77%. The data presents a slight conflict between the IV Rank (indicating low volatility within its absolute range) and the IV Percentile (indicating high volatility most of the time). Both metrics indicate that options premiums are moderately expensive to slightly high relative to historical norms. Bottom Line: Abject fear is not present at this time.
OBOS Status: While the broader benchmark is just beginning to cool, technical damage is deep in pockets like software and broader tech, where 45% of names are in oversold territory. By contrast, consumer staples (XLP) have surged to all-time highs, indicating a violent risk re-rating rather than total market exhaustion.
Headwinds Subsiding: Some macro indicators eased yesterday, but are back today; Treasury yields barely softened on February 3, and oil prices fell sharply toward $62/barrel (WTI) following signals of de-escalation in Middle East tensions. Oil prices are back up today, and the 10-year Treasury yield is basically unchanged. We’re watching closely for signs of a secular breakout rather than crisis-induced noise. So far, oil looks like a headline event (even though inventories were down as of today’s data).
Sentiment Outlook: Sentiment is currently "cautiously optimistic" as the market rotates from mega-cap tech into small-cap and value stocks. Breadth is better than one might think (chart below).
Hedging Strategies: Given the "risk-off" posture and potential for further multiple compression, investors are eyeing low-cost tail risk protection. As puts are added, the negative gamma condition worsens. This can shift very quickly as those positions are reversed.
As of right now, the decline reflects, in our view, rotation, rather than a fundamental shift in data trends. Our Information Technology sector model shifted lower with this month's rebalance. We reduced Info Tech exposure to underweight earlier this week and added exposure to Energy, Staples, Utilities, and Health Care.
Let’s look at the models and some interesting indicators.
The Daily Market Sentiment Composite remains in neutral territory. Neither a headwind nor a tailwind.
Figure 2: Sentiment is neither overly optimistic nor pessimistic.
Turning to volatility, the VIX and MOVE indexes are still relatively tame but reflect recent investor angst.
Figure 3: Volatility levels are increasing, but not yet in the danger zone.
The MOVE index is still at historically low levels.
Figure 4: MOVE remains at the low end of its long-term range. (Source: StreetStats.com)
The number of SPX stocks above their respective 50- and 200-day moving averages is neutral.
Figure 5: Breadth is OK for the broad market, not so good for the former generals.
This might surprise you; through last night’s close, a net of 87.24% of SPX stocks hit a new 52-week high. Again, this reflects the rotation. Meanwhile, a net 63.27% of stocks hit new 10-day highs. (Smoothed 10 days to limit noise.)
Figure 6: More stocks advancing to new highs than not.
As described in last week’s update, Mag 7’s performance appeared stretched relative to Quality. That is currently reversing and is reminiscent of Q1 2025.
Figure 7: Quality gaining ground.
Even within sectors, there are stark differences in industry performance. Software’s performance relative to semis has been abysmal since late 2022. In our view, the current relative performance looks more like a final thrust lower.
Figure 8: The performance differential between software and semis is extreme.
Note that the software and semis percentages of the Information Technology sector are now relatively similar, a stark change from 2020.
Figure 9: Semis taking a larger share of the sector.
One of the most bullish signals in today’s market is the strength of U.S. corporate earnings. As the chart shows, the S&P 500 has tracked the steady rise in 12-month forward earnings estimates, which are now at record highs. Importantly, the recent three-month change in forward EPS is positive (improving from 5.4% last week to +6.0%), indicating earnings momentum is accelerating—not rolling over.
History strongly supports this backdrop. When forward earnings estimates are rising, the S&P 500 has delivered +12.0% annualized returns, nearly double the +6.8% return when estimates are falling. These positive EPS periods occur about 79% of the time and are associated with much lower volatility (14.8% vs. 27.1%), resulting in over three times the risk-adjusted returns.
In short, rising earnings expectations remain a powerful tailwind and a key reason the primary market uptrend remains intact.
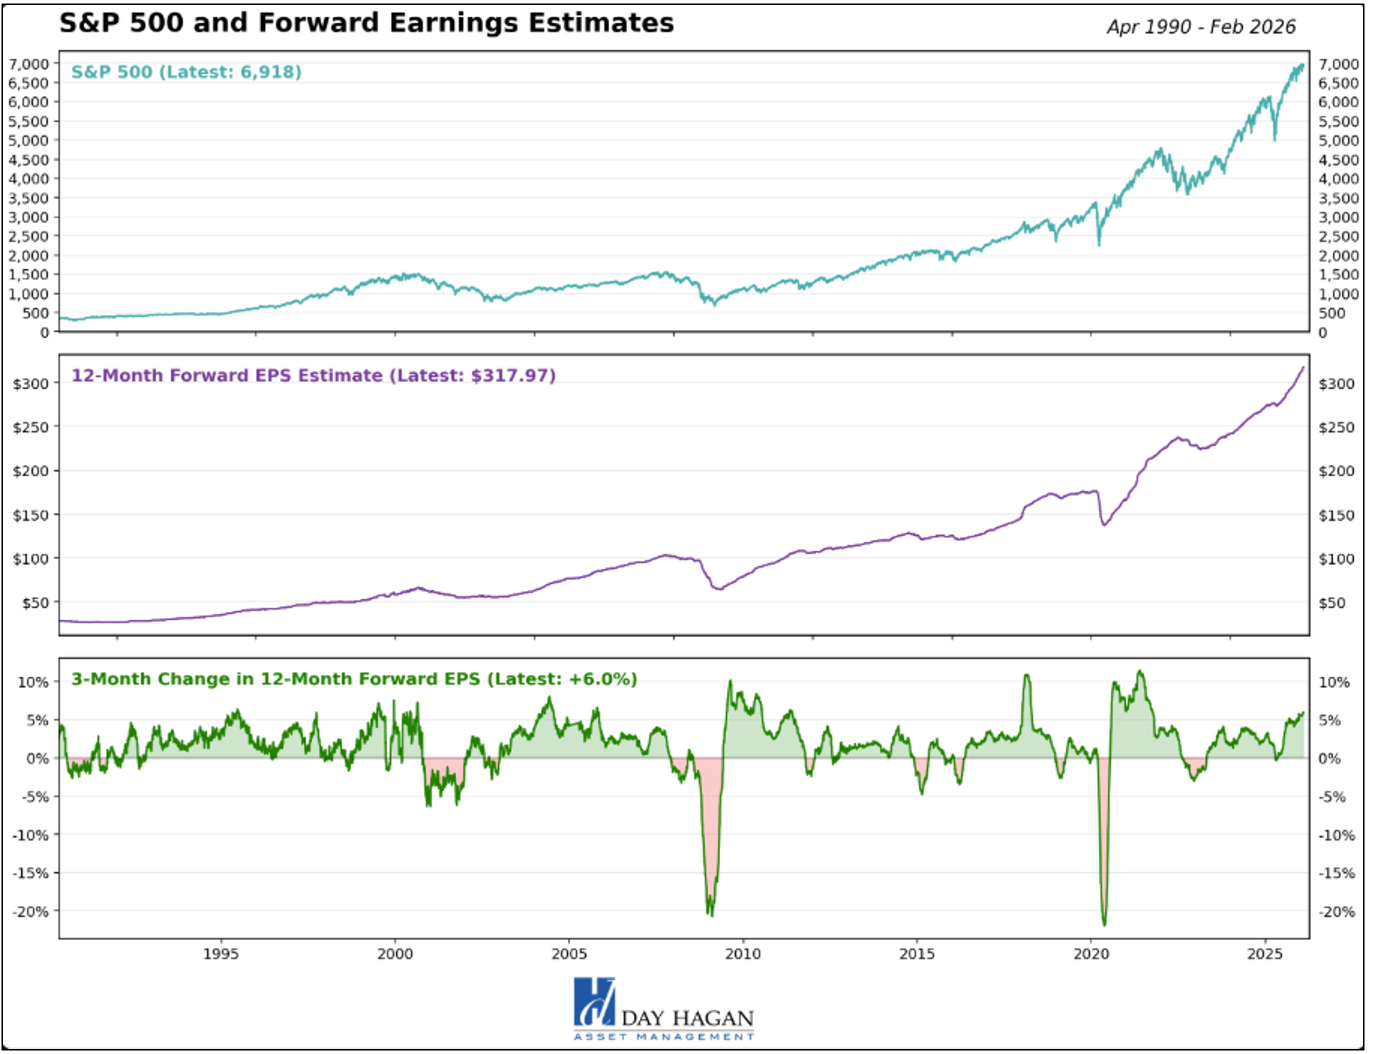
Figure 10: Earnings trends remain supportive.
Positioning indicators show systematic and algorithmic investors continuing to reduce risk from previously elevated exposure. This cohort is now closer to neutral rather than stretched, suggesting diminished forced selling pressure and increased dry powder on the sidelines. As a result, positioning leaves room for incremental buying if signals improve, meaning systematic flows could shift from a modest headwind to a latent source of demand in the next market leg.
Figure 11: Positioning is now less elevated, but still high-neutral.
DBMF’s negative equity exposure reflects a defensive stance, in our view. We have interpreted this divergence as signaling rising fragility—conditions more consistent with corrections or choppier markets than a full-fledged bear market—and that assessment remains intact. Notably, from a contrarian perspective, past instances in which DBMF’s exposure dipped below zero and subsequently reversed have often coincided with markets regaining upside momentum.
Figure 12: DBMF exposure to SPX is relatively low. Two ways to interpret this: 1) Systematic investors are nervous, and/or 2) Systematic investors are underinvested and are a potential source of demand.
Short interest data is lagged, but judging from last week's data, shorts are in place. This provides a natural source of demand as shorts are covered in a decline. It’s an even more striking source of demand, as shorts may be forced to cover in a market reversal.
Figure 13: Shorts are at high levels, based on this analysis.
Investment-grade and high-yield option-adjusted spreads remain near cycle tights, underscoring a still-constructive risk appetite and supportive technical backdrop. Overall, credit markets continue to price in relatively benign default risk and ample liquidity, even amid heavy primary issuance and persistent macroeconomic uncertainty.
Figure 14: Credit spreads holding tight indicate that recent volatility isn’t likely to morph into a big bear market for equities. Note that, historically, when OAS credit spreads are below 1.00, max drawdowns have been more muted.
The S&P 500 currently exhibits negative gamma. This environment increases intraday volatility but can shift quickly.
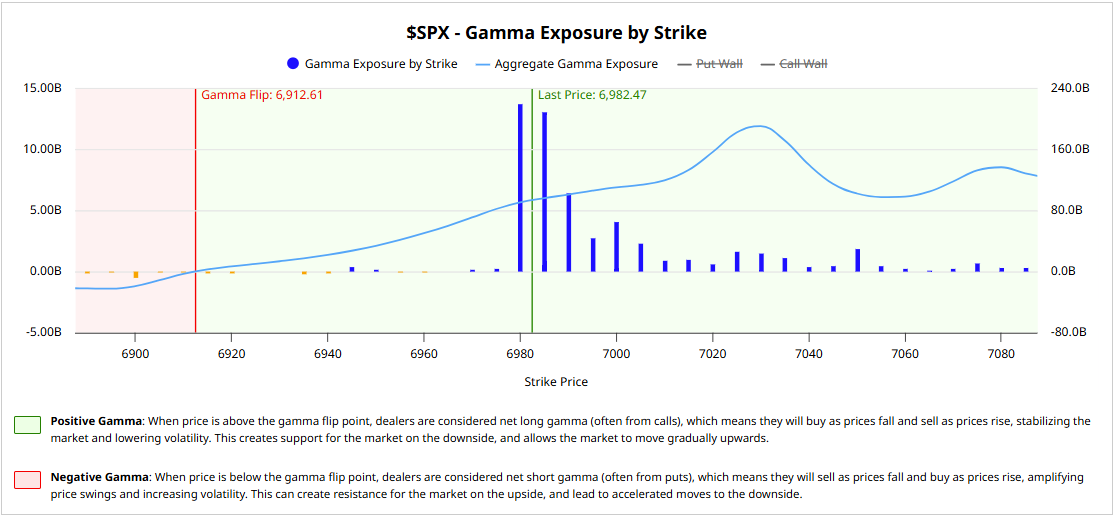
Figure 15: SPX gamma condition is currently negative. Gamma flips to positive above 6,921.94. (Source: Barchart)
Shifting to the macro environment, inflation concerns have intensified as energy prices and breakeven rates trend higher. While we acknowledge these pressures, we remain focused on the 5-year breakeven for a clearer signal, as the 1-year rate is prone to excessive volatility. Currently, the 1-year rate has surged—driven by investor front-loading of trade policy shifts and fiscal expansion—while long-term expectations remain anchored near the Fed’s target.
Compounding these concerns, energy prices spiked today following a breakdown in U.S.-Iran nuclear talks and maritime friction in the Middle East. WTI Crude climbed 3.35% to $65.33/bbl, while Natural Gas futures jumped nearly 5% to $3.48/MMBtu.
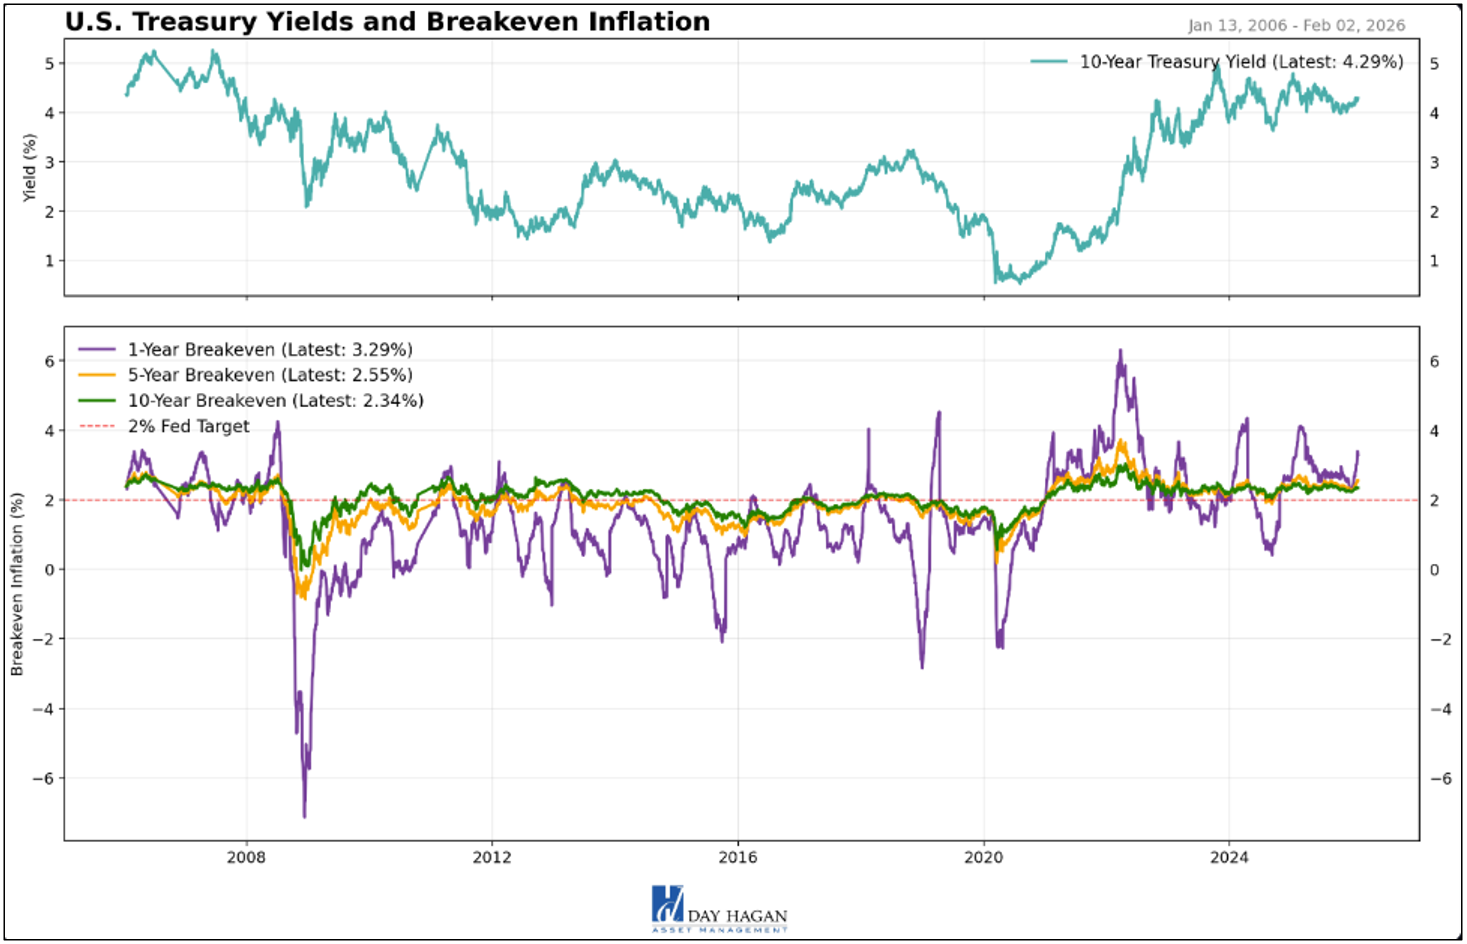
Figure 16: At this point, we do not envision inflation breaking out to the upside.
Recent Core PCE inflation and Core CPI inflation. Both are heading in the “right direction.”
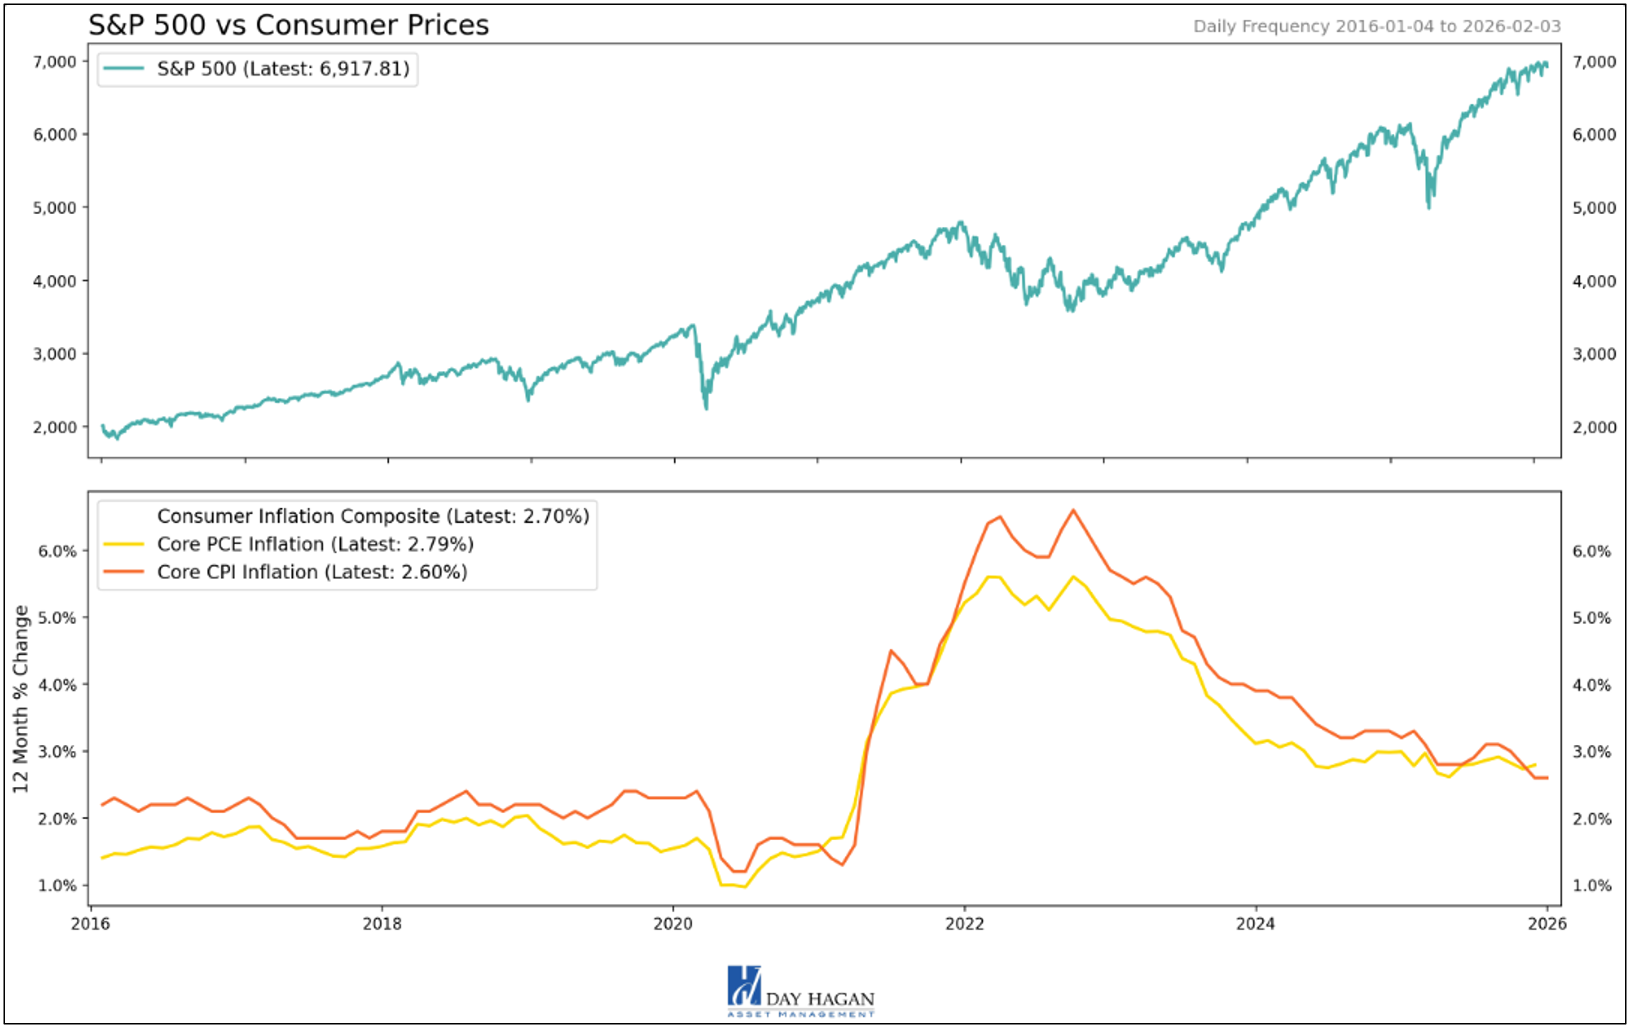
Figure 17: Inflation is expected to ease in fits and starts. Recent housing data support lower inflation moving forward.
The latest ISM PMI surveys signal a "good news/bad news" environment. Manufacturing jumped to 52.6, ending its contraction as firms likely front-loaded orders to beat looming tariffs. Meanwhile, the Services PMI remains robust at 53.8, driven by the ongoing AI data center boom. For investors, the takeaway is "higher-for-longer." Robust activity, combined with a sharp rise in the Prices Index (66.6 in services), indicates persistent inflation that is likely to delay Federal Reserve rate cuts. While the rebound in factory demand is a positive growth signal, rising input costs and lengthening supplier delivery times threaten profit margins. Monitor the Institute for Supply Management for upcoming sectoral breakdowns, as this "sticky" growth suggests the U.S. Dollar will maintain its strength through the first half of 2026.
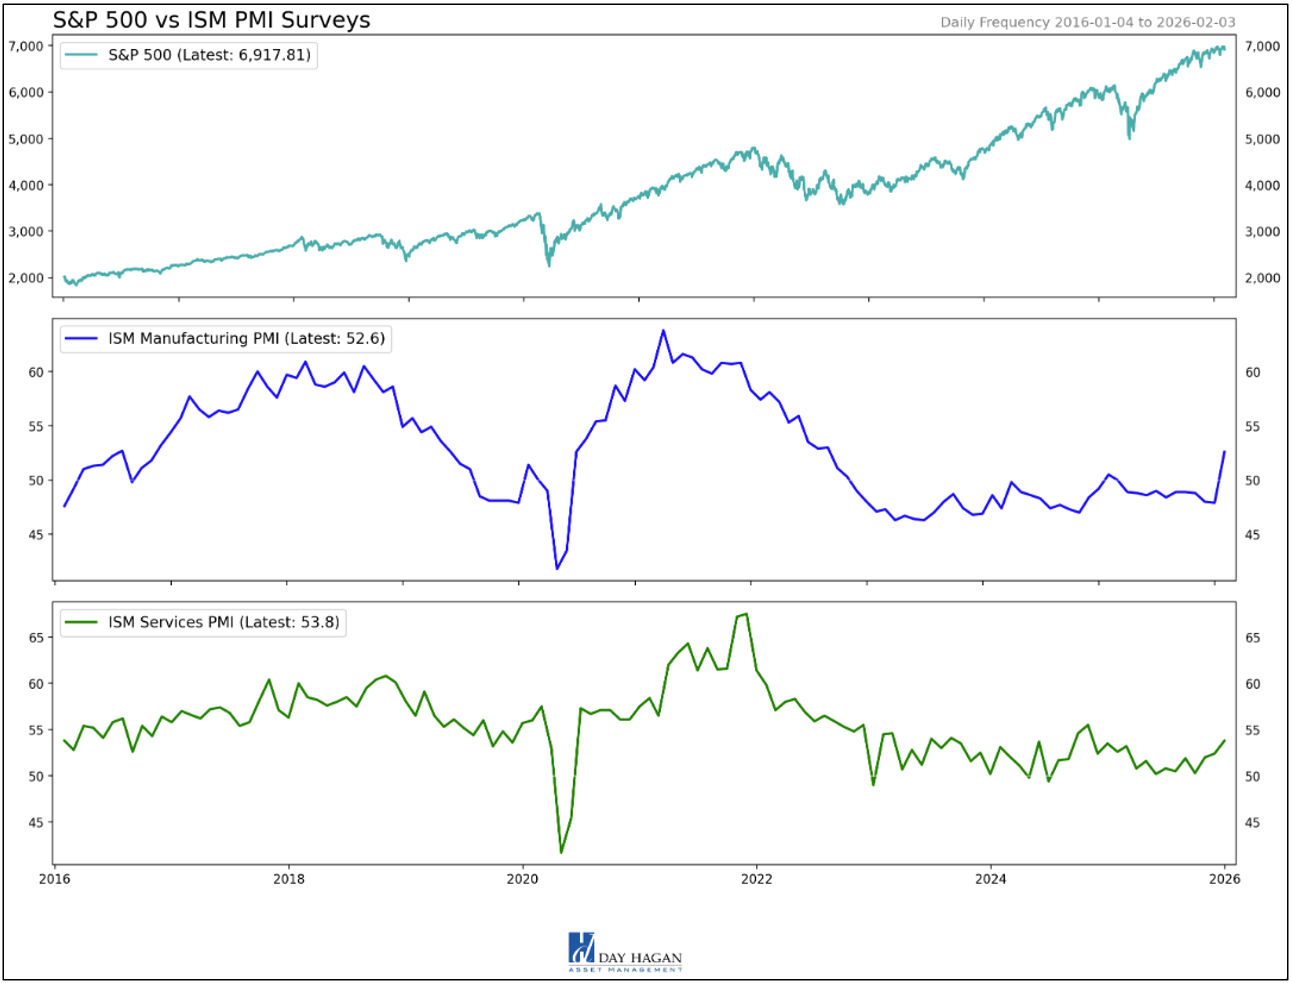
Figure 18: PMIs signal good growth but potentially may keep the Fed on the sidelines. Employment trends will be key, and recent data continues to support “low-hire, low-fire).
U.S. Economic Releases:
The economic reports from the past two weeks signal a shift toward "hawkish stability," characterized by robust output paired with a cooling labor market. The Federal Reserve’s January 28 decision to maintain rates at 3.50%–3.75% marks a pivot from aggressive easing to a data-dependent pause, primarily because inflation remains "sticky" near 3%. While the Atlanta Fed’s 4.2% GDP projection suggests strong underlying momentum, today’s ADP report revealed a sharp deceleration in private hiring, with only 22,000 jobs added in January. This labor softening, particularly in large firms, suggests that while the economy isn't stalling, the post-pandemic hiring boom has concluded. For investors, this environment demands a transition from growth-at-any-price strategies to a focus on high-quality earnings and defensive positioning. As wage growth persists at 4.5%, the Fed remains wary of a secondary inflationary spike, which will likely keep market volatility elevated until the official labor data is released.
Still out there: As of today, the U.S. Supreme Court has not yet ruled on the legality of President Trump’s tariff program after hearing oral arguments on November 5, 2025. The next potential opinion days are expected when the Court returns after recess, with Friday, February 20, noted as the earliest likely session to issue decisions, though the timing remains uncertain.
Unemployment Claims on Thursday – so far, trending well.
Friday – Consumer Credit. (FYI, UofM Consumer Sentiment is broken, in our view.)
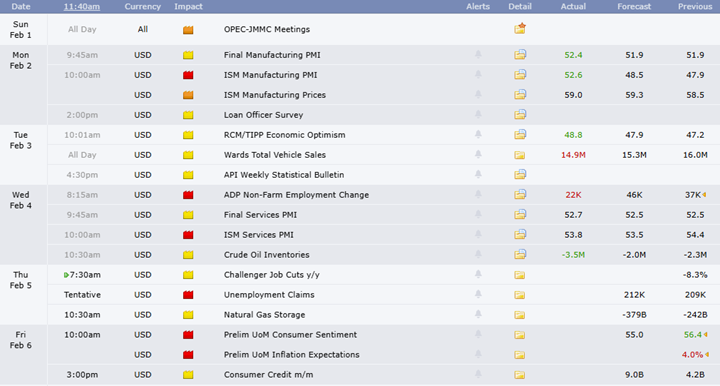
Figure 19: Economic release calendar.
Bottom Line: The U.S. equity outlook for early 2026 reflects a "hawkish stability," where robust output meets a cooling labor market. While the Atlanta Fed’s 4.2% GDP projection and expansionary PMIs signal underlying strength, January’s ADP report revealed a sharp deceleration with only 22,000 jobs added. This labor softening, paired with the Federal Reserve’s January 28 decision to pause rates at 3.50%–3.75%, suggests the era of aggressive easing has transitioned into data-dependent patience. With inflation sticky near 3% and a CAPE ratio approaching 40, the period of pure multiple expansion is fading. Investors face a "Goldilocks" transition in which high valuations for tech giants necessitate a rotation toward small caps and value sectors. In this choppy environment, success depends on disciplined exposure to high-quality, cash-rich companies with durable earnings. Prioritizing AI-driven productivity and defensive income will be essential as markets navigate trade uncertainty and the absence of official labor data.
For more details on each sector and current model levels, please visit our research page at https://dayhagan.com/research.
This strategy uses measures of price, valuation, economic trends, liquidity, and market sentiment to make objective, rational, and emotion-free decisions about how much capital to place at risk and where to allocate it.
If you would like to discuss any of the above or our approach to investing in more detail, please don’t hesitate to schedule a call or webinar. Please call Tyler Hagan at 941-330-1702 to arrange a convenient time.
Sincerely,
Donald L. Hagan, CFA
Chief Investment Strategist, Partner, Co-Founder
This material is for educational purposes only. Further distribution is prohibited without prior permission. Please see the information on Disclosures here: https://dhfunds.com/literature. Charts with models and return information use indices for performance testing to extend the model histories, and they should be considered hypothetical. All Rights Reserved.
© Copyright 2026 Day Hagan Asset Management. Data sources: Day Hagan Asset Management, 3Fourteen Research, J.P. Morgan, Goldman Sachs, Barchart, StreetStats, Atlanta Fed, St. Louis Fed, Koyfin, Yardeni, MarketEar, S&P Global, SPDR, FactSet.
Disclosures
S&P 500 Index—An unmanaged composite of 500 large-cap companies, this index is widely used by professional investors as a performance benchmark for large-cap stocks.
S&P 500 Total Return Index – An unmanaged composite of 500 large capitalization companies. Professional investors widely use this index as a performance benchmark for large-cap stocks. This index assumes reinvestment of dividends.
Sentiment – Market sentiment is the prevailing attitude of investors toward a company, a sector, or the financial market.
CBOE Volatility Index (VIX) – A real-time index that represents the market’s expectations for the relative strength of near-term price changes of the S&P 500 Index (SPX). Because it is derived from SPX index options with near-term expiration dates, it produces a 30-day forward volatility projection. Volatility, or how quickly prices change, is often seen as a way to gauge market sentiment, particularly the degree of fear among market participants.
OBOS Indicators—The overbought/Oversold (OBOS) index relates the difference between today’s closing price and the period’s low closing price to the trade margin of the given period.
NFIB – The National Federation of Independent Business advocates for America’s small and independent business owners.
Purchasing Manager Indexes (PMIs) – Purchasing Managers’ Indexes are survey-based economic indicators designed to provide timely insight into business conditions.
FOMC Meeting – The FOMC (Federal Open Market Committee) holds eight regularly scheduled meetings per year. At these meetings, the Committee reviews economic and financial conditions, determines the appropriate stance of monetary policy, and assesses the risks to its long-term goals of price stability and sustainable economic growth.
Consumer Price Index (CPI) – Measures the monthly change in prices paid by U.S. consumers. The Bureau of Labor Statistics (BLS) calculates the CPI as a weighted average of prices for a basket of goods and services representative of aggregate U.S. consumer spending.
Disclosure: The information contained herein is provided for informational purposes only and should not be construed as investment advice or a recommendation to buy or sell any security. The securities, instruments, or strategies described may not be suitable for all investors, and their value and income may fluctuate. Past performance is not indicative of future results, and there is no guarantee that any investment strategy will achieve its objectives, generate profits, or avoid losses.
This material is intended to provide general market commentary and should not be relied upon as individualized investment advice. Investors should consult with their financial professional before making any investment decisions based on this information.
Data and analysis are provided “as is” without warranty of any kind, either express or implied. Day Hagan Asset Management, its affiliates, employees, or third-party data providers shall not be liable for any loss sustained by any person relying on this information. All opinions and views expressed are subject to change without notice and may differ from those of other investment professionals within Day Hagan Asset Management or Ashton Thomas Private Wealth, LLC.
Accounts managed by Day Hagan Asset Management or its affiliates may hold positions in the securities discussed and may trade such securities without notice.
Day Hagan Asset Management is a division of and doing business as (DBA) Ashton Thomas Private Wealth, LLC, an SEC-registered investment adviser. Registration with the SEC does not imply a certain level of skill or training.
There is no guarantee that any investment strategy will achieve its objectives, generate dividends, or avoid losses.
For more information, please contact us at:
Day Hagan Asset Management
1000 S. Tamiami Trail, Sarasota, FL 34236
Toll-Free: (800) 594-7930
Office Phone: (941) 330-1702
Websites: https://dayhagan.com or https://dhfunds.com
© 2026 Day Hagan Asset Management
