
Day Hagan Smart Sector® with Catastrophic Stop Strategy Update February 2026
A downloadable PDF copy of the Article:
Day Hagan Smart Sector® with Catastrophic Stop Strategy Update February 2026 (pdf)
Executive Summary
U.S. equities entered 2026 with a mixed but generally constructive tone, and beneath a relatively calm headline index, the 11 cap-weighted S&P 500 sectors told a story of rotation rather than runaway risk‑on. Technology and Communication Services remained in the spotlight as investors continued to bet on artificial intelligence and cloud infrastructure, but leadership was less one-sided than in 2025. Earnings season brought solid, if unspectacular, results from several megacap platforms, with management teams emphasizing AI-driven efficiency gains and disciplined capital spending, themes that helped support sentiment even as valuation concerns lingered.
Macro data and the Federal Reserve set the backdrop. The Fed’s preferred inflation gauge, core PCE, finished 2025 above the 2% target, and Fed speakers in late January signaled a willingness to keep policy rates elevated until they gain more confidence that inflation is on a durable path lower. That “higher for longer” bias created a headwind for some interest-sensitive sectors such as Real Estate and Utilities, which struggled with the combination of elevated financing costs and investor preference for growth and quality over pure defensiveness. Financials, meanwhile, faced a more complicated narrative: a somewhat steeper curve and steady credit fundamentals were offset by idiosyncratic earnings disappointments and cautious guidance from several large banks, leaving the sector lagging the broader market despite improving macro-optics.
Cyclicals showed tentative signs of revival. Industrials and Materials found support from improving global manufacturing surveys—PMIs in the eurozone and parts of Asia moved closer to expansion—as well as optimism around onshoring, infrastructure spending, and data‑center buildouts tied to AI and electrification. Energy continued to trade as a macro and geopolitics barometer, responding to shifting expectations for global demand and supply risks. On the defensive side, Consumer Staples benefited from their traditional role as ballast but competed with Health Care, where Q4 earnings highlighted stable demand and robust innovation pipelines in biotech and medical technology.
International influences were a constant undertone. Softer but stabilizing growth in Europe, ongoing policy support in China, and firmer activity across key Asian exporters all fed into sector-level dispersion, rewarding U.S. companies with global reach in Industrials, Materials, and select Consumer sectors, even as investors remained selective about where to pay up for cyclicality.
Holdings
Sector
Consumer Discretionary
Consumer Staples
Communication Services
Energy
Financials
Health Care
Industrials
Information Technology
Materials
Real Estate
Utilities
Outlook (relative to benchmark weighting)
Overweight
Neutral
Overweight
Overweight
Underweight
Underweight
Underweight
Neutral
Overweight
Underweight
Overweight
Sector Review
Our February sector tilts imply a macro view centered on moderate growth, easing financial conditions, and a preference for secular over cyclical drivers. This sector positioning reflects our investment philosophy and how we express macro themes in the portfolio. For example, overweighting Consumer Discretionary and Communication Services signals confidence in the durability of the U.S. consumer and in the ongoing monetization of digital platforms, streaming, and online advertising. We are willing to own more cyclical and growth-oriented earnings than the benchmark, but we are doing so selectively, favoring businesses with strong balance sheets and pricing power. Overweights in Energy and Materials highlight our conviction in real assets and cash-flow-generative cyclicals, reflecting themes such as constrained commodity supply, infrastructure and reshoring investment, and the physical demands of AI, electrification, and data center buildouts.
At the same time, overweighting Utilities provides a defensive counterweight and a way to participate in long-term infrastructure and grid modernization trends without relying solely on high-beta growth. Neutral weights in Information Technology and Consumer Staples suggest respect for their quality and earnings resilience, while acknowledging that much of the easy rerating in megacap tech and classic defensives may already be priced in. Our underweights in Financials, Industrials, Health Care, and Real Estate indicate a more cautious stance toward rate-sensitive balance sheets, late-cycle credit and loan growth, and sectors where policy, regulation, or commercial property headwinds could cap upside. Overall, the allocation reflects a barbell approach: we lean into secular and cyclical growth tied to the real economy and innovation, but we balance that with targeted defensiveness and a deliberate underexposure to areas we view as more vulnerable in a higher-for-longer, structurally changing macro environment.
Consumer Discretionary: The S&P 500 Consumer Discretionary sector currently shows a predominantly positive outlook across key quantitative metrics. Bullish indicators include short-term and intermediate moving average crosses, relative price momentum, and favorable overbought/oversold positioning. Additionally, the sector is supported by robust 120-day net new highs, positive housing starts data, and 30-year Treasury yield dynamics. Conversely, bearish signals emerge from price deviation from trend, relative forward P/E ratios suggesting valuation concerns, and total consumer credit expansion. Discretionary consumer spending remains neutral, indicating a lack of clear directional momentum in actual consumption data. Overall, while technical price action and macro-housing factors provide a strong tailwind, valuation and credit-related headwinds persist, suggesting the sector's outperformance depends on sustained price momentum over fundamental valuation alignment.
Commentary: During January, the S&P 500 Consumer Discretionary sector faced a complex landscape defined by shifting monetary policy and evolving consumer sentiment. Following a period of interest rate volatility and a recent government shutdown, the sector remains sensitive to the Federal Reserve's trajectory. Positive trends include a resilient middle-income consumer base and potential tailwinds for homebuilders like Lennar as mortgage rates stabilize. Additionally, a "broadening out" of the market is providing opportunities for discount retailers and agile firms like TJX Companies that cater to value-seeking shoppers. However, negative pressures persist, particularly for lower-income households squeezed by sticky inflation and high borrowing costs. Future expectations are bullish, with double-digit earnings growth forecasted for the remainder of 2026 as the "AI supercycle" influences retail logistics and household spending recouples with a stabilizing labor market. Key players like Amazon and Tesla continue to dominate index weighting, making the sector’s future performance highly dependent on their specific growth narratives.
Figure 1: Housing starts showing slight signs of improvement. Continued positive economic activity and a balanced labor market would support more housing activity.
Consumer Staples: The S&P 500 Consumer Staples sector currently exhibits bullish indicators, including moving average crosses, relative price momentum, and favorable overbought/oversold levels. Supporting technical strength is evidenced by relative net new highs, 45-day relative breadth, and a supportive relative short interest ratio. Macroeconomic and fundamental tailwinds include favorable readings from the Chicago Fed National Financial Conditions Index and sector sales yield. Conversely, bearish signals originate from fundamental and macro data, specifically year-over-year food sales growth, food CPI inflation, and the Citi G10 Economic Surprise Index. Relative price deviation from trend remains neutral. In summary, while technical momentum and financial conditions support sector outperformance, inflationary pressures and slowing sales growth provide measurable fundamental resistance.
Commentary: The sector entered January under the weight of persistent "sticky" inflation and heightened trade policy uncertainty. A significant influence this month was the introduction of new tariffs, which pressured input costs for major manufacturers. Despite these headwinds, the sector remains a primary defensive haven for investors wary of broader market volatility. Positive trends include a "flight to value," benefiting retailers like Costco and Walmart as households prioritize essential spending. Furthermore, tax relief from the "One Big Beautiful Bill Act" is expected to provide a mid-year liquidity boost to middle-income consumers. Conversely, negative pressures include a slowdown in volume growth for certain food and beverage segments, partially attributed to the sustained impact of GLP-1 medications on calorie consumption. Earnings growth for the sector is projected to be modest but stable. While high-growth sectors command higher premiums, staples companies like Procter & Gamble and PepsiCo are valued for their reliable dividends. Future expectations remain cautiously optimistic, with analysts forecasting mid-single-digit earnings expansion as supply chains localize and pricing power offsets tariff-induced margin compression.
Figure 2: Consumer Staples sector showing signs of a potential oversold reversal.
Communication Services: The S&P 500 Communication Services sector currently maintains a universally positive quantitative profile across all monitored metrics. Bullish signals are driven by technical price action, including relative price moving average crosses, two distinct overbought/oversold relative price measures, and positive relative price deviation from trend. These technical strengths are reinforced by favorable macroeconomic and fundamental data, specifically the 10-year minus 2-year Treasury yield spread and robust relative earnings yields. Currently, there are no bearish or neutral indicators identified in the indicator dataset. The alignment of momentum-based technicals with supportive yield curves and valuation metrics suggests a high-conviction period of relative strength for the sector, with no immediate quantitative headwinds observed in the current readings.
Commentary: In January, the sector was primarily influenced by the accelerating monetization of generative AI and a strategic pivot toward service "convergence." Large-cap leaders like Alphabet and Meta Platforms continued to drive the sector by integrating AI-driven "agents" into digital advertising and customer service, significantly boosting operational efficiency. Meanwhile, traditional telecommunications firms, including AT&T and Verizon, focused on bundling mobile and fiber broadband services to reduce customer churn in a mature market. Positive trends include broadening earnings revisions and strong demand for high-bandwidth infrastructure to support AI workloads. However, negative pressures persist from high capital expenditure requirements for 5G and fiber expansion, as well as rising regulatory scrutiny of data privacy and AI-generated content. Earnings growth for the sector has remained resilient, with major players reporting double-digit year-over-year increases in late 2025 and early 2026. Future expectations are optimistic, as analysts project continued double-digit growth throughout 2026, driven by an "advertising revolution" and the expanding role of AI in gaming and enterprise communications.
Figure 3: The trend remains a friend.
Energy: The S&P 500 Energy sector demonstrates a mixed quantitative profile leaning toward recent technical strength. Bullish indicators are driven by positive price action, including the primary relative strength indicator, moving average crossovers, and favorable rolling 5-month volatility. Supporting this momentum are constructive readings from the 150-day sector breadth, crude prices relative to the 5-month SMA, the total world rig count, and the USD trade-weighted index. Conversely, bearish signals emerge from fundamental and supply-side constraints, specifically declining free cash flow yield momentum, crude oil spot price action, and crude oil days of supply. The sector’s relative price overbought/oversold status remains neutral. While technical momentum and global activity levels remain supportive, softening cash flow trends and specific commodity price pressures are currently the primary fundamental headwinds.
Commentary: In January, the S&P 500 Energy sector emerged as a top-performing sector, driven by a convergence of extreme weather events and structural shifts in power demand. The month was heavily influenced by "Winter Storm Fern," which caused significant disruptions to natural gas supply and price spikes across the Permian Basin and Gulf Coast. This immediate supply-side shock coincided with a deepening long-term trend: the "AI-driven power surge." Data centers supporting the AI supercycle have created a massive requirement for 24/7 baseline electricity, revitalizing interest in traditional natural gas and nuclear providers. Positive tailwinds include the sector's evolution into a defensive, high-free-cash-flow alternative to volatile tech stocks. Companies like Bloom Energy have seen significant interest in their fuel cell technology for powering data centers. However, downward pressure persists from range-bound crude oil prices and declining spare capacity in OPEC+ nations. Earnings growth for the sector is undergoing a transition. While analysts anticipate a year-over-year decline in revenue due to lower crude prices, cash flow remains robust. Future expectations center on "energy security" and grid modernization, with firms like Valero and Cenovus positioned to benefit from improved refining efficiency and the burgeoning demand for sustainable aviation fuels.
Figure 4: A weaker U.S. dollar is constructive for the Energy sector.
Financials: The S&P 500 Financials sector currently faces structural headwinds, contrasting against supportive fundamental data. Bullish signals are concentrated in macroeconomic and credit metrics, specifically the Citi G10 Economic Surprise Index, bank loan growth, the yield curve, and narrowing US investment-grade option-adjusted spreads (OAS), alongside positive relative strength momentum. Conversely, bearish indicators dominate the technical and risk categories, including relative price and total return trends, overbought/oversold levels, elevated sector volatility, maximum relative drawdown, and pressure from the US dollar trade-weighted index. Business credit conditions and forward earnings yields remain neutral. While fundamental credit health and yield dynamics remain constructive, deteriorating price trends and heightened volatility suggest a challenging technical environment for the sector’s relative performance.
Commentary: The S&P 500 Financials sector was shaped by a stabilizing interest rate environment and a resurgence in capital markets activity. Following the Federal Reserve’s pivot toward a neutral rate, the sector benefited from a steepening yield curve, which improved net interest margins for major lenders. Positive trends included a significant rebound in investment banking, driven by an uptick in IPOs and M&A volume as corporate confidence returned. Additionally, the integration of enterprise-level AI began to drive meaningful back-office efficiency gains for large-scale institutions. Negative pressures persisted with elevated commercial real estate exposure and tightening credit conditions for subprime consumer segments. While individual leaders like JPMorgan Chase expanded their retail footprint—notably taking over the Apple Card portfolio from Goldman Sachs—other firms grappled with rising loan-loss provisions. Earnings growth for the sector has remained resilient, supported by diversified fee-based income from wealth management and payment processing. Future expectations are optimistic, with analysts forecasting double-digit earnings expansion through late 2026 as the credit cycle matures and fintech partnerships, such as Visa’s stablecoin initiatives, scale into global markets.
Figure 5: The Financials sector is approaching initial oversold levels. A buy signal would be generated if the indicator moves below the lower SD bracket and then reverses above it.
Healthcare: The S&P 500 Health Care sector currently has a challenging quantitative profile characterized by persistent technical and fundamental headwinds. Bullish indicators are limited to internal market dynamics: 100-day relative breadth, positive healthcare sector trends, and favorable maximum relative drawdown status. Conversely, bearish signals dominate the technical and macroeconomic outlook, including negative relative price trends, decelerating relative strength momentum, and momentum reversals. Fundamental pressures further weigh on the sector, driven by contraction in health care new construction, rising medical CPI, increased personal expenditures, and a weak sector book yield. While the sector maintains some structural stability, the alignment of deteriorating price momentum with escalating costs and inflationary pressures suggests significant resistance to relative outperformance in the current environment.
Commentary: The Health Care sector was primarily influenced by a strategic pivot toward AI-driven operational efficiency and a surge in biotechnology M&A activity. Market sentiment improved as investors sought defensive positioning amid broader economic uncertainty, while sector valuations remained attractive relative to the S&P 500. A defining trend is the "AI transition," where companies like UnitedHealth Group and Cleveland Clinic are moving from pilot projects to standardizing AI for clinical documentation and diagnostic triage to combat persistent labor shortages. Positive trends include the expansion of "GLP-1" obesity treatments into oral formulations and a more predictable regulatory environment regarding drug pricing. Conversely, negative pressures remain, including "sticky" medical inflation, rising care utilization, and the approaching "patent cliff" for several blockbuster drugs. Earnings growth in the sector is stabilizing, with large-cap insurers like Cencora benefiting from upward revisions. Future expectations are optimistic, as analysts project mid- to high-single-digit earnings growth through late 2026, driven by aging population demand and the integration of cost-saving hybrid care models.
Figure 6: Health Care technicals, including momentum, are relatively weak.
Industrials: The S&P 500 Industrials sector presents a predominantly defensive quantitative profile with significant technical and fundamental headwinds. Bullish signals are limited to short-term relative price momentum, the CRB Index, and current U.S. Industrial Production levels. Conversely, bearish indicators dominate the outlook, driven by negative relative price trends, unfavorable relative price RSI levels, and elevated sector volatility. Fundamental pressures are underscored by weak sector cash flow and sales yields, rising 210-day new lows, and unfavorable trends in oil perpetual futures and the USD trade-weighted index. Consumer confidence remains neutral. Overall, while production and momentum offer isolated support, the confluence of deteriorating technicals, valuation yields, and currency pressures suggests a high probability of relative underperformance for the industrials sector in the current environment.
Commentary: In January, the S&P 500 Industrials sector was heavily influenced by a "hardware-heavy" phase of the artificial intelligence supercycle. While software previously dominated the narrative, the bottleneck has shifted to physical infrastructure—specifically the "power wall." This has catalyzed massive demand for electrical equipment, grid modernization, and advanced cooling systems, benefiting companies such as Eaton and Vertiv, which provide critical data center components. Additionally, the "One Big Beautiful Bill Act" began funneling fresh fiscal stimulus into domestic manufacturing and reshoring initiatives, further buoying the sector. Positive trends include high backlogs for aerospace giants like Boeing as global travel remains resilient, and a surge in automation adoption to combat labor shortages. Conversely, negative pressures arise from "sticky" inflation, which is impacting raw material costs, and high interest rates, which are curbing some long-cycle capital projects. Earnings growth for the sector is projected to hit high single digits in 2026. Future expectations are robust, as analysts anticipate sustained capital expenditure on energy-dense infrastructure and logistics throughout the second half of the year.
Figure 7: Rising commodity prices often imply increasing economic activity.
Information Technology: The S&P 500 Information Technology sector currently exhibits a mixed, but positive, quantitative profile. Bullish indicators are driven by robust relative price momentum, favorable readings from the first overbought/oversold relative strength measure, and positive earnings revision breadth. Additionally, the sector benefits from supportive market-based inflation expectations. Conversely, bearish signals emerge from a second overbought/oversold relative-strength metric, suggesting potential exhaustion, alongside an unfavorable relative short-interest ratio. The sector sales yield remains neutral, indicating a lack of clear valuation-driven conviction. Overall, while momentum and earnings quality provide a solid foundation for relative outperformance, conflicting technical overbought signals and short-selling activity introduce measurable tactical risks. This suggests that while the prevailing trend remains positive, internal volatility may persist as technical and sentiment factors recalibrate.
Commentary: The S&P 500 Information Technology sector remains the primary engine of market growth, heavily influenced by the transition from AI experimentation to large-scale monetization. The month was defined by the "picks and shovels" phase of the AI supercycle, with unprecedented capital expenditure from hyperscalers driving massive demand for advanced semiconductors and data center infrastructure. NVIDIA and Broadcom continue to benefit from this hardware-centric buildout, while Apple saw a resurgence in January following record-breaking iPhone revenue and strong demand for AI-integrated services. Positive trends include accelerating corporate productivity and a "hardware-first" rally that has shielded chipmakers from broader software jitters. Conversely, negative pressures include extreme market concentration and "sticky" inflation that keeps long-term interest rates high, challenging rich valuations. Earnings growth for the sector is a major standout, with analysts projecting above-trend expansion of 13–15% through 2026. Future expectations hinge on whether high capital spending translates into software revenue, but for now, the sector’s fundamental strength and lower P/E ratios compared to the 2000 tech bubble suggest sustained momentum.
Figure 8: Rising market-based inflation expectations are a headwind for long-duration assets like those often found within the Information Technology sector.
Materials: Bullish indicators include favorable relative price moving average crosses, sustained price trends, and strong relative price momentum. Technical strength is further supported by positive overbought/oversold readings, price deviation from trend, 90-day sector volatility, and emerging/developed equity momentum. Additionally, silver futures momentum, sector earnings and sales yields, and industrial production data for materials provide significant fundamental tailwinds. Conversely, bearish signals are limited to momentum in gold futures and mean reversion in natural gas futures. Copper spot momentum remains neutral. Overall, the alignment of price action with industrial activity and valuation yields suggests a high-conviction outlook for relative outperformance, despite specific commodity-linked headwinds in precious metals and energy.
Commentary: The month was influenced by a "mid-cycle acceleration" in the U.S. economy, where resilient industrial production and stabilizing interest rates provided a supportive backdrop. A key positive trend is the robust demand for industrial metals, particularly copper and lithium, driven by the ongoing AI infrastructure buildout and the continued electrification of the global grid. However, negative pressures remain, primarily from "sticky" global inflation and increasing trade fragmentation. Tariff-related uncertainties and a slowdown in residential construction have created headwinds for chemical and lumber producers. Despite these challenges, individual companies like CF Industries and Albemarle saw renewed interest in January as supply-side constraints in fertilizers and lithium began to tighten. Earnings growth for the sector is a standout theme, with Materials projected to be among the top sectors for year-over-year expansion in 2026. Future expectations are bullish, as analysts anticipate double-digit earnings growth to persist through the second half of the year, supported by a "winner-takes-all" dynamic in specialized process industries and a recovery in global infrastructure spending
Figure 9: Silver’s parabolic rise has tangentially benefited the Materials sector.
Real Estate: The S&P 500 Real Estate sector’s bullish indicators are primarily macro-driven, including favorable 30-year Treasury yields, supportive unemployment data, the Citi Economic Surprise Index, and strength in the S&P 500 homebuilding sub-industry, alongside positive 50-day relative breadth. Conversely, bearish signals are concentrated in technical and supply-side metrics, specifically the relative price trend, percentage of positive days, and price deviation from trend. Further evidence of fundamental pressure is evident in industrial production for construction supplies and in NFIB small-business credit conditions. While broader economic surprises and interest rate dynamics offer tailwinds, the sector’s internal price momentum and credit availability remain key quantitative obstacles to sustained relative outperformance.
Commentary: During January, the S&P 500 Real Estate sector operated in a climate of "unrecognized stagflation," characterized by potentially slowing economic growth and stubborn inflation. The primary influence was the Federal Reserve’s decision to keep interest rates steady in the 3.5% to 3.75% range, which provided much-needed clarity for property valuations and financing. While the high-interest-rate environment of previous years has cooled, current rates remain a headwind for aggressive capital recycling. Positive trends include a "flight to quality" in the office and industrial segments, where prime, sustainable assets command record rents. Data centers remain a high-conviction sub-sector due to the AI infrastructure boom, while multifamily residential benefits from a persistent national housing shortage of approximately 1.2 million units. Conversely, negative pressures stem from a regional glut of new construction in the Sun Belt and rising insurance costs due to climate-related risks. Individual stocks like Prologis benefit from reshoring logistics demand, while American Tower leverages the ongoing 5G and AI data surge. Earnings expectations for 2026 are generally constructive, though below index expectations, with analysts forecasting a rebound in funds from operations (FFO) as transaction volumes increase and the "mortgage lock-in effect" continues to fade.
Figure 10: The Homebuilding sub-industry appears to be making a higher low. Stabilization above the long-term MACD would be positive.
Utilities: The S&P 500 Utilities sector’s bullish indicators are driven by robust price action, including relative price reversals, momentum, two overbought/oversold metrics, and deviation from trend. Internal market strength is supported by 50-day relative breadth, while external factors like crude oil perpetual futures, capacity utilization, and dividend yields provide additional tailwinds. Conversely, bearish signals emerge from the relative price moving average cross, the spread between earnings yield and the 10-year Treasury yield, and PMI Manufacturing data. The copper/gold ratio remains neutral. While the sector maintains significant technical momentum and yield-based appeal, valuation spreads relative to benchmark rates and softening manufacturing activity represent the primary quantitative risks to sustained relative outperformance.
Commentary: The S&P 500 Utilities sector underwent a tactical re-evaluation as the "AI power narrative" transitioned from speculative hype to infrastructure execution. The primary influence was the massive capital requirement for data center hubs, which is projected to drive a significant increase in electricity demand through 2032. While the sector faced valuation compression early in the month following a strong 2025 rally, it remains supported by the "One Big Beautiful Bill Act," which incentivizes grid modernization and nuclear energy expansion. Positive trends include historically high capital expenditure forecasts and a strategic shift in which utilities prioritize large AI loads that provide grid-supporting flexibility. Conversely, negative pressures stem from "sticky" inflation and high interest rates, which raise financing costs for these capital-intensive firms. Earnings growth expectations remain robust, with analysts forecasting annual growth of roughly 6.5% to 15% for the index. Key players such as NextEra Energy and Southern Company are projecting mid- to high-single-digit earnings growth, supported by record investment in clean energy and baseload capacity. Future expectations hinge on the sector's ability to deliver this "firm" capacity to the grid without significantly increasing residential retail rates.
Figure 11: A reversal back above the lower SD bracket would generate an additional buy signal.
Catastrophic Stop Update
The Catastrophic Stop model combines time-tested, objective indicators designed to identify high-risk periods for the equity market. The model entered February, recommending a fully invested equity allocation relative to the benchmark.
The weight of the evidence suggests that any weakness is unlikely to extend into a significant downtrend at this time. Of course, if our model triggers a sell signal (below 40% for two consecutive days), indicating more substantial problems, we will raise cash immediately.
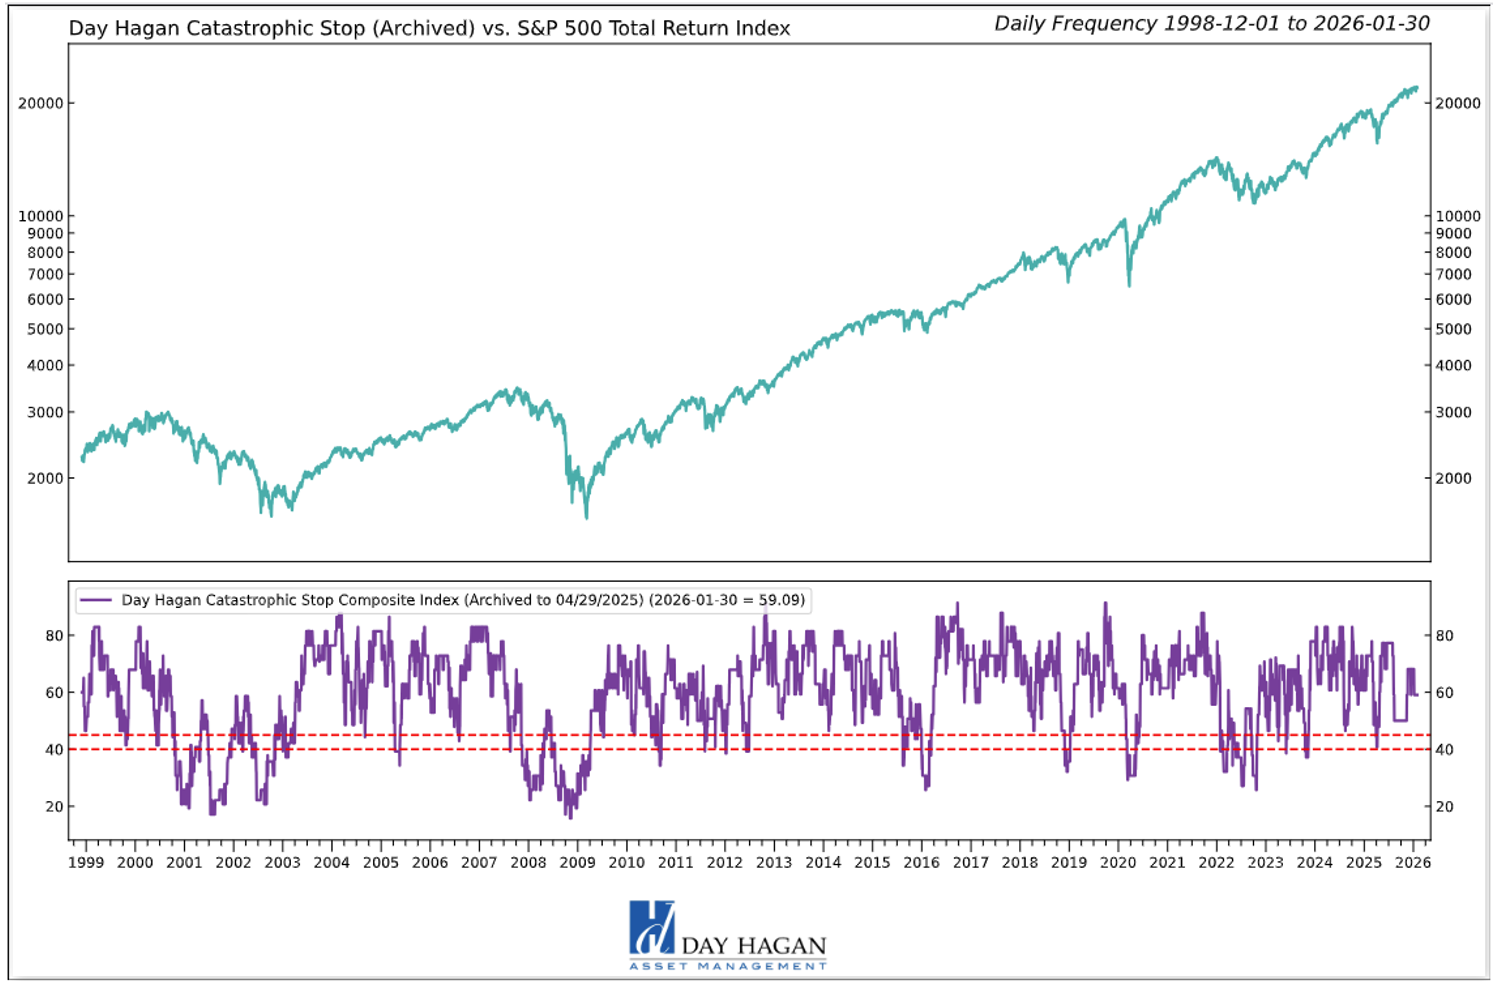
Figure 12: The Catastrophic Stop model recommends a fully invested equity position (relative to the benchmark). Because the model uses indices to extend its history, it is considered hypothetical.
Hypothetical and historical past performance is not indicative of future results. There can be no assurance that any investment or strategy will achieve its objectives or avoid substantial losses or have comparable results. This information is provided for illustrative purposes only and is not a prediction, projection or guarantee of future performance. Hypothetical results do not reflect actual trading, were derived using the benefit of hindsight, and may not reflect material economic and market events. Actual results vary and depend on many factors and subject to risk and uncertainties.
The Day Hagan Daily Market Sentiment Composite (part of the Catastrophic Stop Model) is neutral, indicating investors are neither overly bullish nor overly bearish. This is viewed as a net positive from a contrary opinion perspective.
Figure 13: Should the Sentiment Composite move back above the 70 level, we would view it as a negative development and a potential short-term headwind.
Our goal is to stay on the right side of the prevailing trend and introduce risk management when conditions deteriorate. Currently, the uptrend remains intact. The broader-based composite models, which call for U.S. and international economic growth, inflation trends, liquidity, and equity demand, remain constructive. The Catastrophic Stop model is positive, and we align with its message. If our models shift to bearish levels, we will raise cash.
This strategy uses measures of price, valuation, economic trends, liquidity, and market sentiment to make objective, rational, and unemotional decisions about how much capital to allocate and where to invest it.
Day Hagan Asset Management
1000 S. Tamiami Trl
Sarasota, FL 34236
Toll Free: (800) 594-7930
Office Phone: (941) 330-1702
Website: https://dayhagan.com or https://dhfunds.com
This material is for educational purposes only. Further distribution is prohibited without prior permission. Please see the information on Disclosures and Fact Sheets here: https://dhfunds.com/literature. Charts with models and return information use indices for performance testing to extend the model histories, and they should be considered hypothetical. All Rights Reserved. (© Copyright 2026 Day Hagan Asset Management.)
Day HaganSmart Sector®
With Catastrophic Stop ETF
Symbol: SSUS
Disclosures
The data and analysis contained within are provided “as is” and without warranty of any kind, either express or implied. The information is based on data believed to be reliable, but it is not guaranteed. Day Hagan DISCLAIMS ANY AND ALL EXPRESS OR IMPLIED WARRANTIES, INCLUDING, BUT NOT LIMITED TO, ANY WARRANTIES OF MERCHANTABILITY, SUITABILITY, OR FITNESS FOR A PARTICULAR PURPOSE OR USE. All performance measures do not reflect tax consequences, execution, commissions, and other trading costs, and as such, investors should consult their tax advisors before making investment decisions, as well as realize that the past performance and results of the model are not a guarantee of future results. The Smart Sector® Strategy is not intended to be the primary basis for investment decisions, and the usage of the model does not address the suitability of any particular investment for any particular investor.
Using any graph, chart, formula, model, or other device to assist in deciding which securities to trade or when to trade them presents many difficulties, and their effectiveness has significant limitations, including that prior patterns may not repeat themselves continuously or on any particular occasion. In addition, market participants using such devices can impact the market in a way that changes the effectiveness of such devices. Day Hagan believes no individual graph, chart, formula, model, or other device should be used as the sole basis for any investment decision and suggests that all market participants consider differing viewpoints and use a weight-of-the-evidence approach that fits their investment needs.
Past performance does not guarantee future results. No current or prospective client should assume future performance of any specific investment or strategy will be profitable or equal to past performance levels. All investment strategies have the potential for profit or loss. Changes in investment strategies, contributions or withdrawals, and economic conditions may materially alter the performance of your portfolio. Different types of investments involve varying degrees of risk, and there can be no assurance that any specific investment or strategy will be suitable or profitable for a client’s portfolio. Historical performance results for investment indexes and/or categories generally do not reflect the deduction of transaction and/or custodial charges or the deduction of an investment management fee, the incurrence of which would have the effect of decreasing historical performance results. There can be no assurances that a portfolio will match or outperform any particular benchmark. Comparisons to indices are inherently unreliable indicators of future performance. The strategies used to generate the performance vary from those used to generate the returns depicted in the benchmarks. Investors cannot directly invest in an index.
The information contained herein is provided for informational purposes only and should not be construed as investment advice or a recommendation to buy or sell any security. The securities, instruments, or strategies described may not be suitable for all investors, and their value and income may fluctuate. Past performance is not indicative of future results, and there is no guarantee that any investment strategy will achieve its objectives, generate profits, or avoid losses.
This material is intended to provide general market commentary and should not be relied upon as individualized investment advice. Investors should consult with their financial professional before making any investment decisions based on this information.
The material may contain “forward-looking” information that is not purely historical in nature. Such information may include, among other things, projections, forecasts, estimates of market returns, and proposed or expected portfolio composition. Day Hagan Asset Management, its affiliates, employees, or third-party data providers shall not be liable for any loss sustained by any person relying on this information. All opinions and views expressed are subject to change without notice and may differ from those of other investment professionals within Day Hagan Asset Management or Ashton Thomas Private Wealth, LLC.
Accounts managed by Day Hagan Asset Management or its affiliates may hold positions in the securities discussed and may trade such securities without notice.
Day Hagan Asset Management is a division of and doing business as (DBA) Ashton Thomas Private Wealth, LLC, an SEC-registered investment adviser. Registration with the SEC does not imply a certain level of skill or training.
There is no guarantee that any investment strategy will achieve its objectives, generate dividends, or avoid losses.
This material is for educational purposes only. Further distribution is prohibited without prior permission. Please see the information on Disclosures and Fact Sheets here: https://dhfunds.com/literature. Charts with models and return information use indices for performance testing to extend the model histories, and they should be considered hypothetical. All hypothetical results are presented for illustrative purposes only. Back-testing and other statistical analysis is provided in use simulated analysis and hypothetical circumstances to estimate how it may have performed prior to its actual existence. The results obtained from "back-testing" information should not be considered indicative of the actual results that might be obtained from an investment or participation in a financial instrument or transaction referencing the Index. The Firm provides no assurance or guarantee that the products/securities linked to the strategy will operate or would have operated in the past in a manner consistent with these materials. The hypothetical historical levels have inherent limitations. Alternative simulations, techniques, modeling or assumptions might produce significantly different results and prove to be more appropriate. Actual results will vary, perhaps materially, from the simulated returns presented.
Sector Definitions:
Communication Services sector: The Communication Services Sector includes telecom and media & entertainment companies including producers of interactive gaming products and companies engaged in content and information creation or distribution through proprietary platforms.
Consumer Discretionary sector: The Consumer Discretionary sector's manufacturing segment includes automobiles & components, household durable goods, leisure products and textiles & apparel. The services segment includes hotels, restaurants, and other leisure facilities. It also includes distributors and retailers of consumer discretionary products.
Consumer Staples sector: The Consumer Staples sector includes manufacturers and distributors of food, beverages and tobacco and producers of non-durable household goods and personal products. It also includes distributors and retailers of consumer staples products including food & drug retailing companies.
Energy sector: The Energy sector includes companies that operate in the areas of exploration & production, refining & marketing, and storage & transportation of oil & gas and coal & consumable fuels. It also includes companies that offer oil & gas equipment and services.
Financials sector: The Financials sector includes banking, financial services, consumer finance, capital markets and insurance activities. It also includes Financial Exchanges & Data and Mortgage REITs.
Health Care sector: The Health Care sector includes health care providers & services, health care equipment & supplies, and health care technology companies. It also includes companies involved in the research, development, production and marketing of pharmaceuticals and biotechnology products.
Industrials sector: The Industrials sector includes aerospace & defense, building products, electrical equipment and machinery and companies that offer construction & engineering services. It also includes providers of commercial & professional services including printing, environmental and facilities services, office services & supplies, security & alarm services, human resource & employment services, research & consulting services. It also includes companies that provide transportation services.
Information Technology sector: The Information Technology sector includes software and information technology services, manufacturers and distributors of technology hardware & equipment such as communications equipment, cellular phones, computers & peripherals, electronic equipment and related instruments, and semiconductors and related equipment & materials.
Materials sector: The Materials sector includes chemicals, construction materials, forest products, glass, paper and related packaging products, and metals, minerals and mining companies, including producers of steel.
Real Estate sector: The Real Estate sector includes companies engaged in real estate development and operation. It also includes companies offering real estate related services and Equity Real Estate Investment Trusts (REITs).
Utilities sector: The Utilities sector covers utility companies such as electric, gas and water utilities. It also includes independent power producers, energy traders and renewable sources.
All Rights Reserved. (© Copyright 2026 Day Hagan Asset Management.)
© 2026 Day Hagan Asset Management
