
Day Hagan Smart Sector® Fixed Income Strategy Update February 2026
A downloadable PDF copy of the Article:
Day Hagan Smart Sector® Fixed Income Strategy Update February 2026 (pdf)
Executive Summary
Entering February, global fixed-income markets are navigating a "mid-to-late-cycle" environment characterized by a transition from aggressive policy easing to a more measured, data-dependent approach. For U.S. investors, the primary narrative is the bear steepening of the yield curve. While the Federal Reserve held the federal funds rate steady at 3.50%–3.75% at its January meeting, the 10-year Treasury yield has risen toward 4.25%. This shift is driven by a better-than-expected economic activity, bolstered by fiscal stimulus from the "One Big Beautiful Bill Act," and "sticky" inflation that remains stubbornly above the 2% target, currently hovering near 3%.
The manufacturing sector is showing signs of a long-awaited revival, with Chicago PMI recently surging into expansion territory at 54, the first such reading in two years. Mortgage-Backed Securities (MBS) are seeing renewed interest as government initiatives signal a desire to stabilize mortgage rates, even as 10-year yields fluctuate. For those seeking a potential protection strategy against rising long-end rates, Floating Rate securities remain a tactical opportunity, offering yields that adjust with the prevailing interest rate environment.
In the credit markets, U.S. Investment Grade (IG) Corporates are trading at historically tight spreads, leading many analysts to suggest an "up-in-quality" bias. While fundamentals remain healthy, the risk of spread widening looms if heavy debt issuance to fund AI-related capital expenditures overwhelms demand. High-yield bonds have outperformed relative to other bonds due to low default rates, but some view their valuations as "priced to perfection." We’re monitoring our model closely for signs of deterioration.
Globally, the landscape is bifurcated. International IG Corporates, particularly in Europe, face headwinds from a softening Euro, while Emerging Market (EM) bonds have become a bright spot. Disinflation in regions like Latin America and stable reforms in South Africa have allowed EM debt to provide attractive carry, outperforming many developed sovereign peers. However, the U.S. dollar's recent volatility—depreciating in January before rebounding—remains the "linchpin" of total returns in unhedged international portfolios.
In summary, the 2026 global landscape presents a complex interplay of resilient growth and selective central bank tightening. While U.S. investors face domestic inflationary pressures, opportunities persist in recovering international manufacturing sectors and in high-quality credit. Navigating this year requires a disciplined, data-driven approach to balance geopolitical risks against structural economic tailwinds.
Holdings
Fixed Income Sector
US 1-3 Month T-bill
US 3-7 Year Treasury
US 10-20 Year Treasury
TIPS (short-term)
US Mortgage-Backed
US Floating Rate
US Corporate
US High Yield
International Corporate Bond
Emerging Market Bond
Outlook (relative to benchmark)
Overweight
Neutral
Underweight
Underweight
Underweight
Overweight
Underweight
Overweight
Overweight
Overweight
Position Details
.S. Treasuries: U.S. Treasuries present a mixed profile with a relatively neutral overall outlook. Positive signals include relative strength versus the equity market trend, indicating some support from risk-off positioning and demand during equity volatility. Negative signals include relative-strength technical crosses, technical momentum, inflation expectations, and credit default swaps, all of which are bearish. These readings suggest weakening trend momentum, sensitivity to rising yields, and vulnerability to credit market developments. Overall, while long Treasuries benefit from flight-to-quality flows linked to equity weakness, broader technical and inflation-related pressures limit upside potential. The asset class appears moderately balanced, with selective support offset by structural headwinds, leaving long Treasuries in a neutral position until clearer macroeconomic or technical signals emerge.
Commentary: Treasury auctions are being conducted at steady sizes, with the Treasury planning to maintain short-term bill supply into mid-March before modest reductions, even as future fiscal financing needs are expected to rise, which could put upward pressure on yields in the longer term. Inflation data continue to show mixed signals: producer prices posted recent gains as service costs climbed, reflecting cost pass-through from tariffs, while core inflation has moderated, leaving the Fed balancing price pressures against a still‑resilient economy. PMIs and other activity data suggest moderate growth, and GDP indicators point to a solid economic footing, supporting demand for safe assets. Currency and equity conditions also influence Treasury flows, with a firm dollar and equity volatility at times boosting demand for longer-duration bonds. Geopolitical and tariff developments continue to add uncertainty, occasionally weighing on sentiment and pushing investors toward safe-haven Treasuries. Federal Reserve leadership shifts and expectations of future policy moves are contributing to the steepening of the Treasury curve and greater interest rate volatility.
Figure 1: Inflation expectations starting to creep higher. A potential headwind.
U.S. TIPS: U.S. TIPS exhibit a mixed but overall, relatively unattractive profile. Positive signals include relative strength versus technical RSI, commodity price trends, and inflation expectations, indicating some support from rising real yields and inflation-linked demand. Negative signals include relative strength, momentum, mean reversion, moving average cross levels, and high-yield option-adjusted spreads. These suggest weakening trend momentum, technical underperformance, and vulnerability to credit market shifts. Taken together, while inflation-linked factors provide selective support, broader technical and relative spread pressures outweigh these positives, leaving TIPS positioned with constrained upside. Investors should remain cautious, as the asset class remains unattractive until trend momentum improves or inflation expectations shift meaningfully.
Commentary: Recent auction results for 10‑year TIPS show real yields trending above recent levels, indicating investor interest in inflation protection relative to nominal yields. Inflation expectations remain central to TIPS demand: the securities adjust their principal to the CPI, and markets use them as hedges when inflation expectations diverge from Federal Reserve targets. Recent macroeconomic data, including moderate GDP growth and mixed PMI readings, support a backdrop in which inflation compensation remains relevant even as price pressures ease toward the Fed’s target. Federal policy discussions about rate cuts and balance sheet changes are influencing TIPS yields and curve dynamics, as investors weigh potential shifts in real rates. Fund flows into inflation-linked securities that respond to both inflation signals and equity volatility, with safe-haven positioning rising when equities weaken or geopolitical risks surface.
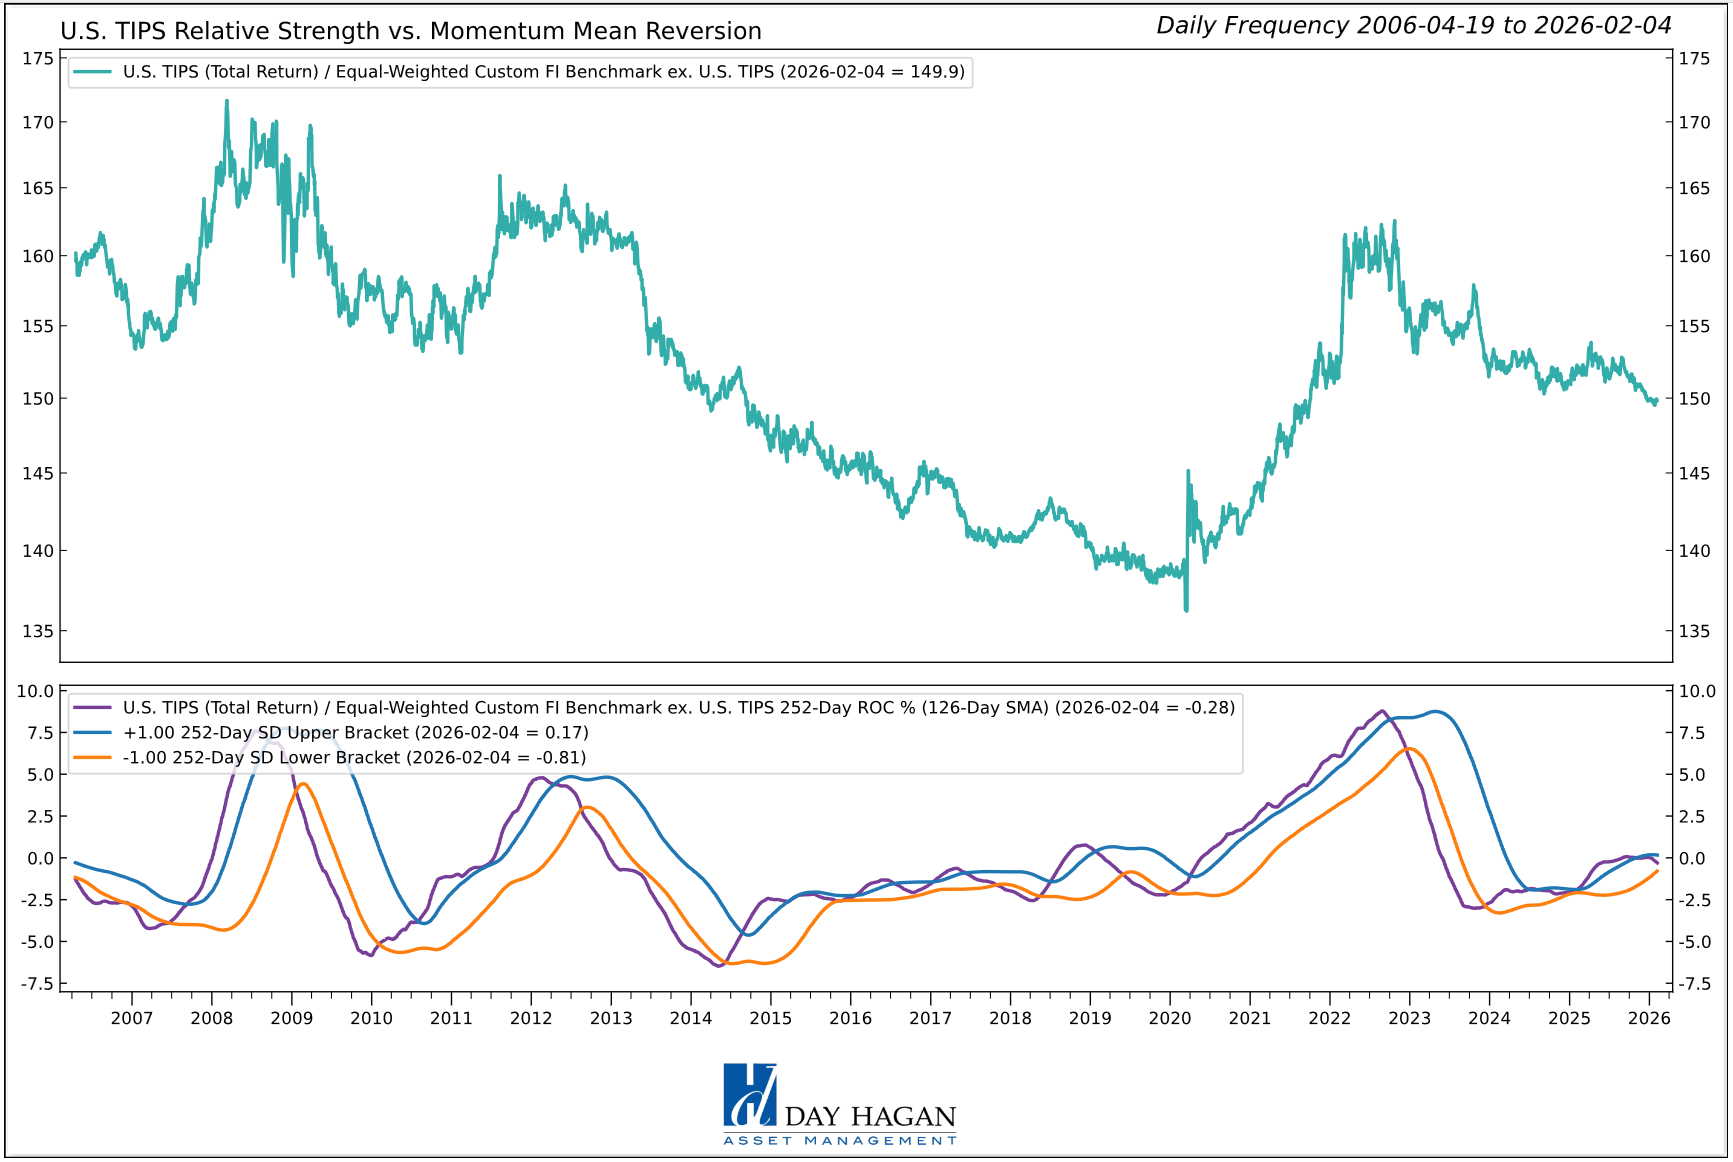
Figure 2: TIPS momentum continues to wane.
U.S. Mortgage-Backed Securities: Positive indicators include relative strength versus moving average crosses, RSI, 10-year yields, and relative slope, signaling some technical support and alignment with interest rate trends. Negative indicators, however, include relative strength versus high-yield option-adjusted spreads and inflation expectations, suggesting vulnerability to broader credit pressures and limited protection against rising inflation. Overall, while technical measures provide short-term support, the combination of credit sensitivity and muted inflation-linked performance may constrain upside. Investors should remain cautious, as MBS exhibit selective strength but are broadly positioned in a relatively unattractive risk-reward environment until either credit spreads stabilize or inflation signals shift meaningfully.
Commentary: Mortgage rates have remained elevated near levels seen over the past year, with slight fluctuations in response to Treasury yield movements and expectations of Federal Reserve policy. Persistently high long-term rates have kept affordability strained and limited refinancing demand, though occasional rate dips have provided modest support to housing activity. Issuance of new MBS, including HMBS, has been modestly higher month to month, reflecting ongoing securitization, but year-over-year comparisons show softer trends. Technical indicators and price action suggest MBS have experienced periods of both sideways trading and volatility, with key coupons oscillating around long‑term averages and responding to weaker labor data and inflation signals. Broader macroeconomic releases, such as the composite PMI and inflation expectations, have influenced yield dynamics, while the Fed’s rate path and Treasury auction demand remain central to spread behavior. Geopolitical and financial stability concerns—such as heightened repo market risk warning also contribute to risk-off flows, intermittently supporting MBS relative to other sectors.
Figure 3: Rising inflation expectations are also negative for MBS and have a potential negative impact on mortgage rates.
U.S. Floating Rate Notes: U.S. floating rate notes show a broadly constructive profile across multiple measures. Positive indicators include relative strength technical crosses, momentum, relative slope, OIS swap rates, and volatility extremes, signaling strong trend alignment, sensitivity to interest rate changes, and resilience in risk-adjusted performance. Despite the generally positive technical picture, the asset class remains exposed to rising short-term rates and broader credit market volatility, which could limit incremental gains. While floating rate structures provide some protection against duration risk and benefit from higher short-term rates, relative valuations and market positioning suggest cautious optimism rather than clear conviction. Overall, floating rate notes exhibit favorable technical and yield characteristics but remain moderately constrained,
Commentary: Floating-rate notes and similar instruments benefit from a landscape in which the Federal Reserve’s policy rate has been steady, and markets are pricing in cautious rate cuts, keeping short-term reference rates relatively elevated. This environment supports floating-rate structures, which reset coupons frequently and reduce duration risk compared with fixed-rate bonds. Technical demand for floating-rate exposure has been supported by broader fixed-income volatility and uncertainty around longer-term yields. Recent PMI and GDP signals point to moderate economic growth, and inflation readings remain a key driver of rate expectations, which feed into floating-rate pricing. Equity market volatility and a strong dollar backdrop sometimes push flows toward defensive fixed-income buckets, including floating-rate allocations. Geopolitical and financial system risk signals, such as warnings about systemic repo market leverage, also contribute to demand for instruments with lower duration risk and greater sensitivity to broader stress. Overall, floating-rate securities are positioned as a relatively attractive segment of the fixed-income universe amid cautious expectations for monetary policy and mixed macroeconomic trends.
Figure 4: Floating Rate Securities tend to do well when volatility expands and then reverses from extremes.
U.S. IG Corporates: U.S. investment-grade fixed income shows a mixed but, overall, relatively unattractive profile. Positive signals are limited, with relative strength versus credit default swaps indicating some resilience in credit quality and underlying market stability. Negative signals include relative strength versus implied bond volatility, option-adjusted spreads, the U.S. dollar, technical cross levels, and price mean reversion reflecting elevated sensitivity to market swings, widening spreads, currency pressure, and weak technical positioning. While credit fundamentals provide some support, dominant technical and volatility pressures may constrain the asset class's upside.
Commentary: Credit spreads remain historically tight compared with longer-term averages, suggesting continued investor confidence in high-quality corporate credit and strong underlying fundamentals. Elevated spreads relative to ultra-low historical norms provide some yield appeal, and demand has been supported by broader fixed income inflows as investors seek carry amid rich equity valuations. However, technical vulnerabilities and macro risks temper the outlook. Increased corporate issuance is siphoning demand away from other sectors, such as Treasuries, potentially pressuring rates and valuations. Recent volatility in tariff policy and broader trade uncertainty have widened spreads and heightened risk premia. Moderate GDP and PMI readings alongside inflation data mean the Federal Reserve’s policy stance remains a key driver of corporate debt pricing, with expectations for eventual rate cuts balanced against persistent inflation concerns. Geopolitical developments and financial system stress indicators also influence risk appetite. Overall, U.S. IG corporates look relatively attractive on spread and income metrics, but caution is warranted given issuance trends and macro uncertainties.
Figure 5: Increasing bond volatility is a headwind across most fixed income sectors.
U.S. High Yield: The U.S. high yield market shows a generally constructive technical profile, supported by several positive indicators. Relative strength is evidenced by broad technical crosses, small-cap equity trends, total return moving averages, VIX trends, and option-adjusted spread reversals, suggesting resilient momentum and favorable market positioning. These factors indicate that credit investors are receiving supportive signals from both equity correlations and volatility dynamics, reinforcing overall demand for high-yield exposure. However, some caution arises from the breadth of high-yield bonds, which reflects more mixed internal market participation and indicates that not all segments are advancing at the same pace. While most indicators support continued strength, the narrower breadth signals potential dispersion and selective risk across the sector. Overall, U.S. high yield remains relatively attractive, underpinned by strong technical alignment and momentum, though investors should monitor breadth and market segmentation to manage potential pockets of vulnerability.
Commentary: The U.S. high-yield market in early 2026 is positioned against a backdrop of mixed macro signals, tight credit conditions, and episodic risk-off episodes. Credit spreads, while moderately wider than earlier extremes, remain relatively tight by long-term standards, reflecting ongoing investor demand and generally solid corporate credit fundamentals. Tight spreads support issuance and technical demand for high-yield paper, even as broader fixed-income fund flows respond to interest rate expectations and equity volatility. Recent PMI data and GDP indicators point to moderate economic growth, which underpins earnings and reduces immediate default risk, while inflation readings have eased enough to keep rate‑cut expectations alive. The Federal Reserve’s evolving stance and potential leadership shifts are influencing yield dynamics and duration positioning. Geopolitical tensions, including tariff uncertainty and global trade frictions, have triggered intermittent spread widening in the past, underscoring spreads' sensitivity to macro risk. Fund flows into high-yield products have been encouraging, but valuation constraints and spread compression may limit incremental upside. Overall, U.S. high-yield looks relatively attractive on fundamentals and carry, though it is tempered by tight spreads and sensitivity to macroeconomic shifts.
Figure 6: Small-cap uptrend continues to support high-yield bonds.
International IG Bonds: Global investment-grade bonds present a mixed but relatively attractive profile. Positive indicators include relative strength versus equity risk/VIX, relative strength slope, and option-adjusted spreads, signaling resilience during periods of market volatility, supportive trend momentum, and favorable credit conditions. Negative indicators include relative strength versus moving average cross and credit default swaps, reflecting some technical weakness and sensitivity to potential credit stress. Overall, while technical measures suggest selective caution, the balance of volatility support, slope momentum, and stable spreads leaves global investment-grade bonds positioned attractively relative to historical norms. Investors may find opportunities in risk-adjusted returns, particularly in environments where equity markets face volatility, though ongoing monitoring of technical and credit signals is warranted to assess the sustainability of the current positive trend.
Commentary: Global issuance of investment-grade credit has risen over recent years as governments and corporations refinance obligations and fund deficits, expanding the universe of available bonds. Moderate GDP growth in many advanced economies and easing inflation have helped central banks in Europe and elsewhere hold or cautiously adjust policy rates, which supports demand for higher-quality bonds amid slowing growth expectations. Emerging-market investment-grade sovereign debt remains attractive because growth prospects outpace those of developed markets and debt-to-GDP ratios are improving, which underpin demand in global portfolios. Fund flows into international IG bonds have been supported by yield differentials, currency diversification benefits, and demand for spread carry relative to government securities. However, geopolitical risks and policy divergence can influence spreads and flows. Trade tensions, fiscal pressures, and uneven global growth inject uncertainty into credit markets, and liquidity risks flagged in repo markets highlight broader system vulnerabilities that can periodically widen spreads and constrain technical support. Overall, international IG bonds are positioned attractively on yield and diversification metrics but remain sensitive to global macro and policy trends.
Figure 7: CDS rates moving modestly higher is a caution flag.
Emerging Market Bonds: Emerging-market U.S. dollar–denominated bonds show a broadly attractive profile, with all indicators pointing to positive trends. Relative strength versus the EM currency index, emerging equity momentum, commodity market strength, absolute moving average cross, and moving average slope all indicate robust technical positioning and alignment with broader market trends. These signals suggest EM USD bonds benefit from supportive currency dynamics, improving equity and commodity conditions, and favorable trend momentum. The combination of technical strength and sensitivity to macroeconomic tailwinds positions the asset class well relative to other fixed-income sectors. Overall, emerging-market USD bonds appear relatively attractive, offering potential upside and diversification benefits. Investors may find opportunities in risk-adjusted returns, supported by macro trends, technical resilience, and constructive market positioning.
Commentary: Many emerging economies are growing faster than their advanced peers, with resilient GDP trends that help underpin sovereign and corporate credit quality. Inflation has moderated in several markets, enabling central banks to reduce policy rates and support local currency debt, which has attracted inflows and strengthened EM currencies against the U.S. dollar. Commodity strength and softer dollar dynamics have also boosted local debt returns and equity momentum, reinforcing investor demand for EM bonds relative to developed market alternatives. Technical conditions remain constructive, with steady issuance and active auctions absorbing supply without disrupting spreads. Fund flows into local currency EM debt have increased, reflecting diversification and yield appeal. On the risk side, geopolitical and trade tensions, including U.S. policy shifts and regional conflicts, introduce uncertainty that can widen spreads and affect capital flows. High fiscal borrowing in some countries could keep yields elevated, requiring central bank interventions to stabilize markets. Overall, emerging market bonds are positioned relatively attractively amid supportive macro trends and technical conditions, though sensitivity to global risk sentiment persists.
Figure 8: Strengthening commodity prices have often supported EM bonds—to a point. A reversal back below the longer-term moving average would generate a sell signal for this indicator.
Catastrophic Stop Model
The Catastrophic Stop model combines time-tested, objective indicators to identify high-risk periods for equities and fixed-income assets that are highly correlated with the equity market. The model entered February recommending a fully invested allocation relative to the benchmark for credit sectors with high correlations to equities.
The weight of the evidence suggests that any equity weakness is unlikely to extend into a significant downtrend at this time. Of course, if our model triggers a sell signal (below 40% for two consecutive days), indicating more substantial problems, we will reduce duration immediately.
Figure 9: The Catastrophic Stop model recommends a fully invested equity position (relative to the benchmark). Because the model uses indices to extend its history, it is considered hypothetical.
Hypothetical and historical past performance is not indicative of future results. There can be no assurance that any investment or strategy will achieve its objectives or avoid substantial losses or have comparable results. This information is provided for illustrative purposes only and is not a prediction, projection or guarantee of future performance. Hypothetical results do not reflect actual trading, were derived using the benefit of hindsight, and may not reflect material economic and market events. Actual results vary and depend on many factors and subject to risk and uncertainties.
The Day Hagan Daily Market Sentiment Composite (part of the Catastrophic Stop Model) is neutral, indicating investors are neither overly bullish nor overly bearish. This is viewed as a net positive from a contrary opinion perspective.
Figure 10: Should the Sentiment Composite move back above the 70 level, we would view it as a negative development and a potential short-term headwind.
Our goal is to stay on the right side of the prevailing trend and introduce risk management when conditions deteriorate. Currently, the uptrend remains intact. The broader-based composite models calling U.S. economic growth, international economic growth, inflation trends, liquidity, and equity demand remain broadly constructive. The Catastrophic Stop model is positive, and we are aligned with the message. If our models shift to bearish levels, we will raise cash.
This strategy uses measures of price, valuation, economic trends, liquidity, and market sentiment to make objective, rational, and unemotional decisions about how much capital to risk and where to allocate it.
For more information, please contact us at:
Day Hagan Asset Management
1000 S. Tamiami Trl
Sarasota, FL 34236
Toll Free: (800) 594-7930
Office Phone: (941) 330-1702
Website: https://dayhagan.com or https://dhfunds.com
© 2026 Day Hagan Asset Management
This material is for educational purposes only. Further distribution is prohibited without prior permission. Please see the information on Disclosures and Fact Sheets here: https://dhfunds.com/literature. Charts with models and return information use indices for performance testing to extend the model histories, and they should be considered hypothetical. All Rights Reserved. (© Copyright 2026 Day Hagan Asset Management.)
Day Hagan Smart Sector® Fixed Income ETF
Symbol: SSFI
Disclosures
The data and analysis contained within are provided “as is” and without warranty of any kind, either express or implied. The information is based on data believed to be reliable, but it is not guaranteed. Day Hagan DISCLAIMS ANY AND ALL EXPRESS OR IMPLIED WARRANTIES, INCLUDING, BUT NOT LIMITED TO, ANY WARRANTIES OF MERCHANTABILITY, SUITABILITY, OR FITNESS FOR A PARTICULAR PURPOSE OR USE. All performance measures do not reflect tax consequences, execution, commissions, and other trading costs, and as such, investors should consult their tax advisors before making investment decisions, as well as realize that the past performance and results of the model are not a guarantee of future results. The Smart Sector® Strategy is not intended to be the primary basis for investment decisions, and the usage of the model does not address the suitability of any particular investment for any particular investor.
Using any graph, chart, formula, model, or other device to assist in deciding which securities to trade or when to trade them presents many difficulties, and their effectiveness has significant limitations, including that prior patterns may not repeat themselves continuously or on any particular occasion. In addition, market participants using such devices can impact the market in a way that changes the effectiveness of such devices. Day Hagan believes no individual graph, chart, formula, model, or other device should be used as the sole basis for any investment decision and suggests that all market participants consider differing viewpoints and use a weight-of-the-evidence approach that fits their investment needs.
Past performance does not guarantee future results. No current or prospective client should assume future performance of any specific investment or strategy will be profitable or equal to past performance levels. All investment strategies have the potential for profit or loss. Changes in investment strategies, contributions or withdrawals, and economic conditions may materially alter the performance of your portfolio. Different types of investments involve varying degrees of risk, and there can be no assurance that any specific investment or strategy will be suitable or profitable for a client’s portfolio. Historical performance results for investment indexes and/or categories generally do not reflect the deduction of transaction and/or custodial charges or the deduction of an investment management fee, the incurrence of which would have the effect of decreasing historical performance results. There can be no assurances that a portfolio will match or outperform any particular benchmark. Comparisons to indices are inherently unreliable indicators of future performance. The strategies used to generate the performance vary from those used to generate the returns depicted in the benchmarks. Investors cannot directly invest in an index.
The information contained herein is provided for informational purposes only and should not be construed as investment advice or a recommendation to buy or sell any security. The securities, instruments, or strategies described may not be suitable for all investors, and their value and income may fluctuate. Past performance is not indicative of future results, and there is no guarantee that any investment strategy will achieve its objectives, generate profits, or avoid losses.
This material is intended to provide general market commentary and should not be relied upon as individualized investment advice. Investors should consult with their financial professional before making any investment decisions based on this information.
The material may contain “forward-looking” information that is not purely historical in nature. Such information may include, among other things, projections, forecasts, estimates of market returns, and proposed or expected portfolio composition. Day Hagan Asset Management, its affiliates, employees, or third-party data providers shall not be liable for any loss sustained by any person relying on this information. All opinions and views expressed are subject to change without notice and may differ from those of other investment professionals within Day Hagan Asset Management or Ashton Thomas Private Wealth, LLC.
Accounts managed by Day Hagan Asset Management or its affiliates may hold positions in the securities discussed and may trade such securities without notice.
Day Hagan Asset Management is a division of and doing business as (DBA) Ashton Thomas Private Wealth, LLC, an SEC-registered investment adviser. Registration with the SEC does not imply a certain level of skill or training.
There is no guarantee that any investment strategy will achieve its objectives, generate dividends, or avoid losses.
This material is for educational purposes only. Further distribution is prohibited without prior permission. Please see the information on Disclosures and Fact Sheets here: https://dhfunds.com/literature. Charts with models and return information use indices for performance testing to extend the model histories, and they should be considered hypothetical. All Rights Reserved.
All hypothetical results are presented for illustrative purposes only. Back testing and other statistical analysis is provided in use simulated analysis and hypothetical circumstances to estimate how it may have performed prior to its actual existence. The results obtained from "back-testing" information should not be considered indicative of the actual results that might be obtained from an investment or participation in a financial instrument or transaction referencing the Index. The Firm provides no assurance or guarantee that the products/securities linked to the strategy will operate or would have operated in the past in a manner consistent with these materials. The hypothetical historical levels have inherent limitations. Alternative simulations, techniques, modeling or assumptions might produce significantly different results and prove to be more appropriate. Actual results will vary, perhaps materially, from the simulated returns presented.
© 2026 Day Hagan Asset ManagementFuture Online Events
