
Day Hagan Catastrophic Stop Update January 21, 2026
A downloadable PDF copy of the Article:
The Day Hagan Catastrophic Stop model held steady at 59.09%. The model continues to indicate that investors should maintain their benchmark equity exposure.
Yesterday’s selloff did not significantly impact the model. Keep in mind, the model is designed to identify potentially large moves, not dips or minor corrections.
Many of our shorter-term measures deteriorated but did not generate additional sell signals. Short-term measures of sentiment, OBOS, breadth, and positioning remain neutral on balance. In fact, OBOS and positioning indicators became modestly more oversold and less exposed, respectively.
Figure 1: The Catastrophic Stop model would generate a sell signal by closing below 40% for two consecutive days. The current message remains constructive, indicating investors should maintain benchmark equity exposure.
The Daily Market Sentiment Composite declined modestly following yesterday’s decline (meaning a small amount of pessimism crept into the composite). The current level supports the continuation of the current uptrend. Overall, sentiment leans positive but is not at extreme exuberance, which historically has been constructive for an ongoing uptrend.
Figure 2: Sentiment is neither overly optimistic nor pessimistic.
A sustained VIX above 20 frequently coincides with SPX pullbacks but often prompts contrarian interest. This appears to be the case today. Yesterday’s move toward 20 underscored this dynamic amid recent tariff and earnings pressures. Over the last 30 days, the correlation between daily SPX returns and VIX changes has hovered around -0.75 to -0.80, near the long-term average of about -0.70 to -0.80. Again, the ~20 level holding argues that yesterday’s move was somewhat “normal.”
Figure 3: VIX below 20 is generally constructive. VIX above 20 is often a “Get Ready to Buy” signal. (Not a trigger, but a condition.)
Positioning indicators suggest that systematic and algorithmic investors have modestly dialed back risk from previously elevated exposure levels. This cohort is now running closer to neutral rather than stretched positioning, implying less forced selling pressure and more dry powder on the sidelines. As a result, current positioning leaves scope for incremental buying should signals turn more constructive, indicating that systematic flows could shift from a modest headwind to a potential source of latent demand in the next leg of the market move.
Figure 4: Positioning is now less elevated, but still high-neutral.
As described last week, DBMF’s negative equity exposure reflected a defensive shift. Our view was that this divergence suggested rising fragility and higher volatility risk, more consistent with potential corrections or choppiness than an outright bear market. This continues to be the case.
Figure 5: DBMF exposure to SPX is relatively low. Two ways to interpret this: 1) Systematic investors are nervous, and/or 2) Systematic investors are underinvested and are a potential source of demand.
From an overbought/oversold perspective, the S&P 500 has swiftly worked off its prior near-term overbought condition, and this indicator now sits in a neutral zone rather than at an extreme. With overextension largely resolved, this particular technical headwind has effectively faded, removing a short-term constraint on further upside and reducing the risk of a momentum-driven shakeout tied solely to stretched conditions.
Figure 6: The S&P 500 RSI is neutral, based on a near-term, 14-day appraisal.
Similar look to the Nasdaq RSI OBOS measure.
Figure 7: Nasdaq modestly oversold.
Given the increase in Treasury yields and equity volatility, credit spreads have been broadly stable to modestly tighter, with investment-grade corporates outperforming duration-matched Treasuries as spread compression offset higher risk-free yields. Investment-grade corporates and high-yield option-adjusted spreads remain near cycle tight, reflecting a risk-on appetite and supportive technicals. Overall, markets are still pricing relatively benign default risk and comfortable liquidity conditions despite heavy primary issuance and lingering macro uncertainty.
Figure 8: Credit spreads holding tight indicate that recent volatility isn’t likely to morph into a big bear market for equities. Note that, historically, when OAS credit spreads are below 1.00, max drawdowns have been muted.
The S&P 500 currently exhibits negative gamma. This environment increases intraday volatility but can shift quickly. Note that volatility works both ways, up and down.
Figure 9: SPX gamma condition is currently negative. Gamma flips to positive above 6,901.
This chart tracks smart‑money commercial hedger positions in S&P 500, Nasdaq 100, and DJIA futures on a one-year stochastic scale. Readings above 80 signal bullish hedger exposure, while readings below 20 indicate hedger pessimism and a generally negative backdrop for equities. Hedging was a little light going into yesterday’s decline.
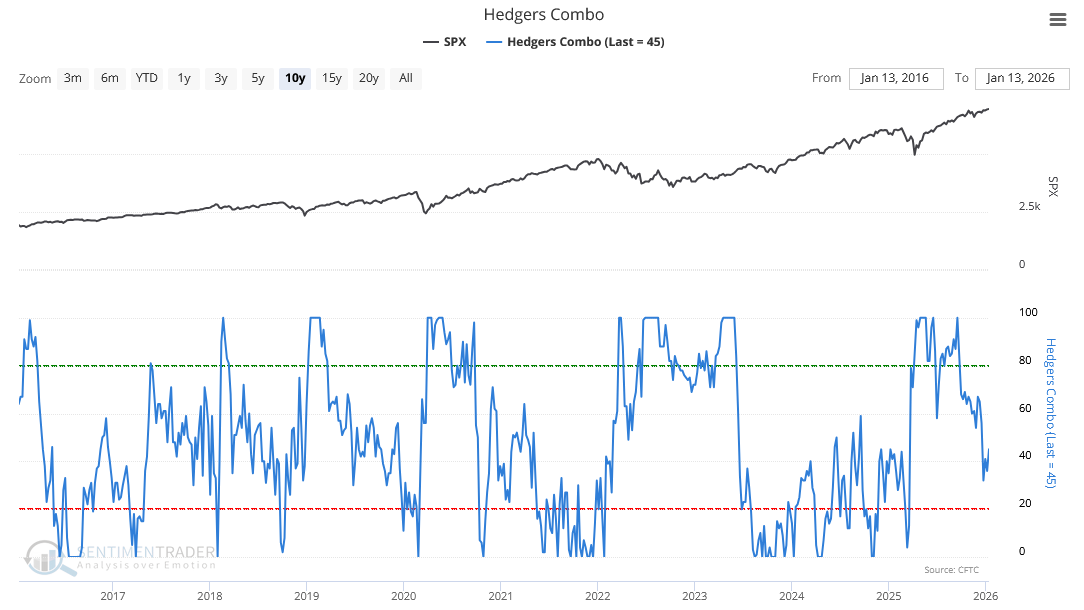
Figure 10: One of the reasons for yesterday’s pullback may have been that investors were under-hedged.
You’ve all seen versions of the chart below. Bottom line: Dips and Corrections happen. It’s up to our indicators whether we view the downturn as something more. Currently, our indicators view the pullback as a normal pullback.
Figure 11: Dips have historically occurred more than 7 times per year, on average.
Turning to the news, tariffs have frequently coincided with weaker growth, but outside the 1930s, there are few clear cases in which they alone triggered a U.S. recession. Pre‑WWII tariff spikes tended to raise unemployment and depress output, usually alongside banking and monetary shocks. Modern cross-country work shows that sizable tariff hikes can slow growth, yet downturns typically reflect a broader mix of policy mistakes, financial stress, and external shocks, with tariffs acting as an additional—but rarely singular—macro drag.
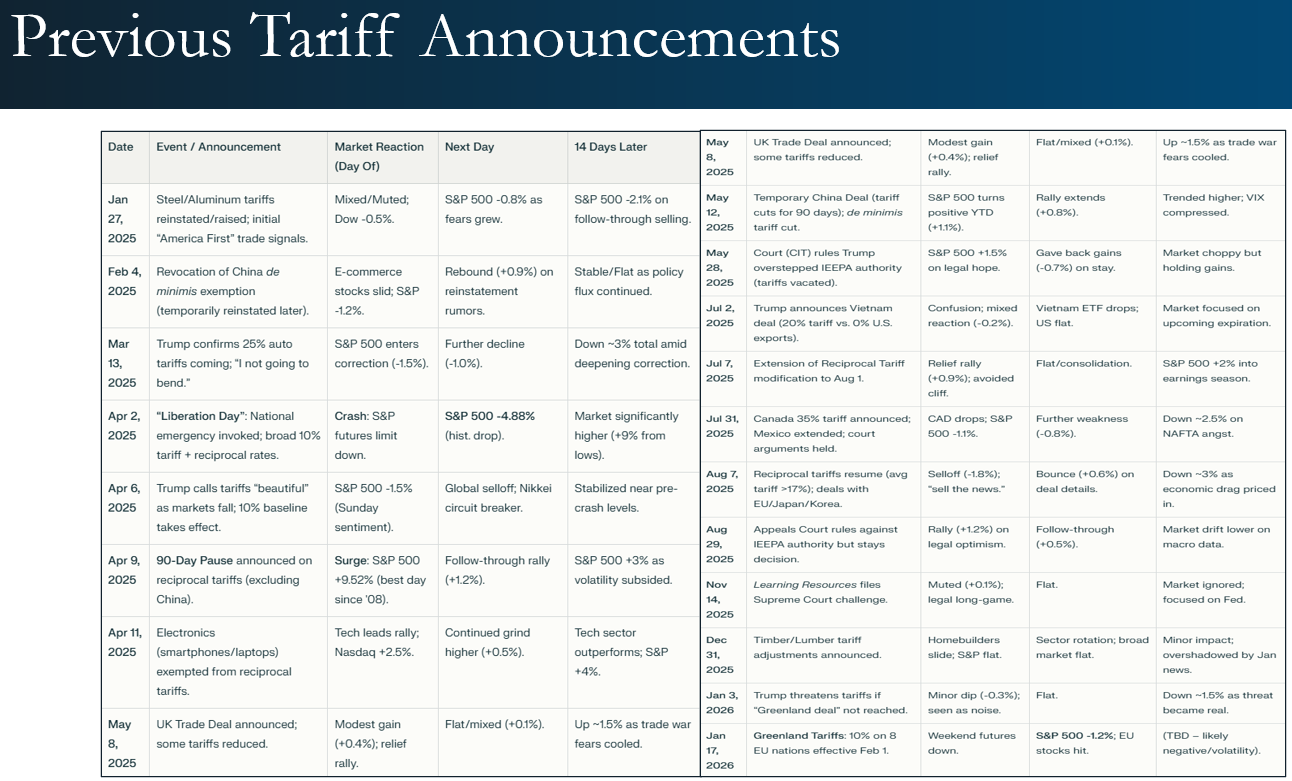
Figure 12: The table shows that tariff announcements can spark knee-jerk market reactions—both selloffs and relief rallies—but the effects tend to fade within days or weeks. Equity moves depend heavily on context, including reciprocal actions, carve-outs, and court decisions, suggesting tariffs are important catalysts yet rarely the sole driver of sustained market trends.
And keep in mind, earnings are the key to 2026. So far, earnings data are supportive.
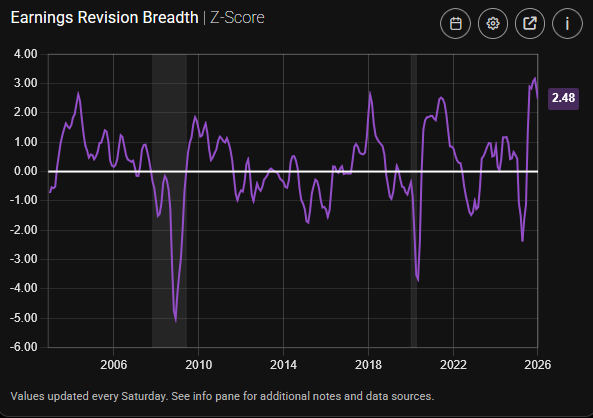
Figure 13: Positive earnings revisions are still in play.
The Global Economic Conditions Indicator aggregates 16 monthly variables capturing global activity, financial markets, uncertainty, expectations, weather, and energy trends. Components include world industrial production, equity and commodity prices, consumer confidence, trade-weighted dollar, geopolitical risk, oil price expectations, and energy output indicators. Currently, it shows conditions as supportive.
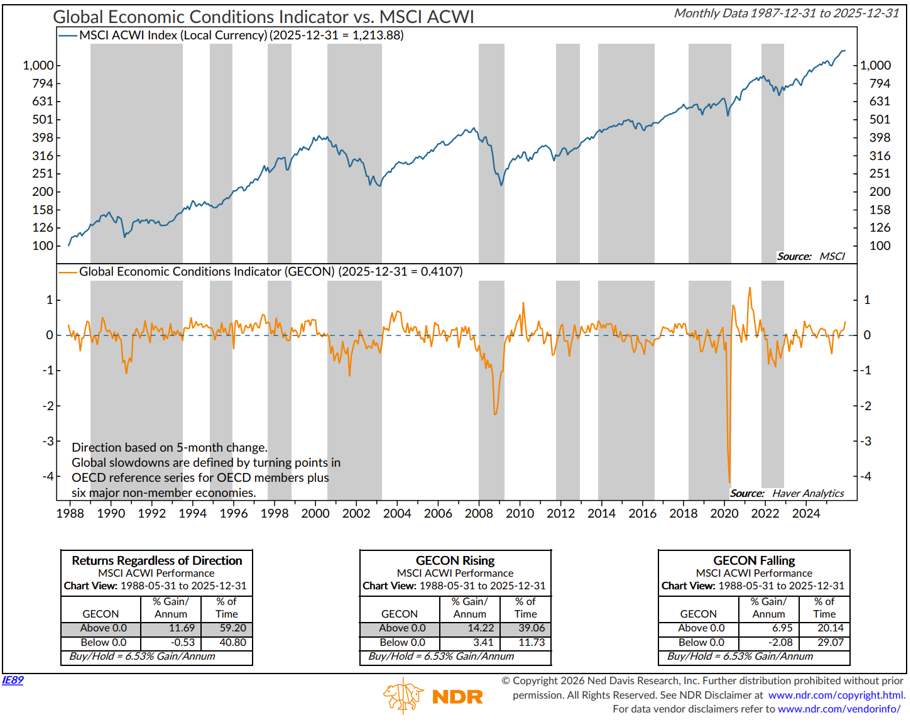
Figure 14: Global economic conditions are supportive for global equities.
Below is NDR’s Global Recession Probability Model, using OECD composite leading indicators from 35 countries. Each CLI contains a wide range of economic indicators, including money supply, yield curve, building permits, consumer and business sentiment, share prices, and manufacturing production. There are usually 5 to 10 indicators, which vary by type and weight depending on the country and are selected based on economic significance, cyclical behavior, and quality. The model continues to suggest a low probability of a global recession occurring in the foreseeable future.
Figure 15: Global Recession Probability is relatively low at this time.
The Atlanta Fed GDPNow Model indicates that Q4 real GDP growth (annualized) could be around 5.4%. While this appears high to us, the point is that economic momentum was strong heading into 2026. And economic momentum rarely stops on a dime.
Figure 16: Economic momentum is a tailwind.
U.S. Economic Releases:
Last week’s U.S. data showed a trend of positive economic activity, with firm retail sales, improving manufacturing surveys, solid industrial production, and steady housing demand. Inflation readings were mostly in line, while jobless claims remained low, suggesting growth momentum despite mixed price pressures this reporting period.
SCOTUS declining to rule on tariffs extends policy uncertainty and is a potential negative overhang until the uncertainty is removed.
The Pending Home Sales report today was a big miss. Bears will pounce.
Unemployment claims and PCE data tomorrow.
On Friday, we’ll see Flash Manufacturing and Flash Services PMIs. Both are expected to come in above 50, indicating expansion.
Figure 17: Economic release calendar.
Bottom Line: The U.S. equity outlook for early 2026 remains cautiously optimistic, though heightened volatility is expected. Solid earnings growth near 15%, easing inflation pressures, and the likelihood of gradual Fed rate cuts create a constructive backdrop for modest market gains. A potential resolution of lingering tariff disputes could further bolster sentiment and supply chain confidence. Still, investors face persistent challenges, including sticky service inflation, policy uncertainty tied to the election cycle and trade negotiations, and early signs of a softening labor market. Economic data continue to suggest resilience, with firm retail sales, improving manufacturing activity, and steady housing demand. Against this mixed backdrop, choppy trading should favor high-quality, cash-rich firms. Productivity gains from AI adoption, industrial onshoring, and strong balance sheets underpin mid-single-digit return expectations, emphasizing disciplined valuation and selective sector exposure.
For more details on each sector and current model levels, please visit our research page at https://dayhagan.com/research.
This strategy uses measures of price, valuation, economic trends, liquidity, and market sentiment to make objective, rational, and emotion-free decisions about how much capital to place at risk and where to allocate it.
If you would like to discuss any of the above or our approach to investing in more detail, please don’t hesitate to schedule a call or webinar. Please call Tyler Hagan at 941-330-1702 to arrange a convenient time for you.
Sincerely,
Donald L. Hagan, CFA
Chief Investment Strategist, Partner, Co-Founder
This material is for educational purposes only. Further distribution is prohibited without prior permission. Please see the information on Disclosures here: https://dhfunds.com/literature. Charts with models and return information use indices for performance testing to extend the model histories, and they should be considered hypothetical.
All Rights Reserved. © Copyright 2026 Day Hagan Asset Management. Data sources: Day Hagan Asset Management, 3Fourteen Research, J.P. Morgan, Goldman Sachs, Barchart, StreetStats, Atlanta Fed, St. Louis Fed, Koyfin, Yardeni, MarketEar, S&P Global, SPDR, FactSet.
Disclosures
S&P 500 Index—An unmanaged composite of 500 large-cap companies, this index is widely used by professional investors as a performance benchmark for large-cap stocks.
S&P 500 Total Return Index – An unmanaged composite of 500 large capitalization companies. Professional investors widely use this index as a performance benchmark for large-cap stocks. This index assumes reinvestment of dividends.
Sentiment – Market sentiment is the prevailing attitude of investors toward a company, a sector, or the financial market.
CBOE Volatility Index (VIX) – A real-time index that represents the market’s expectations for the relative strength of near-term price changes of the S&P 500 Index (SPX). Because it is derived from SPX index options with near-term expiration dates, it produces a 30-day forward volatility projection. Volatility, or how quickly prices change, is often seen as a way to gauge market sentiment, particularly the degree of fear among market participants.
OBOS Indicators—The overbought/Oversold (OBOS) index relates the difference between today’s closing price and the period’s low closing price to the trade margin of the given period.
NFIB – The National Federation of Independent Business advocates for America’s small and independent business owners.
Purchasing Manager Indexes (PMIs) – Purchasing Managers’ Indexes are survey-based economic indicators designed to provide timely insight into business conditions.
FOMC Meeting – The FOMC (Federal Open Market Committee) holds eight regularly scheduled meetings per year. At these meetings, the Committee reviews economic and financial conditions, determines the appropriate stance of monetary policy, and assesses the risks to its long-term goals of price stability and sustainable economic growth.
Consumer Price Index (CPI) – Measures the monthly change in prices paid by U.S. consumers. The Bureau of Labor Statistics (BLS) calculates the CPI as a weighted average of prices for a basket of goods and services representative of aggregate U.S. consumer spending.
Disclosure: The information contained herein is provided for informational purposes only and should not be construed as investment advice or a recommendation to buy or sell any security. The securities, instruments, or strategies described may not be suitable for all investors, and their value and income may fluctuate. Past performance is not indicative of future results, and there is no guarantee that any investment strategy will achieve its objectives, generate profits, or avoid losses.
This material is intended to provide general market commentary and should not be relied upon as individualized investment advice. Investors should consult with their financial professional before making any investment decisions based on this information.
Data and analysis are provided “as is” without warranty of any kind, either express or implied. Day Hagan Asset Management, its affiliates, employees, or third-party data providers shall not be liable for any loss sustained by any person relying on this information. All opinions and views expressed are subject to change without notice and may differ from those of other investment professionals within Day Hagan Asset Management or Ashton Thomas Private Wealth, LLC.
Accounts managed by Day Hagan Asset Management or its affiliates may hold positions in the securities discussed and may trade such securities without notice.
Day Hagan Asset Management is a division of and doing business as (DBA) Ashton Thomas Private Wealth, LLC, an SEC-registered investment adviser. Registration with the SEC does not imply a certain level of skill or training.
There is no guarantee that any investment strategy will achieve its objectives, generate dividends, or avoid losses.
For more information, please contact us at:
Day Hagan Asset Management
1000 S. Tamiami Trail, Sarasota, FL 34236
Toll-Free: (800) 594-7930
Office Phone: (941) 330-1702
Websites: https://dayhagan.com or https://dhfunds.com
© 2026 Day Hagan Asset Management
