
Day Hagan Smart Sector® with Catastrophic Stop Strategy Update January 2026
A downloadable PDF copy of the Article:
Day Hagan Smart Sector® with Catastrophic Stop Strategy Update January 2026 (pdf)
Executive Summary
As of the end of December 2025, the U.S. economic outlook is mixed but remains broadly stable. Growth indicators have softened, but underlying activity has shown resilience amid ongoing macro pressures, including slowing labor momentum and uneven consumer demand. Real-time business surveys showed continued deceleration in goods activity and moderate strength in services. Inflation eased notably, with annual CPI around 2.7%, the lowest in months, but still above the Federal Reserve’s 2% target, reinforcing a gradual disinflation narrative. Real GDP for Q3 was revised higher to 4.3%, but more recent high-frequency data imply a slowdown toward year-end. Core inflation and labor conditions remained sufficiently tight to support a prudent policy stance.
Inflation and Labor
Inflation continued its downward trend in December, reinforcing expectations that the “last mile” of disinflation remains elusive. Labor indicators continued to show cooling, with unemployment projected to average near 4.5% by year-end as labor slack widened modestly.
Federal Reserve Policy
The Federal Reserve cut the federal funds rate by 25 basis points to 3.50–3.75% at its December meeting—marking the third cut in 2025—as inflation softened and labor market momentum weakened. Minutes revealed divisions within the FOMC over the path forward, with projections indicating that only one additional cut is expected next year if inflation continues to moderate.
Sector Drivers & Market Impacts
Equity markets in December responded to the dovish policy shift and easing inflation data, with risk assets benefiting from lower real rates and a softer dollar. Technology and growth sectors outperformed amid easing financial conditions, while economically sensitive sectors saw mixed results amid concerns over slowing domestic demand. Corporate earnings momentum carried forward into December, though higher financing costs in earlier months pressured parts of the industrial sector.
Overall Assessment
The U.S. economy at year-end 2025 was supported by easing inflation, positive revisions to growth data, and accommodative monetary policy. However, slowing PMIs, cooling labor market indicators, and uncertainty around future rate paths underscore crosscurrents that warrant continued cautious monitoring. The balance of evidence suggests a stable but decelerating economic backdrop rather than broad acceleration.
Holdings
Sector
Consumer Discretionary
Consumer Staples
Communication Services
Energy
Financials
Health Care
Industrials
Information Technology
Materials
Real Estate
Utilities
Outlook (relative to benchmark weighting)
Overweight
Neutral
Overweight
Underweight
Underweight
Underweight
Underweight
Overweight
Underweight
Underweight
Underweight
Sector Review
Our January sector tilts imply a macro view centered on moderate growth, easing financial conditions, and a preference for secular over cyclical drivers. Overweights in Information Technology, Communication Services, and Consumer Discretionary suggest confidence in continued demand for digital services, innovation, and consumer spending, particularly in higher-income segments less sensitive to slowing labor conditions. This positioning reflects expectations that lower interest rates and stable inflation will continue to support long-duration growth assets.
Underweights across Energy, Financials, Industrials, Materials, Real Estate, Utilities, and Health Care indicate lower confidence toward cyclicals, defensives, and balance-sheet-sensitive sectors. This suggests expectations for slower industrial activity, subdued commodity demand, and limited pricing power.
The underweight to Financials suggests concern about margin pressure from lower rates and a flattening curve. In contrast, the underweight to Energy and Materials reflects expectations of muted global growth and soft demand for inputs. The underweight to defensives, such as Utilities and Health Care, suggests reduced concern about near-term recession risks. Overall, the portfolio expresses a late-cycle, disinflationary, but not contractionary, macro-outlook.
Consumer Discretionary: Positive indicators point to improving relative conditions. Short- and intermediate-term trend signals are bullish, confirming strengthening relative performance versus the broad market. Momentum, deviation from trend, and overbought/oversold measures all support further upside, suggesting the sector has exited weak positioning. Breadth has improved, with net new highs expanding, and housing activity is supportive, indicating that interest-sensitive demand remains resilient. The decline in long-term yields has also improved valuation support for longer-duration consumer assets. Together, these signals indicate improving participation, strengthening trends, and a favorable technical backdrop. Negative indicators are generally limited to fundamentals. Relative valuation is elevated relative to the market, and consumer credit growth has softened, suggesting some sensitivity to balance-sheet constraints. Spending growth is neutral rather than accelerating. Overall, the balance of evidence currently favors Consumer Discretionary on a relative basis.
Commentary: Leading economic indicators showed continued, but slowing, consumer activity as manufacturing and services PMIs softened. Durable goods orders and retail spending remained positive, but the pace of expansion eased from earlier quarters, suggesting that consumers were prioritizing essentials and experiences over big-ticket items. Within the sector, large-cap names with strong brand franchises and recurring revenue streams outperformed more cyclically exposed companies, as investors favored stable cash flows amid economic uncertainty. Auto and travel-related stocks showed uneven group performance tied to higher financing costs and inventory adjustments, while select retail and consumer services companies benefited from robust holiday spending. Rate volatility and softer credit conditions weighed on financing-sensitive subsectors. Overall, the sector’s performance in December was driven by a cautious consumer profile, sector composition favoring stable franchises, and sensitivity to shifts in spending patterns and interest rates.
Figure 1: Consumer Discretionary showing signs of reversing from oversold levels.
Consumer Staples: Momentum and overbought/oversold measures are supportive, suggesting the sector has recovered from prior weakness. Breadth has improved, with expanding participation and rising net new highs. Financial conditions are supportive, and food sales growth remains steady, indicating stable underlying demand. Short interest has declined, reducing downside positioning pressure, and the sector’s sales yield remains attractive relative to the market. Negative indicators temper the outlook. Trend and deviation-from-trend measures remain bearish, indicating that longer-term relative performance has not fully turned. Food inflation has softened, limiting pricing power, and macro surprise indicators are weak, reflecting slower economic momentum. Overall, the balance of evidence suggests Consumer Staples remains stable but lacks strong catalysts, supporting a neutral relative stance rather than a directional view.
Commentary: With inflation easing but still above target, households remained selective in their spending, prioritizing essentials over discretionary items. Food and beverage companies with stable pricing power performed in line with broader trends, supported by consistent grocery demand. At the same time, margin pressure persisted amid volatility in input costs and softer demand growth, weighing on staples names tied to packaged goods and household products. Sector holdings with strong dividend yields and predictable cash flows were generally viewed as ballast in a volatile market. At the same time, earnings revisions were more subdued, reflecting concerns about slower retail sales and tightening credit for small suppliers. Despite a stable underlying consumption profile, the sector’s overall trajectory was constrained by slowing volume growth and limited pricing leverage, which contributed to cautious investor positioning.
Figure 2: Slowing food inflation is negative for the Staples sector.
Communication Services: Positive indicators are broadly aligned in favor of Communication Services. The relative price trend and moving average indicators are bullish, indicating sustained outperformance relative to the broader market. Overbought and oversold metrics remain supportive, suggesting momentum has not reached exhaustion. Deviation-from-trend signals confirm that the sector is advancing in a controlled manner rather than through unstable spikes. The yield curve backdrop is supportive, with a positive spread favoring longer-duration growth exposures. Relative earnings yield has improved, indicating that valuation support has strengthened alongside price performance. No major indicators are currently signaling deterioration. The absence of negative technical, macro, or valuation signals suggests the relative trend remains intact. Overall, the indicator set supports a constructive outlook, with trend, momentum, macro sensitivity, and valuation dynamics all pointing toward continued relative attractiveness versus the broader equity market.
Commentary: Advertising budgets remained under pressure amid slower global growth, which moderated revenue expectations for social media and search-dependent companies. At the same time, strong engagement on streaming and gaming platforms continued to support recurring revenue streams and subscription growth for large integrated media and platform players. Regulatory scrutiny around privacy and data usage also influenced sector dynamics, prompting increased investment in compliance and diversified monetization. Within the sector, major internet platforms with broad ad ecosystems and cloud linkages showed resilience, while traditional media and telecom-dependent segments faced greater pressure on pricing. The sector’s sensitivity to consumer sentiment and digital spending decisions made it a barometer for discretionary tech exposure, with investor positioning reflecting the trade-off between secular digital trends and near-term macro headwinds.
Figure 3: The Communication Services sector continues its reversal from short-term oversold conditions.
Energy: Positive indicators include improving relative strength versus the broad market, declining volatility, and firm sector breadth, suggesting Energy participation remains stable rather than collapsing. Crude price indicators tied to moving averages and bands remain constructive, and rig count dynamics continue to support supply discipline. A weaker trade-weighted dollar is also modestly supportive for commodity-linked assets. Negative indicators are more dominant. Relative price momentum is deteriorating, and the sector is trading below key moving averages, signaling trend weakness. Free cash flow yield momentum is rolling over, indicating that capital return support is fading. Crude fundamentals are also less favorable, with higher days of supply and weaker spot price behavior weighing on the earnings outlook. Overall, while supply and volatility metrics are stable, weakening price trends, cash flow momentum, and crude fundamentals argue for a relatively unattractive positioning versus other sectors.
Commentary: Oil and gas inventories showed modest draws, helping support near-term sentiment, but broader demand indicators painted a mixed picture. Industrial activity in major economies remained subdued, limiting expectations for sustained increases in crude consumption. Integrated energy companies with diversified upstream and downstream operations demonstrated relative resilience, while pure upstream producers faced pressure from soft refining margins and higher operating costs. Natural gas pricing showed volatility as seasonal demand patterns interacted with storage levels. Currency movements, particularly a weaker U.S. dollar, provided some support for commodity prices, but concerns about slowing global growth offset this. Ongoing capital discipline among producers continued to support free cash flow generation, but weak volume growth and subdued macro signals constrained enthusiasm. Overall, sector performance in December reflected the interaction of supply discipline and softening global demand indicators.
Figure 4: Cash flows remain under pressure.
Financials: Positive indicators include improving relative-strength momentum, a stabilizing total-return trend, and supportive macro and credit conditions. Economic surprises have turned more favorable, business credit conditions remain accommodative, and investment-grade spreads for financial institutions are contained. Loan growth trends are constructive, and a positively sloped yield curve continues to support net interest margins. Negative indicators remain more prominent. Relative price trends are weak, overbought/oversold measures remain unfavorable, and sector volatility and drawdown metrics signal elevated risk. Financials continue to lag on a forward earnings yield basis, and a firm trade-weighted dollar pressures relative performance. Overall, while macro and credit backdrops are not restrictive, weak price trends, elevated volatility, and unattractive valuation signals argue for a relatively unattractive positioning versus other sectors.
Commentary: The Federal Reserve’s decision to hold rates near 3.50–3.75% at its December meeting and signal caution around further cuts affected net interest margin expectations, a key earnings driver for banks. Regional banks with concentrated lending footprints continued to face pressure from slowing loan growth and tighter credit conditions. At the same time, larger diversified institutions fared better due to fee income and trading revenue. Insurance companies benefited from stable premium flows but saw investment income constrained by elevated yields. Credit spreads were generally contained, supporting risk assets, but weak manufacturing and consumer confidence data suggested slower credit demand ahead. Regulatory developments and stress-testing outcomes also factored into positioning. Overall, the Financials sector in December reflected a cautious macro backdrop, with interest-rate policy, credit dynamics, and earnings variability shaping relative performance.
Figure 5: A wider yield curve is one of the few constructive indicators for the sector.
Healthcare: Relative breadth has improved, indicating some internal stabilization, and the sector trend has turned modestly supportive. Medical inflation remains elevated, which historically supports nominal revenue growth and pricing power in parts of the sector. These inputs suggest that Health Care is not in structural decline, but rather in a consolidation phase. Negative signals dominate. The relative price trend, momentum, and momentum reversals are all weak, indicating persistent underperformance relative to the broader market. Drawdown behavior remains unfavorable, suggesting poor downside characteristics in recent stress periods. Health care spending growth is slowing, reducing a key fundamental tailwind, while valuation metrics, as reflected in book yield, appear unattractive relative to peers. Construction and capacity indicators are neutral and provide no offset. Overall, the balance of evidence points to continued relative headwinds, with weak trend, soft demand signals, and unfavorable risk characteristics outweighing limited internal stabilization.
Commentary: Broad economic data pointed to slowing growth, which weighed on health services and elective procedure demand, while stable essential spending supported defensive healthcare segments. Larger pharmaceutical companies with strong pipelines and recurring revenue profiles were more resilient, benefiting from ongoing demand for branded medicines and steady pricing power. Biotech names saw varied performance as clinical data releases and regulatory news influenced stock-specific moves. Managed care and insurance names reacted to evolving cost trends, with expense pressures from utilization changes becoming a focus. Cost inflation in medical services and input prices remained above the broader CPI, tightening margins for some providers. Investors also monitored FDA approval timelines and patent cliffs, which impacted forward guidance. Overall, Healthcare in December reflected a balance between defensive demand and sector-specific operational challenges amid a slowing macro backdrop.
Figure 6: Health Care technicals, including momentum, are relatively weak.
Industrials: Positive indicators are present but few. Relative price momentum and trend are supportive, and RSI suggests near-term technical strength. Cash-flow yield has improved, and the sector benefits from firmer industrial production and commodity stabilization, as reflected in the CRB signal. These factors point to some cyclical traction and short-term support. However, the negative signals outweigh these positives. Sector volatility is elevated, indicating unstable risk characteristics. The number of new lows remains high, suggesting weak internal breadth. Sales yield is deteriorating, pointing to margin or revenue pressure, while higher oil prices act as a cost headwind. A stronger U.S. dollar also weighs on global industrial demand and earnings translation. Consumer confidence provides no offset and remains neutral. Overall, Industrials show improving technicals but weak fundamentals, rising risk, and macro headwinds, leaving the sector relatively unattractive on a risk-adjusted basis despite short-term momentum.
Commentary: Business activity surveys showed continued but slowing expansion in services and a contraction in manufacturing, which weighed on industrial demand for capital goods and reduced forward order visibility. Companies tied to transportation and logistics faced headwinds from softer freight volumes and capacity overhang, while defense and aerospace firms benefited from stable government contracts and backlog visibility. Infrastructure spending trends remained a focal point, with uneven state and local budget execution impacting contractors differently. Industrial inputs were affected by fluctuating commodity prices, which pressured margins in certain sub-segments. Market participants also monitored tariff developments and supply-chain adjustments, which influenced inventory management and capital expenditure pacing. Overall, Industrials in December exhibited cautious investor positioning due to softening end-demand and slowing manufacturing indicators, partially offset by pockets of stable government spending and differentiated company fundamentals.
Figure 7: The Industrials sector’s profitability may be impacted by rising commodity costs.
Information Technology: Positive indicators dominate. Relative price momentum is strong, and overbought/oversold measures remain supportive, indicating continued trend persistence rather than exhaustion. Sales yield is improving, suggesting that revenue generation is keeping pace with price performance. Market-based inflation expectations are also supportive, as stable or easing inflation lowers discount-rate pressure on long-duration growth assets. Earnings revision breadth is positive, pointing to improving forward fundamentals and analyst confidence in the sector’s outlook. Negative signals are limited. Short interest has risen, indicating some investor skepticism and positioning risk, but it has not yet translated into broad technical or fundamental deterioration. Overall, the combination of strong momentum, improving sales efficiency, supportive macro conditions, and positive earnings revisions points to a constructive backdrop for Information Technology. While positioning risk warrants monitoring, the balance of evidence supports Technology as relatively attractive on both technical and fundamental dimensions.
Commentary: Services activity remained positive even as manufacturing weakened, supporting demand for enterprise software and cloud services. Investors continued to favor scalable revenue models and secular growth themes, particularly in areas tied to artificial intelligence infrastructure and digital transformation. Large-cap technology names with substantial earnings revisions and recurring revenue profiles helped anchor the sector, while more cyclically exposed IT subgroups showed greater sensitivity to slowing global demand. Persistent above-target inflation earlier in the quarter had pressured discount rates, but easing price pressures and a dovish tilt from the Fed helped reduce valuation headwinds late in the month. Currency stability also supported overseas revenue translation. Overall, IT outperformance in December reflected defensive growth characteristics, resilient end-market demand in tech services, and improving monetary conditions, even as broader economic indicators softened.
Figure 8: The Information Technology sector appears to be reversing from shorter-term oversold lows.
Materials: Positive indicators are present but mixed. Relative price trend and momentum are supportive, and overbought/oversold measures do not yet signal exhaustion. Volatility has moderated, reducing near-term risk. Precious-metal momentum is constructive, and both earnings yield and sales yield have improved, suggesting valuation support and stable sector cash generation. Negative signals remain more critical. The moving-average cross and deviation from trend indicate weak longer-term relative performance. Relative momentum versus global equities is deteriorating, implying that Materials are lagging broader risk assets. Natural gas pricing dynamics are unfavorable, and industrial production tied to materials is weakening, pointing to soft end-demand. Copper momentum is neutral, offering no cyclical confirmation. Overall, while valuations and select commodity trends provide support, weak macro linkages, lagging relative performance, and soft industrial activity leave the sector relatively unattractive on a forward-looking basis.
Commentary: Macro indicators showed slowing manufacturing activity, which weighed on demand for industrial inputs and base materials. Softness in U.S. and eurozone PMIs suggested cooling activity in end markets that use materials, limiting order growth. Commodity prices were volatile: precious metals showed relative strength, while industrial metals like copper fluctuated amid uncertainty about global demand. Companies with diversified materials portfolios held up better than pure industrial metals producers, as stable cash flows from specialty chemicals and packaging helped support them. Inventory levels and production schedules remained conservative, as firms balanced cost control with soft demand signals. Currency movements, including a moderately weaker U.S. dollar, offered a mild tailwind for exports but did not offset demand headwinds. Overall, Materials in December was influenced by weaker global manufacturing demand, mixed signals from commodity prices, and cautious inventory and production trends.
Figure 9: Slower EM activity has historically been negative for the Materials sector.
Real Estate: Positive indicators are limited. Short-term relative breadth has improved, suggesting some stabilization in participation, and performance versus homebuilders has firmed, reflecting pockets of housing-related resilience. The Citi Economic Surprise signal is also supportive, indicating that recent macro data have modestly exceeded expectations. Negative signals dominate. Relative price trend and deviation from trend remain weak, pointing to sustained underperformance. The sector has experienced a low share of positive trading days, reflecting persistent negative momentum. Higher long-term yields continue to pressure real estate valuations through discount-rate effects. At the same time, soft unemployment trends, weak construction-supply activity, and tight small-business credit conditions weigh on demand and financing. Overall, while short-term breadth has improved, the combination of unfavorable rates, weak trend dynamics, and macro headwinds leaves Real Estate relatively unattractive on a risk-adjusted and forward-looking basis.
Commentary: With the Federal Reserve holding rates and signaling caution on further cuts, long-term yields remained elevated relative to recent history, pressuring discount rates and valuations for real estate investment trusts (REITs). Housing demand indicators were mixed, with single-family starts showing modest improvement but broader activity subdued, limiting growth visibility for property developers. Within the sector, REITs with strong income streams from essential services, such as logistics and healthcare properties, outperformed more cyclical property types, such as office and retail, which faced slower leasing activity. Supply conditions remained tight in key markets, but higher financing costs continued to weigh on acquisition activity and cap-rate compression. Overall, Real Estate in December reflected cautious investor positioning, driven by rate sensitivity, uneven demand across property types, and a macro backdrop of moderating growth.
Figure 10: Higher for longer rates are not good for the sector.
Utilities: Relative price momentum has improved, and overbought/oversold measures no longer signal exhaustion. Short-term breadth has strengthened, and performance versus energy inputs has benefited from stable crude prices. PMI-related support suggests utilities are holding up in a slowing but not contracting industrial environment. Dividend yield remains attractive on a nominal basis, providing some income support. Negative signals remain dominant. The moving-average trend and price reversals point to ongoing relative weakness. Deviation from trend remains negative, indicating that the sector has not re-established leadership. The earnings yield relative to Treasury yields is unattractive, reflecting poor valuation support in a higher-rate environment. Capacity utilization trends are weakening, reducing demand visibility. Overall, while Utilities offer income and short-term stabilization, unfavorable relative trends, valuation pressure from higher yields, and weak macro sensitivity leave the sector relatively unattractive on a forward-looking basis.
Commentary: With the Federal Reserve holding its policy rate and signaling caution on further easing, long-term yields stayed higher than earlier in the year, which pressured utility valuations due to their rate sensitivity. Economic indicators showed slower industrial activity and mixed consumer spending, reinforcing utilities’ defensive positioning amid investor demand for stable cash flows. Within the sector, regulated electric and water utilities with predictable revenue streams and strong dividend coverage performed in line with defensive demand. At the same time, independent power producers faced variability tied to fuel costs and weather patterns. Broader market volatility and concerns about future growth also supported flows into lower-beta assets, such as utilities. Overall, Utilities in December were shaped by rate expectations, defensive demand trends, and sector characteristics that favor income stability amid slowing economic momentum.
Figure 11: Technicals remain a headwind for the Utilities sector.
Catastrophic Stop Update
The Catastrophic Stop model combines time-tested, objective indicators designed to identify high-risk periods for the equity market. The model entered January recommending a fully invested equity allocation relative to the benchmark.
The weight of the evidence suggests that any weakness is unlikely to extend into a significant downtrend at this time. Of course, if our model triggers a sell signal (below 40% for two consecutive days), indicating more substantial problems, we will raise cash immediately.
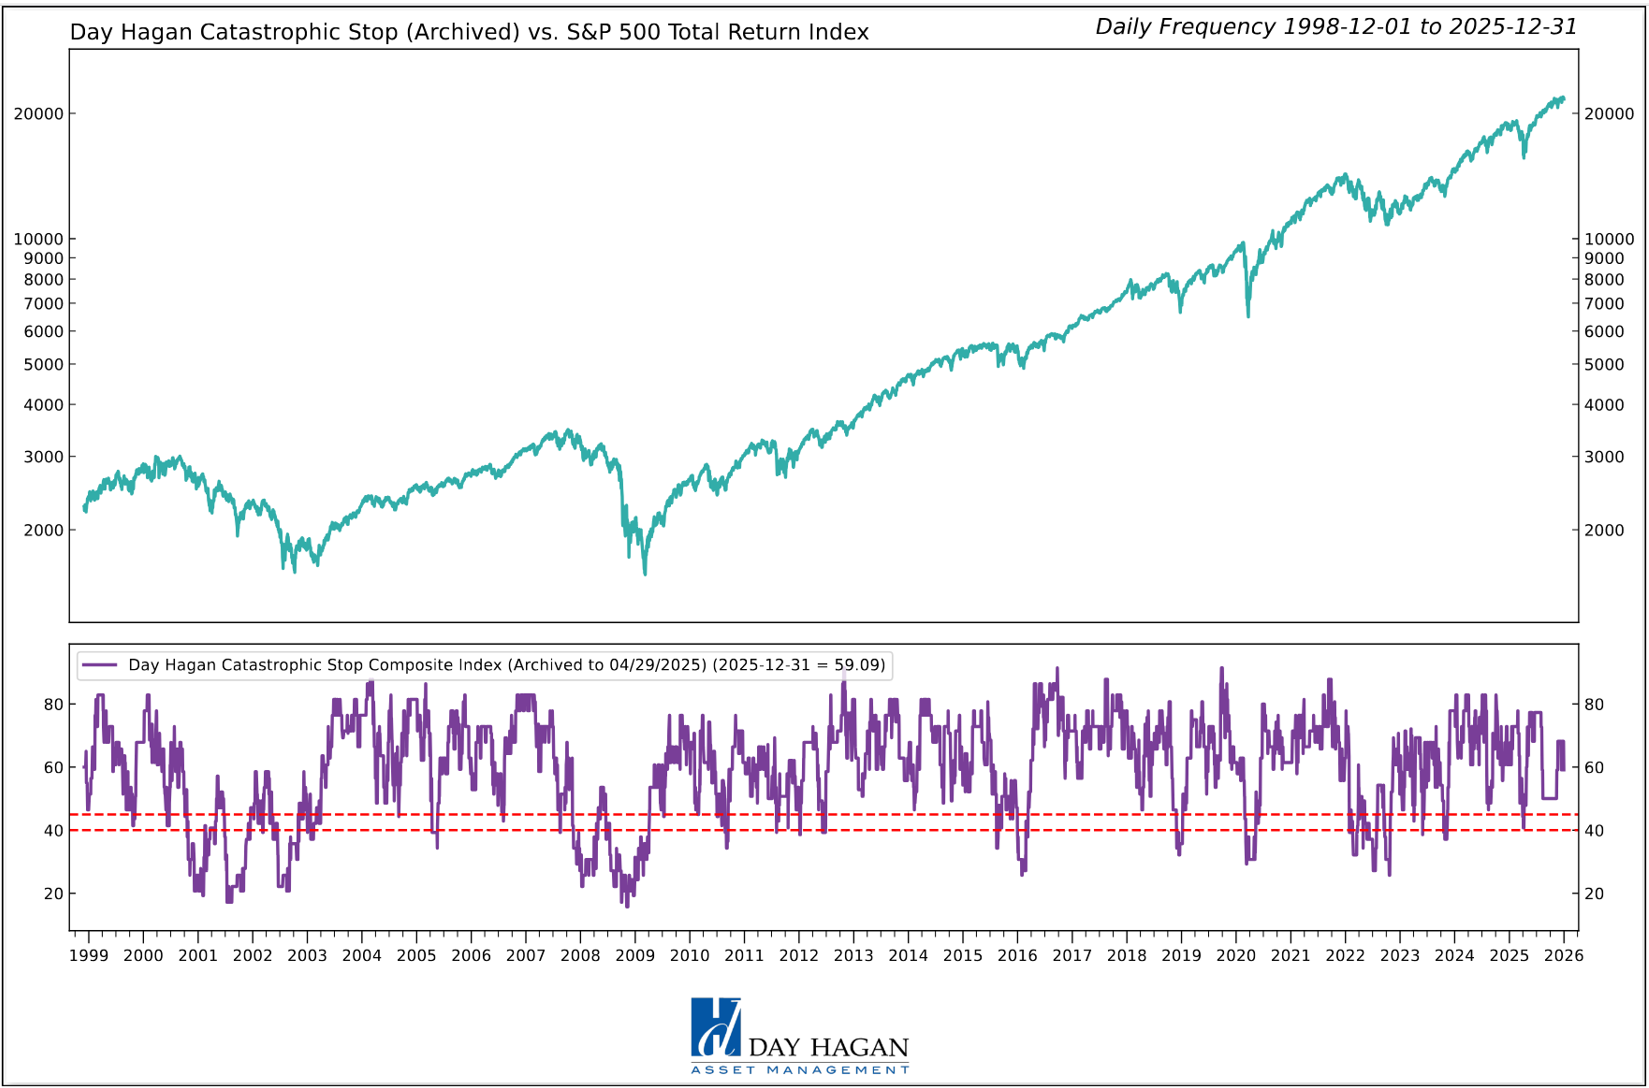
Figure 12: The Catastrophic Stop model recommends a fully invested equity position (relative to the benchmark). Because the model uses indices to extend its history, it is considered hypothetical.
The Day Hagan Daily Market Sentiment Composite (part of the Catastrophic Stop Model) remains in the “Excessive Pessimism” zone, reflecting a notable rise in investor caution. Sentiment remains excessively pessimistic based on our short-term model. This is viewed as a net positive from a contrary opinion perspective.
Figure 13: Investor sentiment is being reset, as illustrated by the DH Daily Market Sentiment Composite declining below 70. A reversal back above 30% would enhance the potential for a rally.
Our goal is to stay on the right side of the prevailing trend, introducing risk management when conditions deteriorate. Currently, the uptrend remains intact. The broader-based composite models, which call for U.S. and international economic growth, inflation trends, liquidity, and equity demand, remain constructive. The Catastrophic Stop model is positive, and we align with its message. If our models shift to bearish levels, we will raise cash.
This strategy uses measures of price, valuation, economic trends, liquidity, and market sentiment to make objective, rational, and unemotional decisions about how much capital to allocate and where to invest it.
Day Hagan Asset Management
1000 S. Tamiami Trl
Sarasota, FL 34236
Toll Free: (800) 594-7930
Office Phone: (941) 330-1702
Website: https://dayhagan.com or https://dhfunds.com
This material is for educational purposes only. Further distribution is prohibited without prior permission. Please see the information on Disclosures and Fact Sheets here: https://dhfunds.com/literature. Charts with models and return information use indices for performance testing to extend the model histories, and they should be considered hypothetical. All Rights Reserved. (© Copyright 2026 Day Hagan Asset Management.)
Day HaganSmart Sector®
With Catastrophic Stop ETF
Symbol: SSUS
Disclosures
The data and analysis contained within are provided “as is” and without warranty of any kind, either express or implied. The information is based on data believed to be reliable, but it is not guaranteed. Day Hagan DISCLAIMS ANY AND ALL EXPRESS OR IMPLIED WARRANTIES, INCLUDING, BUT NOT LIMITED TO, ANY WARRANTIES OF MERCHANTABILITY, SUITABILITY, OR FITNESS FOR A PARTICULAR PURPOSE OR USE. All performance measures do not reflect tax consequences, execution, commissions, and other trading costs, and as such, investors should consult their tax advisors before making investment decisions, as well as realize that the past performance and results of the model are not a guarantee of future results. The Smart Sector® Strategy is not intended to be the primary basis for investment decisions, and the usage of the model does not address the suitability of any particular investment for any particular investor.
Using any graph, chart, formula, model, or other device to assist in deciding which securities to trade or when to trade them presents many difficulties, and their effectiveness has significant limitations, including that prior patterns may not repeat themselves continuously or on any particular occasion. In addition, market participants using such devices can impact the market in a way that changes the effectiveness of such devices. Day Hagan believes no individual graph, chart, formula, model, or other device should be used as the sole basis for any investment decision and suggests that all market participants consider differing viewpoints and use a weight-of-the-evidence approach that fits their investment needs.
Past performance does not guarantee future results. No current or prospective client should assume future performance of any specific investment or strategy will be profitable or equal to past performance levels. All investment strategies have the potential for profit or loss. Changes in investment strategies, contributions or withdrawals, and economic conditions may materially alter the performance of your portfolio. Different types of investments involve varying degrees of risk, and there can be no assurance that any specific investment or strategy will be suitable or profitable for a client’s portfolio. Historical performance results for investment indexes and/or categories generally do not reflect the deduction of transaction and/or custodial charges or the deduction of an investment management fee, the incurrence of which would have the effect of decreasing historical performance results. There can be no assurances that a portfolio will match or outperform any particular benchmark. Comparisons to indices are inherently unreliable indicators of future performance. The strategies used to generate the performance vary from those used to generate the returns depicted in the benchmarks. Investors cannot directly invest in an index.
The information contained herein is provided for informational purposes only and should not be construed as investment advice or a recommendation to buy or sell any security. The securities, instruments, or strategies described may not be suitable for all investors, and their value and income may fluctuate. Past performance is not indicative of future results, and there is no guarantee that any investment strategy will achieve its objectives, generate profits, or avoid losses.
This material is intended to provide general market commentary and should not be relied upon as individualized investment advice. Investors should consult with their financial professional before making any investment decisions based on this information.
The material may contain “forward-looking” information that is not purely historical in nature. Such information may include, among other things, projections, forecasts, estimates of market returns, and proposed or expected portfolio composition. Day Hagan Asset Management, its affiliates, employees, or third-party data providers shall not be liable for any loss sustained by any person relying on this information. All opinions and views expressed are subject to change without notice and may differ from those of other investment professionals within Day Hagan Asset Management or Ashton Thomas Private Wealth, LLC.
Accounts managed by Day Hagan Asset Management or its affiliates may hold positions in the securities discussed and may trade such securities without notice.
Day Hagan Asset Management is a division of and doing business as (DBA) Ashton Thomas Private Wealth, LLC, an SEC-registered investment adviser. Registration with the SEC does not imply a certain level of skill or training.
There is no guarantee that any investment strategy will achieve its objectives, generate dividends, or avoid losses.
This material is for educational purposes only. Further distribution is prohibited without prior permission. Please see the information on Disclosures and Fact Sheets here: https://dhfunds.com/literature. Charts with models and return information use indices for performance testing to extend the model histories, and they should be considered hypothetical. All Rights Reserved. (© Copyright 2026 Day Hagan Asset Management.)
All hypothetical results are presented for illustrative purposes only. Back-testing and other statistical analysis is provided in use simulated analysis and hypothetical circumstances to estimate how it may have performed prior to its actual existence. The results obtained from "back-testing" information should not be considered indicative of the actual results that might be obtained from an investment or participation in a financial instrument or transaction referencing the Index. The Firm provides no assurance or guarantee that the products/securities linked to the strategy will operate or would have operated in the past in a manner consistent with these materials. The hypothetical historical levels have inherent limitations. Alternative simulations, techniques, modeling or assumptions might produce significantly different results and prove to be more appropriate. Actual results will vary, perhaps materially, from the simulated returns presented.
© 2026 Day Hagan Asset Management
