
Day Hagan Catastrophic Stop Update January 13, 2026
A downloadable PDF copy of the Article:
The Day Hagan Catastrophic Stop model held steady at 59.09%. The model continues to indicate that investors should maintain their benchmark equity exposure.
Figure 1: The Catastrophic Stop model would generate a sell signal by closing below 40% for two consecutive days. The current message is positive, indicating investors should maintain benchmark equity exposure.
The Daily Market Sentiment Composite remains neutral, having reversed from extreme pessimism. This condition supports the continuation of the current uptrend. Overall, sentiment leans positive but is not at extreme exuberance, which historically is constructive for an ongoing uptrend.
Figure 2: Sentiment is neither overly optimistic nor pessimistic.
Positioning indicators remain essentially unchanged from last week, with equity exposure for algos and systematic traders holding above neutral. Overall, systematic investor positioning is elevated but not overly stretched.
Figure 3: Positioning moderately above neutral. The 10% volatility‑target equity allocation’s 5-year rolling z‑score is above average but remains well inside typical “extreme” bands, indicating enthusiasm that is elevated versus history, yet not statistically euphoric or dislocated.
The S&P 500 remains in a strong uptrend near highs, signaling a constructive primary trend. However, DBMF’s negative equity exposure reflects a defensive shift, highlighting a regime mismatch. This divergence suggests rising fragility and higher volatility risk—more consistent with potential corrections or choppiness than an outright bear market. DBMF illustrates how systematic trends and macro signals dynamically adjust equity exposure in response to changes in volatility, momentum, and drawdown risk.
Figure 4: DBMF exposure to SPX is relatively low. Two ways to interpret this: 1) Systematic investors are nervous, and/or 2) Systematic investors are underinvested and are a potential source of demand.
From an overbought/oversold perspective, the S&P 500 has entered overbought territory. The Nasdaq Composite chart looks very similar. We view this as a near-term headwind that will have to be worked through. The good news is that sentiment and positioning indicators aren’t overly extended; if they were, this condition would be more problematic.
Figure 5: The S&P 500 is now overbought, based on a near-term, 14-day appraisal. This is a headwind.
The chart below shows that when Zweig Breadth Thrusts and DeGraaf breadth signals occur close together, subsequent S&P 500 returns are historically strong. Forward 6- and 12-month gains have averaged well above normal with limited drawdowns, indicating these rare breadth combinations typically mark durable upside momentum rather than market tops. The “co-thrusts” occurred on 5-12-2025, so there is, presumably, still upside potential into May. This aligns with the 2026 Cycle Composite (as shown in past updates).
The S&P 500 currently exhibits positive gamma, confirmed by significant net positive positioning across major strikes. This environment dampens intraday volatility, keeping price swings contained and supporting market stability. Heading into the new year, this constructive setup provides a favorable backdrop for equities, minimizing the risk of disorderly moves absent unexpected catalysts.
Figure 7: SPX gamma condition is currently favorable. Gamma flips to negative below 6,922.
There was quite a bit of news over the past couple of weeks. Here’s a brief recap and our thoughts around the potential ramifications:
Powell / DOJ:
Powell–DOJ confrontation threatens Fed independence, lifting risk premia, steepening curves, weakening the dollar, and embedding higher inflation expectations as politically driven policy undermines U.S. financial credibility.
MBS Purchases:
Politically directed $200B MBS buying initially supports housing and REITs but distorts price discovery, pressures yields higher, weakens the dollar, and raises concerns about quasi-fiscal balance-sheet expansion.
Credit Card Cap:
A hard 10% cap compresses card margins, widens subordinated spreads, tightens underwriting, slows consumer credit growth, weighs on cyclicals, and elevates perceived U.S. regulatory risk premia.
Venezuela:
Reconfigured sanctions and restructuring hopes lift Venezuelan credit, modestly expand medium-term oil supply, lower energy risk premia, but keep local assets volatile as global oil trades mainly on demand.
Iran:
Escalating unrest and brinkmanship in Iran raise oil risk premia, aid energy equities and safe-haven assets, yet threaten broader EM cyclicals if growth and trade expectations deteriorate.
Greenland:
A serious U.S. Greenland push heightens great-power tensions, supports defense and mining equities, boosts geopolitical risk premia, and intermittently channels safe-haven flows into Treasuries and the dollar.
Net, the outlook skews toward potentially higher risk premia and greater policy uncertainty. Political pressure on institutions, regulatory intervention, and quasi-fiscal actions weaken confidence and support inflation and term risk. Energy and defense benefit selectively, but broader credit, cyclicals, and EM assets face headwinds as volatility and credibility risks rise.
Figure 8: Economic Policy Uncertainty is above average. The latest reading of 259 signals elevated—but not extreme—policy uncertainty. The chart shows that equities can continue to grind higher despite volatile uncertainty. While policy shocks often drive short-term drawdowns, the S&P 500's longer-term trend has remained resilient across multiple high-uncertainty regimes.
3Fourteen Research recently published an interesting analysis on midterm election years. The chart below illustrates that midterm years have historically been the weakest of the four-year presidential cycle.
Figure 9: S&P 500 Returns around midterm election years.
Even so, midterm years absent a recession or Fed tightening have historically delivered double-digit gains on average. At this point, recession probabilities remain relatively low, and we view the Fed as market-positive.
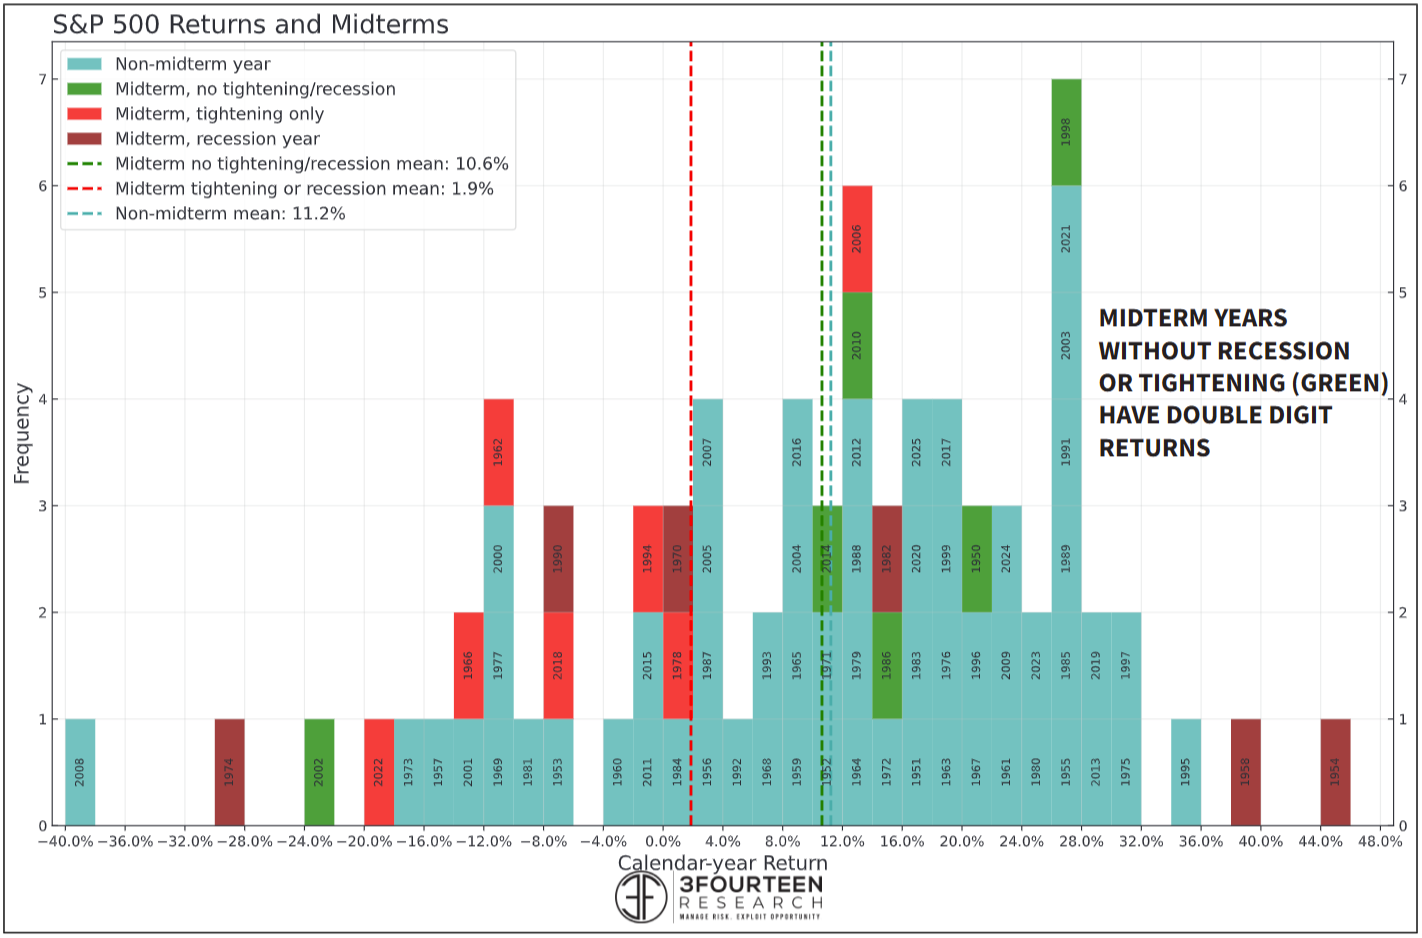
Figure 10: Midterm years without recession or tightening are positive on average.
As we head into 2026, 3Fourteen notes that the 6-month change in Household Equity as a Percentage of GDP recently exhibited its largest increase in history.
Figure 11: 6-month change in household equity as a % of GDP.
Large increases in household wealth have typically translated into higher consumer spending about 2 quarters later. This tailwind is constructive for economic activity.
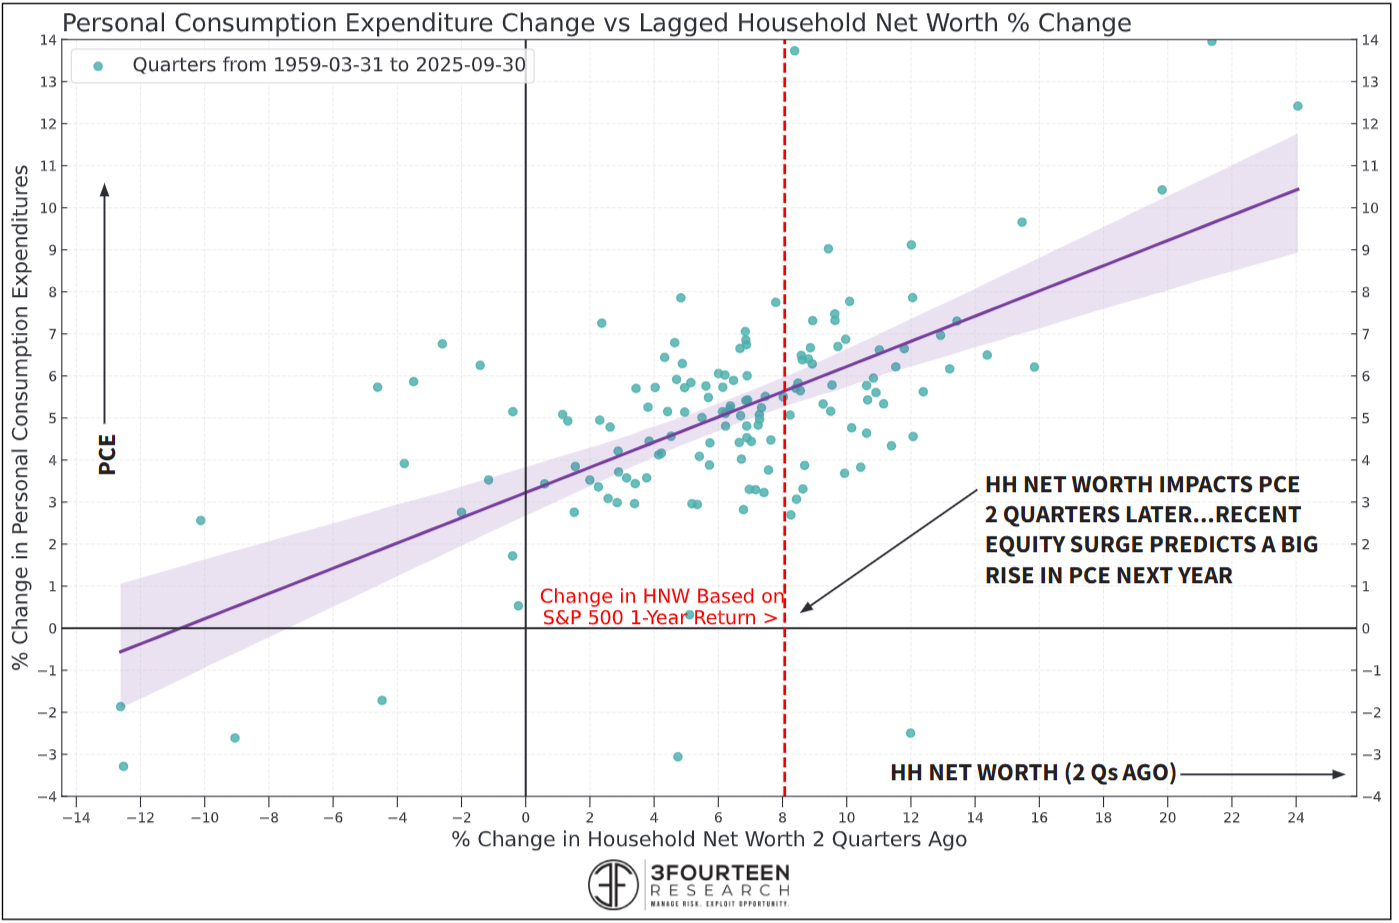
Figure 12: Increases in wealth often precede higher consumer spending.
Turning to employment, you’ve all likely seen the recent UE report. Overall, it indicated a balanced labor market. However, we aren’t sanguine about this condition. For example, the chart below shows that there are fewer job openings than unemployed Americans (as of 11-30). While concerning, we do note that this condition persisted from at least 12-31-2000 through 2018. During that time, the CAGR of real GDP averaged just below 2% (1.96%).
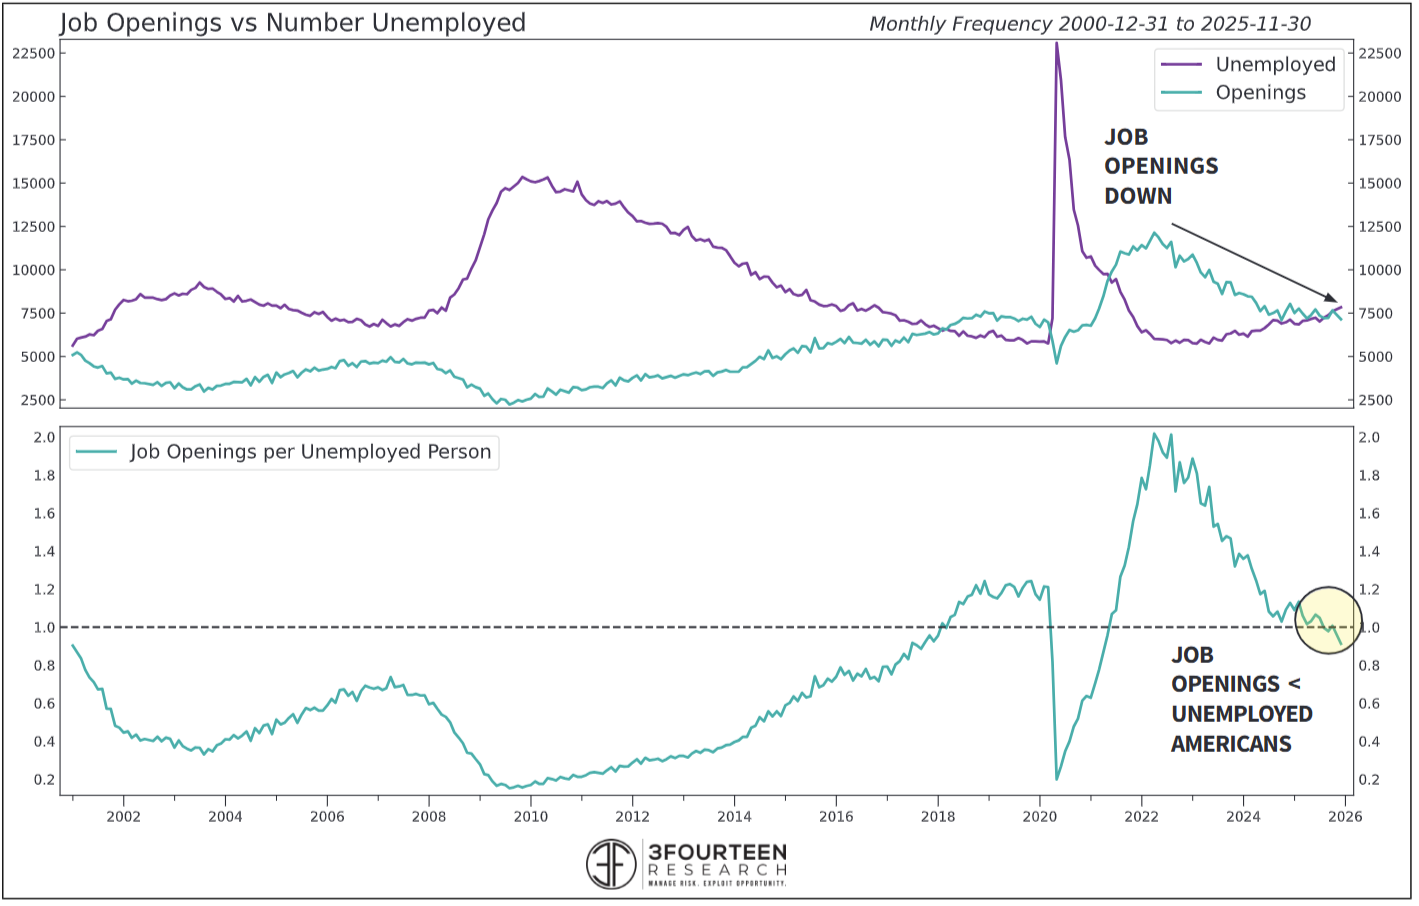
Figure 13: Some slight cracks in the employment outlook to keep an eye on.
Turning to inflation, the CPI report was also relatively benign (Core CPI 2.6%). Shelter costs were the largest contributor to the inflation result. With supply increasing and affordability improving, we continue to expect shelter (OER) costs to decline.
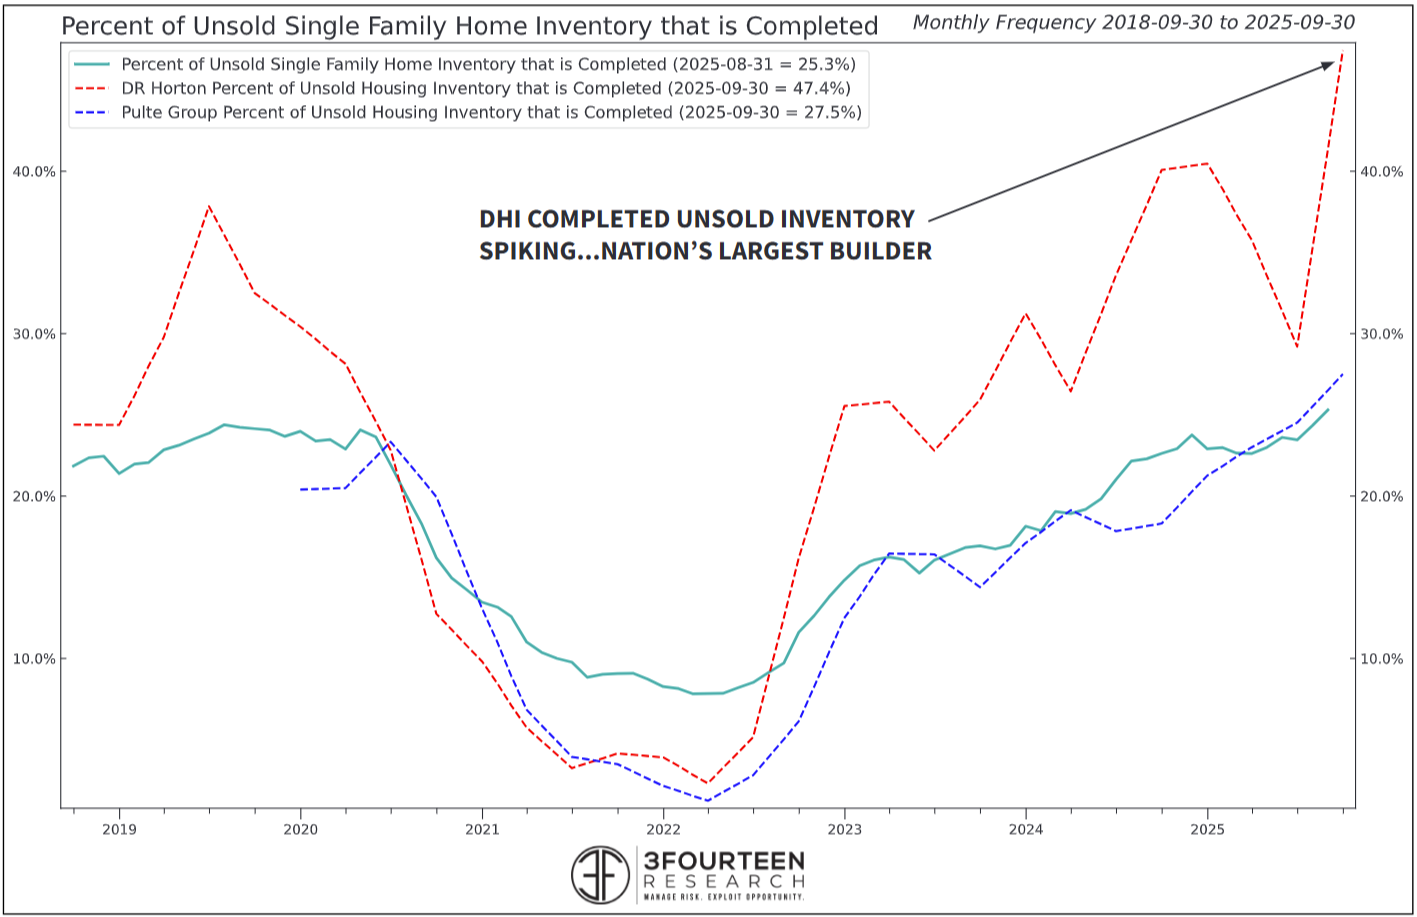
Figure 14: Underneath the hood, increased housing supply could lead to lower prices.
There’s been a lot of press about recent commodity price increases. NDR shows that out of 19 commodities tracked, 63% are above their 50-day moving averages, and 60% have rising 50-day moving averages. Both conditions have historically supported an inflationary impulse. Nonetheless, most of the increases have been in the Metals complex. This doesn’t negate the potential problem, but among Softs, Energy, Grains, and Livestock, the inflation forces are more disinflationary.
Figure 15: Some commodity sectors are ramping higher, with others heading in the opposite direction. The net result is that we have minor concerns and are watching to see if other commodity sectors play catch-up or if metals catch down.
Figure 16: Note the 52-week ROC for metals-related commodities. (Through 1-11-2026. Source: Barchart)
Figure 17: In contrast to the softs.
U.S. Economic Releases:
Last week’s data was mixed: The service sector is robust, but the manufacturing sector is under pressure, and the labor market shows signs of gradual cooling. So far, the data support trend levels of economic activity.
SCOTUS declining to rule on tariffs extended policy uncertainty, weighing on equities, lifting volatility, and pressuring cyclicals as markets priced prolonged trade ambiguity globally.
Keep an eye on Retail Sales, PPI, and Inventory data tomorrow (Wednesday).
And, as always, unemployment claims on Thursday.
Figure 18: Economic release calendar.
Bottom Line: The U.S. equity outlook for early 2026 remains cautiously optimistic, though investors should brace for elevated volatility (see our recent updates on potential January headwinds). Resilient earnings growth—estimated at roughly 15%—and the anticipated potential resolution of the “Liberation Day” tariff disruptions provide a constructive backdrop for modest market gains. However, persistent inflation pressures, political uncertainty surrounding the Supreme Court’s potential tariff ruling, and signs of a cooling labor market remain meaningful headwinds. We expect choppy trading conditions to favor high-quality sectors. Our models currently emphasize the Information Technology, Communication Services, and Consumer Discretionary sectors, while the Materials sector’s composite reading has also shown recent improvement.
For more details on each sector and current model levels, please visit our research page at https://dayhagan.com/research.
If you would like to discuss any of the above or our approach to investing in more detail, please don’t hesitate to schedule a call or webinar. Please call Tyler Hagan at 941-330-1702 to arrange a convenient time for you.
Sincerely,
Donald L. Hagan, CFA
Chief Investment Strategist, Partner, Co-Founder
This material is for educational purposes only. Further distribution is prohibited without prior permission. Please see the information on Disclosures here: https://dhfunds.com/literature. Charts with models and return information use indices for performance testing to extend the model histories, and they should be considered hypothetical.
All Rights Reserved. © Copyright 2026 Day Hagan Asset Management. Data sources: Day Hagan Asset Management, 3Fourteen Research, J.P. Morgan, Goldman Sachs, Barchart, StreetStats, Atlanta Fed, St. Louis Fed, Koyfin, Yardeni, MarketEar, S&P Global, SPDR, FactSet.
Disclosures
S&P 500 Index—An unmanaged composite of 500 large-cap companies, this index is widely used by professional investors as a performance benchmark for large-cap stocks.
S&P 500 Total Return Index – An unmanaged composite of 500 large capitalization companies. Professional investors widely use this index as a performance benchmark for large-cap stocks. This index assumes reinvestment of dividends.
Sentiment – Market sentiment is the prevailing attitude of investors toward a company, a sector, or the financial market.
CBOE Volatility Index (VIX) – A real-time index that represents the market’s expectations for the relative strength of near-term price changes of the S&P 500 Index (SPX). Because it is derived from SPX index options with near-term expiration dates, it produces a 30-day forward volatility projection. Volatility, or how quickly prices change, is often seen as a way to gauge market sentiment, particularly the degree of fear among market participants.
OBOS Indicators—The overbought/Oversold (OBOS) index relates the difference between today’s closing price and the period’s low closing price to the trade margin of the given period.
NFIB – The National Federation of Independent Business advocates for America’s small and independent business owners.
Purchasing Manager Indexes (PMIs) – Purchasing Managers’ Indexes are survey-based economic indicators designed to provide timely insight into business conditions.
FOMC Meeting – The FOMC (Federal Open Market Committee) holds eight regularly scheduled meetings per year. At these meetings, the Committee reviews economic and financial conditions, determines the appropriate stance of monetary policy, and assesses the risks to its long-term goals of price stability and sustainable economic growth.
Consumer Price Index (CPI) – Measures the monthly change in prices paid by U.S. consumers. The Bureau of Labor Statistics (BLS) calculates the CPI as a weighted average of prices for a basket of goods and services representative of aggregate U.S. consumer spending.
Disclosure: The information contained herein is provided for informational purposes only and should not be construed as investment advice or a recommendation to buy or sell any security. The securities, instruments, or strategies described may not be suitable for all investors, and their value and income may fluctuate. Past performance is not indicative of future results, and there is no guarantee that any investment strategy will achieve its objectives, generate profits, or avoid losses.
This material is intended to provide general market commentary and should not be relied upon as individualized investment advice. Investors should consult with their financial professional before making any investment decisions based on this information.
Data and analysis are provided “as is” without warranty of any kind, either express or implied. Day Hagan Asset Management, its affiliates, employees, or third-party data providers shall not be liable for any loss sustained by any person relying on this information. All opinions and views expressed are subject to change without notice and may differ from those of other investment professionals within Day Hagan Asset Management or Ashton Thomas Private Wealth, LLC.
Accounts managed by Day Hagan Asset Management or its affiliates may hold positions in the securities discussed and may trade such securities without notice.
Day Hagan Asset Management is a division of and doing business as (DBA) Ashton Thomas Private Wealth, LLC, an SEC-registered investment adviser. Registration with the SEC does not imply a certain level of skill or training.
There is no guarantee that any investment strategy will achieve its objectives, generate dividends, or avoid losses.
For more information, please contact us at:
Day Hagan Asset Management
1000 S. Tamiami Trail, Sarasota, FL 34236
Toll-Free: (800) 594-7930
Office Phone: (941) 330-1702
Websites: https://dayhagan.com or https://dhfunds.com
© 2026 Day Hagan Asset Management
