
Day Hagan Smart Sector® International Strategy Update January 2026
A downloadable PDF copy of the Article:
Day Hagan Smart Sector® International Strategy Update January 2026 (pdf)
Executive Summary
Global Equity Performance: A Regional Snapshot
In December, global equity markets displayed a coordinated year-end rally, driven by the finalization of central bank pivots and "window dressing" by institutional investors. Unlike the divergence seen in November, developed markets largely moved in tandem, buoyed by liquidity injections and clarity in 2026 monetary policy paths.
Europe: Stabilization and Rate Cut Optimism
European markets recovered from November’s mixed performance. French and German equities converged as the European Central Bank (ECB) delivered a widely anticipated 25 basis point rate cut mid-month, citing stabilized inflation metrics.
Germany: The DAX rebounded as industrial orders surprised to the upside for the first time in Q4, suggesting the manufacturing slump had bottomed out.
France: French equities maintained their positive momentum from November, led by luxury goods and retail sectors, anticipating strong holiday consumption.
United Kingdom: The FTSE 100 recovered lost ground, outperforming the broader European index. This reversal was triggered by the Bank of England’s unanimous decision to hold rates steady but signal a dovish turn for Q1 2026, relieving fears of overtightening.
Switzerland: Swiss equities performed in line with the broader European market, benefiting from the Swiss National Bank’s decision to lower its inflation forecast for 2026.
Asia-Pacific: Divergence Amidst Policy Shifts
The Asia-Pacific region saw distinct winners and losers as the year closed.
Japan: Japanese equities faced headwinds in December. The yen strengthened sharply after the Bank of Japan (BOJ) executed a rate hike to 0.75%0.75% at their December meeting, fulfilling Governor Ueda’s prior hints. This pressured export-heavy indices, causing Japan to underperform relative to the US and Europe.
China: Chinese markets stabilized but continued to underperform global peers. While government stimulus announcements provided a floor for equity prices, the lack of concrete implementation details kept foreign investors cautious.
Australia & Canada: Both commodity-heavy markets lagged slightly behind the tech-driven rallies in the US, as oil prices softened due to projected surpluses for early 2026. However, the Reserve Bank of Australia (RBA) maintained a hawkish pause, supporting the banking sector.
North America: The "Santa Rally"
The U.S. equity market was the standout performer in December, significantly outpacing other G10 nations.
Federal Reserve Action: The catalyst was the Federal Reserve’s decision to cut the federal funds rate by 25 basis points, confirming market expectations. The "dot plot" release indicated a faster pace of easing for 2026 than previously forecast.
Sector Breadth: Unlike previous months characterized by narrow tech leadership, December saw broad participation. Small-caps and value sectors rallied alongside growth stocks, pushing major indices to fresh annual highs.
PMI Data: US Composite PMI data accelerated into expansion territory, contrasting with the slower stabilization seen in the Eurozone, further fueling capital flows into US dollar assets.
Conclusion
December 2025 concluded with a broad-based "risk-on" sentiment across global equities, marking a distinct shift from the fragmentation observed in November. A confirmed Fed pivot and robust economic data powered the US-led global performance. Japan served as the primary outlier, struggling with currency headwinds following the BOJ’s rate hike. Ultimately, the dovish monetary signaling from the Fed and the ECB provided the liquidity backdrop for a strong year-end close.
Holdings
Core: Developed Market Positions (approximately 65% of equity holdings)
Country
Australia
Canada
China
France
Germany
Japan
Switzerland
United Kingdom
Outlook
Underweight
Overweight
Underweight
Underweight
Underweight
Overweight
Overweight
Overweight
Explore: Emerging Market Positions (approximately 35% of equity holdings)
Singapore
Mexico
Hong Kong
New Zealand
Thailand
Position Details
Core: Developed Market Commentary
Approximately 65% of the strategy is allocated across eight of the largest markets in the ACWI ex-U.S. Index. The fund overweights and underweights the largest non-U.S. equity markets based on macro, fundamental, behavioral, and technical indicators.
Australia: Australian equities have improved relative to gold, which typically reflects demand for resource-linked exposure, and beta relative to global equities has stabilized, indicating reduced downside volatility. The absolute moving-average trend has turned positive, and relative earnings yield remains supportive, suggesting valuation is not stretched. Negative signals dominate the broader picture. Relative strength versus the adaptive moving average and the global technical scorecard remains weak, indicating persistent underperformance versus global peers. The interest-rate differential versus the U.S. continues to work against Australian equities, limiting capital inflows and pressuring relative returns. Bear-market bounce signals are neutral, offering no confirmation of a sustained reversal. Overall, while valuation and resource sensitivity offer some support, weak trend dynamics and unfavorable rate differentials leave Australia relatively unattractive on a risk-adjusted basis.
Commentary: The S&P/ASX 200 fluctuated around the mid-8600s range with modest gains on some days and mild pullbacks on others, reflecting a cautious macro backdrop and varied sector performance. Materials and mining stocks were prominent drivers at times, lifting the index on rising copper and other commodity prices, which supported heavyweight names such as BHP and Rio Tinto. Precious metal producers also benefited from strong metal prices. Broader economic data pointed to steady growth nearing 2%, while the Reserve Bank of Australia held rates on hold, underscoring a balancing act between inflation pressures and growth concerns. Other sectors, such as healthcare, consumer discretionary, and industrials, experienced softer demand patterns amid slower domestic activity and global headwinds. Technology and financials saw pockets of strength, with individual stocks like DroneShield attracting interest on contract wins and strategic shifts. Overall, the ASX in December reflected selective sector leadership amid cautious sentiment, influenced by commodity strength, macro signals, and policy direction.
Figure 1: A reversal in the interest rate differential would be negative for Australia.
Canada: Positive indicators dominate. Canada shows strong relative strength across multiple trend and momentum measures, including the diffusion index, mean reversion signal, absolute moving-average trend, and the global technical scorecard. Together, these suggest improving price action, broader participation, and a sustained recovery relative to international peers. The consistency across these signals points to a stable uptrend rather than a short-term bounce. Negative inputs are more macro-oriented. The composite leading indicator has softened, implying slower forward economic momentum, and the Canadian dollar has weakened against the U.S. dollar, which can reflect capital outflows and growth concerns. Relative earnings yield is less supportive, suggesting valuation is no longer a clear advantage. Even so, the strength in trend and breadth indicators currently outweighs macro and valuation headwinds, leaving Canada relatively attractive on a tactical, risk-adjusted basis.
Commentary: The resource-heavy TSX responded to commodity price movements, with energy and materials stocks reacting to softer global demand data. Oil and gas producers faced pressure from inventory builds and slower manufacturing activity overseas, which weighed on sector sentiment. Base metal miners also fluctuated with industrial metals pricing, impacting names like Teck Resources. Financials were influenced by steady interest rates, which kept lending margins under scrutiny and shaped bank share valuations. Consumer staples and utilities tracked broader demand indicators, with retail sales showing moderation. Technology and growth-oriented companies drew attention where earnings revisions improved, though volatility remained elevated. Housing and construction data influenced real estate-linked equities and REITs, with mixed signals on new starts and pricing. The Canadian dollar’s movement versus the U.S. dollar also affected corporate earnings translation, reinforcing cross-border competitiveness pressures. Overall, December’s market environment was shaped by commodity trends, stable interest rates, and mixed economic signals, driving sector-specific performance.
Figure 2: Canada appears to be mean reverting from oversold levels.
China: Positive indicators suggest improving macro and financial conditions. Relative performance has strengthened versus the emerging-market currency basket, indicating easing currency pressure and more stable capital flows. Credit conditions have also improved, with high-yield spreads tightening, which historically supports equity risk appetite and reduces financial stress. These signals point to a gradual stabilization in funding conditions and sentiment toward Chinese assets. Negative signals remain concentrated in price and growth dynamics. Relative momentum and trend indicators remain weak, suggesting the market has not yet established a sustained uptrend. The PMI signal is also negative, reflecting ongoing softness in manufacturing activity and domestic demand. Mean-reversion and bear-market bounce signals are neutral, suggesting limited confirmation of a durable reversal. Overall, while trend signals remain cautious, improving credit and currency conditions support a more constructive medium-term view.
Commentary: Major benchmarks such as the Shanghai Composite climbed modestly over the month and remained well above year-ago levels, supported by broader investor interest in technology and domestic policy support, even as earlier rallies cooled on weak data. Domestic macro indicators were uneven: retail sales and industrial production lagged expectations, reflecting ongoing weak consumer demand and investment, while factory activity expanded just above contraction levels as the official PMI rose above 50.0, partly driven by holiday stockpiling and easing trade tensions. Policymakers kept benchmark lending rates unchanged through December, signaling a cautious approach to support growth while monitoring financial stability. Structural challenges such as the prolonged property downturn and subdued household spending continued to pressure sentiment, limiting more substantial market advances. Nonetheless, signs of improved production activity, government policy efforts to boost investment, and renewed interest in high-tech sectors helped underpin China’s market in December.
Figure 3: Weaker PMIs illustrate headwinds for China’s economic activity.
France: The 200-day breadth signal is positive, indicating that a growing share of French equities is trading above long-term trend levels, which often precedes broader market stabilization. This suggests underlying participation is improving even if headline relative performance has not yet turned. Nonetheless, negative signals remain prevalent. The relative price trend and short-term momentum are weak, and the global technical scorecard continues to show underperformance relative to international peers. Valuation is not currently supportive on a relative basis; the dividend yield has not provided a cushion, and fund flows remain negative, indicating limited investor demand. The leading indicator signal is neutral, offering no clear macro support. Overall, while breadth improvement hints at early stabilization, weak trend, momentum, valuation, and flows still dominate, leaving France only cautiously attractive from a longer-term, contrarian perspective.
Commentary: The CAC 40 held around the 8,100–8,150 range by month-end, slightly softening in late trading as investors digested both domestic and external data. Manufacturing activity expanded, with the PMI rising above the 50 threshold and recording its fastest growth in over three years, led by export gains and strength in aerospace and advanced sectors. At the same time, broader private-sector growth was modest, with composite PMIs only marginally above stagnation levels, indicating services slowed. Unemployment remained elevated near 7.7%, and inflation was low, suggesting tepid domestic demand. Political and fiscal uncertainty around the 2026 budget also weighed on sentiment early in the month. Sector performance was varied: exporters and industrials benefited from the PMI improvement, while consumer and domestically oriented sectors faced pressure from weak consumption signals. Overall, France’s market in December was shaped by the contrast between external demand support and subdued domestic fundamentals.
Figure 4: Short-term price momentum indicates caution.
Germany: Positive indicators suggest an improving market structure. Breadth versus the 200-day moving average has strengthened, indicating broader participation across German equities. The relative moving-average trend has turned positive, and bear-market bounce signals confirm improving downside resilience. ETF fund flows have also turned supportive, suggesting renewed investor interest and incremental capital returning to the market. Negative inputs remain largely macro-driven. Manufacturing confidence is weak, reflecting ongoing softness in Germany’s industrial sector and export demand. Relative dividend yield is not providing valuation support, and the equity market remains sensitive to currency effects, with euro-dollar dynamics detracting from relative performance. The global technical scorecard remains negative, indicating that Germany continues to lag broader international markets. Overall, improving breadth, trend, and flows support a constructive tactical view, but macro and currency headwinds temper enthusiasm.
Commentary: German equities ended 2025 on a firm note, shaking off the lethargy that had plagued the market in November. The primary driver was a positive shift in the manufacturing narrative; unexpected gains in factory orders suggested the long-standing industrial slowdown had finally bottomed out. This data provided a critical floor for sentiment. The European Central Bank’s rate cut further fueled the move, specifically benefiting capital-intensive industries facing high borrowing costs. Corporate heavyweights were instrumental in this turnaround. Siemens AG saw renewed interest, lifting the broader industrial sector on improved guidance. Similarly, automotive giants like Volkswagen found stability as supply chain pressures eased, helping the consumer discretionary sector recover. SAP SE also contributed, keeping the technology sector buoyant. Investors essentially used December to reposition, pivoting from defensive posturing toward a potential cyclical recovery in early 2026.
Figure 5: German manufacturing confidence continues to roll over.
Japan: Positive indicators are broad and consistent. Japan shows strength across absolute and relative trend measures, with both moving-average signals and the global technical scorecard confirming sustained outperformance. Valuation remains supportive on a relative basis, and improving sentiment reversal signals suggest risk appetite is rebuilding. Relative performance versus China’s PMI is also positive, indicating Japan is benefiting from comparatively better regional growth dynamics. A weaker yen versus the dollar continues to support exporters and earnings translation, reinforcing relative equity performance. Negative inputs are limited. The primary concern is forward earnings growth, which has softened, reflecting cautious corporate guidance and slower global demand. This suggests that while market positioning and technicals are favorable, fundamental acceleration is not yet confirmed. Overall, strong trends, supportive valuation, improving sentiment, and currency tailwinds outweigh growth concerns, leaving Japan relatively attractive on both tactical and medium-term horizons.
Commentary: Japanese equities faced a challenging December, decoupling from the global rally due to a pivotal shift in monetary policy. The defining factor was the Bank of Japan’s rate hike, which triggered a sharp yen appreciation. This currency strength acted as a drag on the export-heavy index, forcing a revaluation of overseas earnings. Consequently, major exporters like Toyota Motor Corp saw prices soften as favorable exchange rates evaporated. In contrast, the banking sector capitalized on the environment. Institutions like Mitsubishi UFJ Financial Group attracted buying interest, driven by the prospect of wider net interest margins. Despite this specific strength, the broader market ended the month on its back foot, digesting the end of the ultra-loose monetary era.
Figure 6: The Japan DSI sentiment index reversed from pessimism and is now in the optimism zone. We’re monitoring closely for a negative reversal.
Switzerland: Positive indicators point to improving internal market structure. Breadth versus the 200-day average has strengthened, suggesting broader participation across Swiss equities. Shorter-term momentum and relative slope measures are also positive, indicating that relative performance is stabilizing and beginning to improve. Relative nominal yields are supportive, suggesting that Switzerland remains attractive relative to peers on a rate-adjusted basis. Fund flows are neutral, suggesting positioning is not crowded. Negative signals are limited but notable. The relative price trend remains weak, indicating that Switzerland has not yet established a clear leadership position. The dividend yield is also less supportive, reducing the appeal to income-oriented investors. Overall, improving breadth, momentum, and rate-adjusted support suggest stabilization, potential upside, and an increased allocation, even though trend confirmation and valuation support remain incomplete.
Commentary: Swiss equities participated in the broad European rally to close out 2025, largely mirroring the positive sentiment seen across the continent. A primary catalyst was the Swiss National Bank’s downward revision of inflation forecasts, which signaled a stable monetary environment for the year ahead. This clarity encouraged investors to maintain exposure to Swiss assets rather than seeking safety elsewhere. Heavyweights like Novartis and Roche provided their typical stability, acting as reliable anchors for the index. Simultaneously, UBS Group saw strength, capitalizing on increased global transaction activity and the general "risk-on" mood. While the defensive nature of the Swiss market meant it didn't match the explosive growth of the U.S. tech sector, it finished the year with a solid, steady advance.
Figure 7: Relative momentum picking up for Swiss equities.
United Kingdom: Positive indicators suggest selective support. Cross-sectional momentum has improved, indicating better relative performance among leading U.K. equities. The currency backdrop is supportive, with sterling weakness aiding export competitiveness and earnings translation. Sentiment reversals are positive, suggesting pessimism has begun to unwind. Credit conditions have also improved, with tighter spreads supporting risk appetite and financial stability. Negative signals remain in trend and valuation. The relative moving-average trend remains weak, indicating that the U.K. has not yet established sustained leadership over global peers. Valuation is not currently attractive relative to peers, reducing the appeal for long-term allocators. Overall, improving momentum, sentiment, currency support, and credit conditions point to stabilization and tactical opportunity, even as longer-term trend and valuation signals have yet to confirm a durable shift. We are modestly increasing exposure.
Commentary: The UK stock market rebounded in December 2025, reversing its earlier struggles to end the year on a positive footing. A key factor was the Bank of England’s decision to hold rates steady while signaling a dovish pivot for early 2026. This relieved investor anxiety about persistent tightening, providing much-needed clarity for domestic businesses. Energy and mining giants played a significant role in this recovery. Shell and BP found support as global energy demand forecasts stabilized, countering earlier weakness. Meanwhile, retailers like Tesco saw improved sentiment, buoyed by hopes that easing inflation would spur holiday spending. Financials also contributed, with HSBC and Barclays benefiting from the stabilized economic outlook, helping the broader index regain momentum lost in November.
Figure 8: Sentiment improving around U.K. equities.
Emerging Market Positions
Approximately 30% of the strategy is allocated across five markets from a pool of more than 20 smaller markets. Selection is based on a multifactor technical ranking system that uses trend and mean-reversion indicators. The process seeks to identify oversold opportunities within the global equity markets that are likely to mean-revert from lower levels and exhibit mild pullbacks from long-term uptrends.
Current Holdings:
Singapore
Mexico
Hong Kong
New Zealand
Thailand
Explore: Emerging Market Commentary
Singapore: Singapore’s economy demonstrated relative strength in 2025, supported by strong external demand and robust services activity. Third-quarter GDP expanded notably, prompting authorities to raise the 2025 growth forecast, though headwinds from global trade tensions and U.S. tariffs on key exports remain a concern. The Monetary Authority of Singapore maintained policy settings through late 2025, reflecting balanced risks between sustaining growth and containing inflationary pressures. Looking to 2026, Singapore’s highly open trade-dependent economy could outperform if global demand, particularly for technology and logistics services, strengthens and trade frictions ease. Continued investment in high-value sectors and its role as a regional hub could further support momentum.
Mexico: Mexico’s macro picture has been challenging. Inflation drifted higher in late 2025, and economic growth remained subdued around modest rates, with unemployment steady yet not elevated. Policy shifts, including tariff increases on select imports, reflect domestic efforts to protect key industries but risk higher costs and external tensions. For 2026, structural reforms that improve investor confidence and stronger domestic demand could bolster growth. Improved trade diversification and investment in manufacturing and export sectors may also support outperformance relative to peers.
Hong Kong: Hong Kong continued to expand, with modest quarter-on-quarter growth and stable labor markets. Residential property prices rose for several months, aided by interest rate cuts aligned with U.S. policy and supportive measures to ease borrowing. For 2026, continued monetary easing and a recovery in global trade could underpin performance, especially if tourism and services rebound further.
New Zealand: New Zealand’s economy exhibited signs of recovery following earlier contractions, with gradual improvements in activity indicators. Monetary easing by the Reserve Bank has aimed to support growth and ease inflation. Prospects for 2026 hinge on durable domestic demand, tourism recovery, and stable inflation.
Thailand: Thailand’s economy showed late-2025 strength, driven by rising exports and investment growth, which offset weak private consumption. Currency appreciation poses competitive pressures, but if export diversification and tourism rebound in 2026, growth could outpace regional peers.
Catastrophic Stop Model
The Catastrophic Stop model combines time-tested, objective indicators designed to identify high-risk periods for the equity market. The model entered January recommending a fully invested equity allocation relative to the benchmark.
The weight of the evidence suggests that any weakness is unlikely to extend into a significant downtrend at this time. Of course, if our model triggers a sell signal (below 40% for two consecutive days), indicating more substantial problems, we will raise cash immediately.
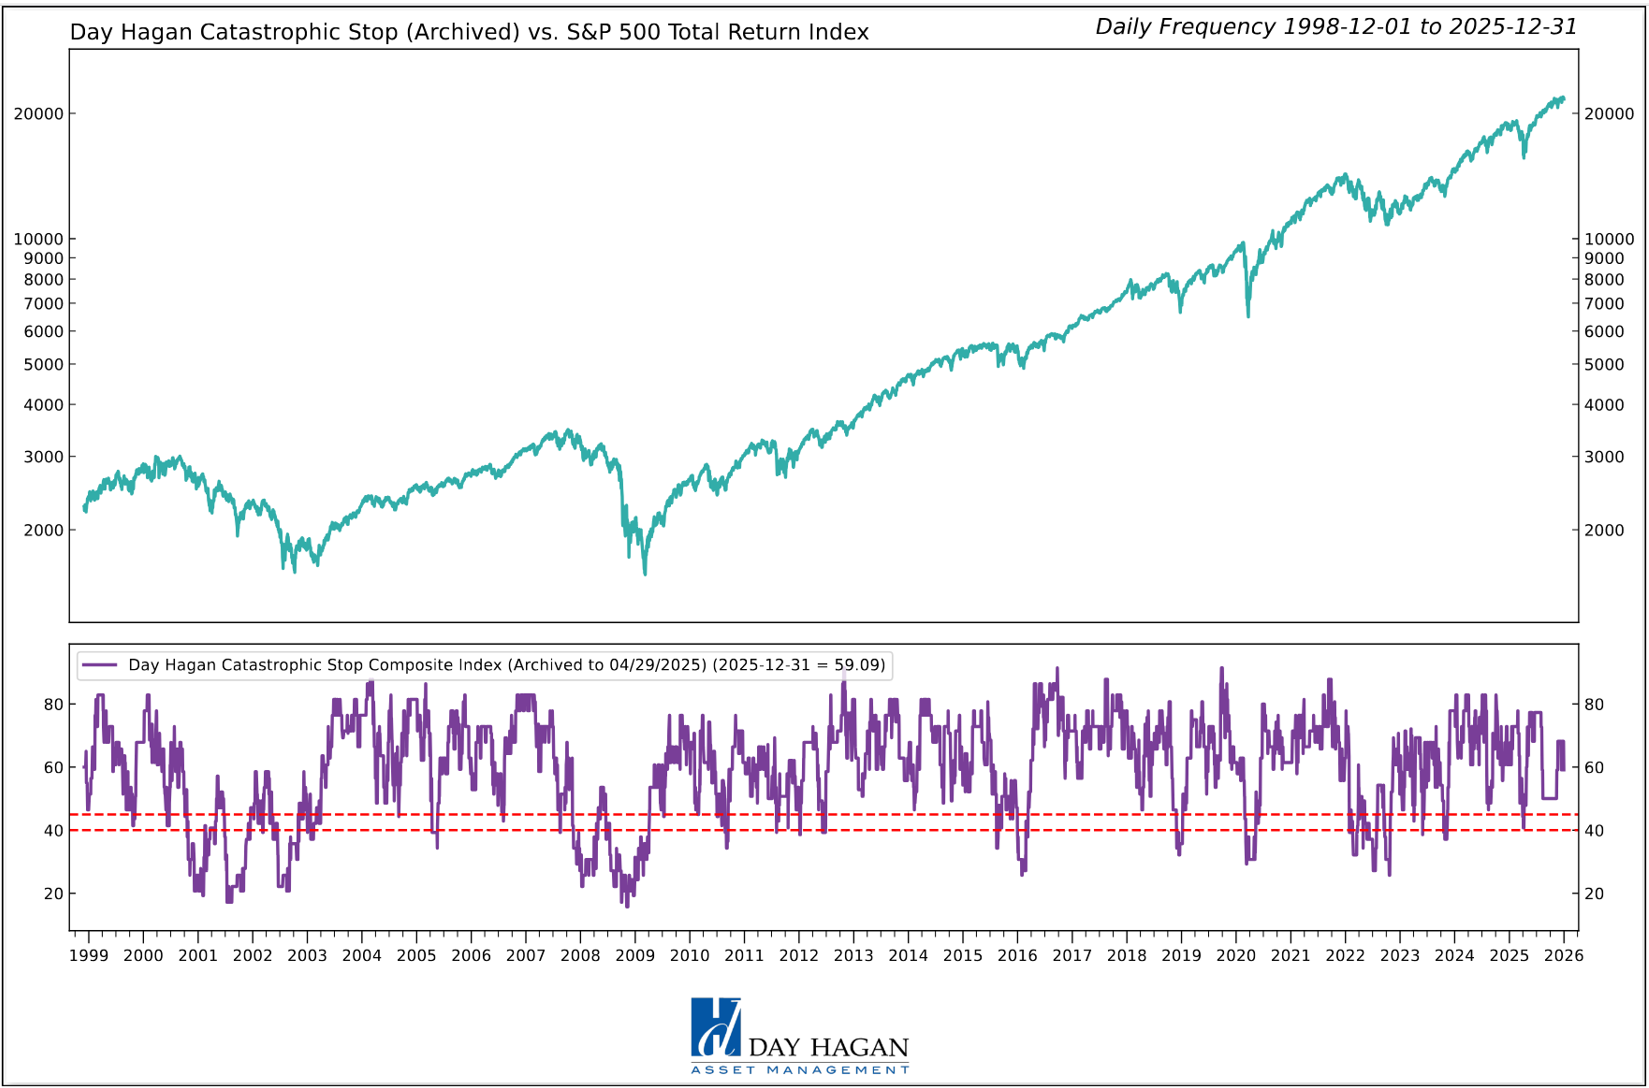
Figure 9: The Catastrophic Stop model recommends a fully invested equity position (relative to the benchmark). Because the model uses indices to extend its history, it is considered hypothetical.
The Day Hagan Daily Market Sentiment Composite (part of the Catastrophic Stop Model) remains in the “Excessive Pessimism” zone, reflecting a notable rise in investor caution. Sentiment remains excessively pessimistic based on our short-term model. This is viewed as a net positive from a contrary opinion perspective.
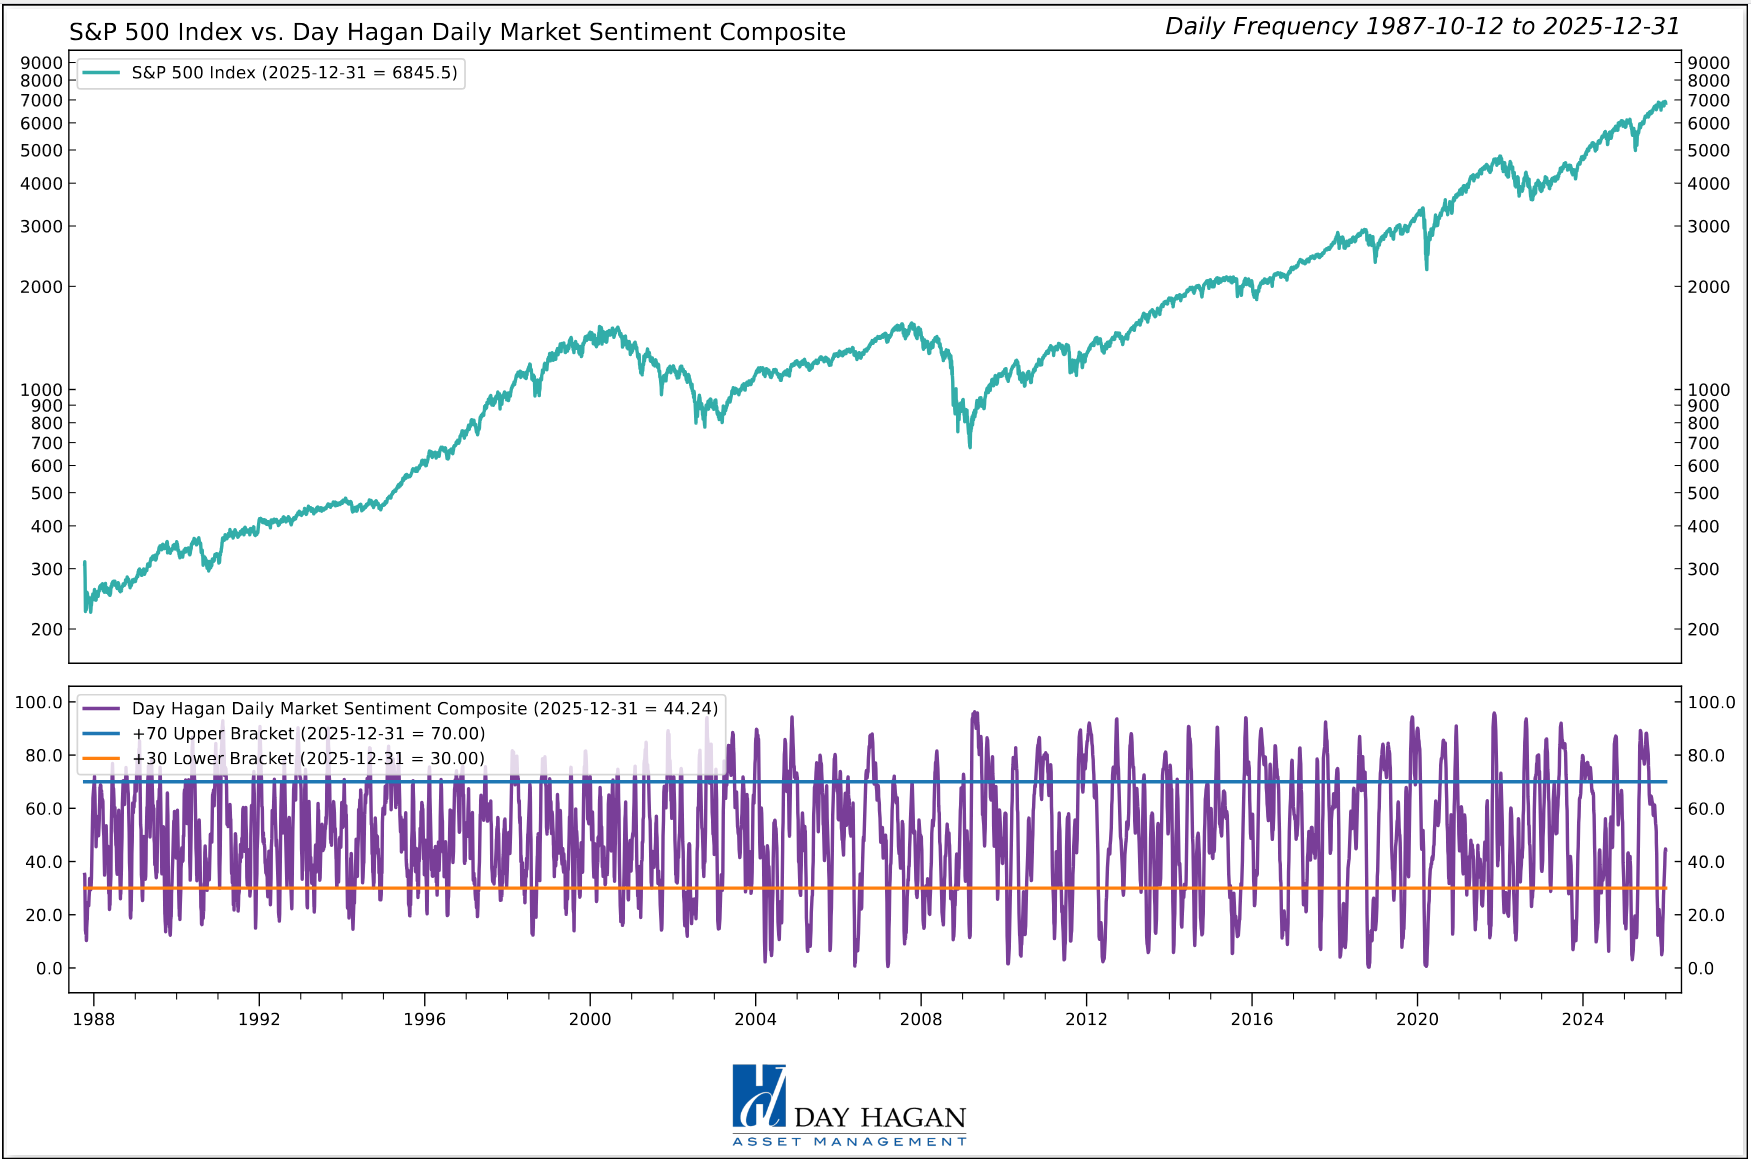
Figure 10: Investor sentiment is being reset, as illustrated by the DH Daily Market Sentiment Composite declining below 70. A reversal back above 30% would enhance the potential for a rally.
This strategy utilizes measures of price, valuation, economic trends, monetary liquidity, and market sentiment to make objective, rational, and unemotional decisions about how much capital to place at risk and where to allocate that capital.
For more information, please contact us at:
Day Hagan Asset Management
1000 S. Tamiami Trl
Sarasota, FL 34236
Toll Free: (800) 594-7930
Office Phone: (941) 330-1702
Website: https://dayhagan.com or https://dhfunds.com
© 2026 Day Hagan Asset Management
This material is for educational purposes only. Further distribution is prohibited without prior permission. Please see the information on Disclosures and Fact Sheets here: https://dhfunds.com/literature. Charts with models and return information use indices for performance testing to extend the model histories, and they should be considered hypothetical. All Rights Reserved. (© Copyright 2026 Day Hagan Asset Management.)
Day Hagan Smart Sector® International ETF
Symbol: SSXU
Strategy Description
The Smart Sector® International strategy combines three quantitative investment strategies: Core International, Explore International, and Catastrophic Stop.
The Process Is Based On The Weight Of The Evidence
Core Allocation
The fund begins by overweighting and underweighting the largest non-U.S. equity markets based on proprietary models.
Each of the models utilizes market-specific, weight-of-the-evidence composites of fundamental, economic, technical, and behavioral indicators to determine each area’s probability of outperforming the ACWI, for example. U.S. Markets are weighted accordingly relative to benchmark weightings.
Explore Allocation
To select smaller markets, the fund uses a multi-factor technical ranking system to choose the top markets. The markets with the highest rankings split the non-core model allocation equally.
When Market Risks Become Extraordinarily High — Reduce Your Portfolio Risk
The model remains fully invested unless the Catastrophic model is triggered, whereupon the equity-invested position may be trimmed by up to 50%.
The Catastrophic Stop model combines time-tested, objective indicators designed to identify periods of high risk for the broad U.S. equity market. The model uses price-based, breadth, deviation from trend, fundamental, economic, interest rate, behavioral, and volatility-based indicator composites.
When Market Risks Return To Normal — Put Your Money Back To Work
When the Catastrophic Stop model moves back to bullish levels, indicating lower risk, the strategy will reverse toward being fully invested.
Disclosures
The data and analysis contained within are provided “as is” and without warranty of any kind, either express or implied. The information is based on data believed to be reliable, but it is not guaranteed. Day Hagan DISCLAIMS ANY AND ALL EXPRESS OR IMPLIED WARRANTIES, INCLUDING, BUT NOT LIMITED TO, ANY WARRANTIES OF MERCHANTABILITY, SUITABILITY, OR FITNESS FOR A PARTICULAR PURPOSE OR USE. All performance measures do not reflect tax consequences, execution, commissions, and other trading costs, and as such, investors should consult their tax advisors before making investment decisions, as well as realize that the past performance and results of the model are not a guarantee of future results. The Smart Sector® Strategy is not intended to be the primary basis for investment decisions, and the usage of the model does not address the suitability of any particular investment for any particular investor.
Using any graph, chart, formula, model, or other device to assist in deciding which securities to trade or when to trade them presents many difficulties, and their effectiveness has significant limitations, including that prior patterns may not repeat themselves continuously or on any particular occasion. In addition, market participants using such devices can impact the market in a way that changes the effectiveness of such devices. Day Hagan believes no individual graph, chart, formula, model, or other device should be used as the sole basis for any investment decision and suggests that all market participants consider differing viewpoints and use a weight-of-the-evidence approach that fits their investment needs.
Past performance does not guarantee future results. No current or prospective client should assume future performance of any specific investment or strategy will be profitable or equal to past performance levels. All investment strategies have the potential for profit or loss. Changes in investment strategies, contributions or withdrawals, and economic conditions may materially alter the performance of your portfolio. Different types of investments involve varying degrees of risk, and there can be no assurance that any specific investment or strategy will be suitable or profitable for a client’s portfolio. Historical performance results for investment indexes and/or categories generally do not reflect the deduction of transaction and/or custodial charges or the deduction of an investment management fee, the incurrence of which would have the effect of decreasing historical performance results. There can be no assurances that a portfolio will match or outperform any particular benchmark. Comparisons to indices are inherently unreliable indicators of future performance. The strategies used to generate the performance vary from those used to generate the returns depicted in the benchmarks. Investors cannot directly invest in an index.
The information contained herein is provided for informational purposes only and should not be construed as investment advice or a recommendation to buy or sell any security. The securities, instruments, or strategies described may not be suitable for all investors, and their value and income may fluctuate. Past performance is not indicative of future results, and there is no guarantee that any investment strategy will achieve its objectives, generate profits, or avoid losses.
This material is intended to provide general market commentary and should not be relied upon as individualized investment advice. Investors should consult with their financial professional before making any investment decisions based on this information.
The material may contain “forward-looking” information that is not purely historical in nature. Such information may include, among other things, projections, forecasts, estimates of market returns, and proposed or expected portfolio composition. Day Hagan Asset Management, its affiliates, employees, or third-party data providers shall not be liable for any loss sustained by any person relying on this information. All opinions and views expressed are subject to change without notice and may differ from those of other investment professionals within Day Hagan Asset Management or Ashton Thomas Private Wealth, LLC.
Accounts managed by Day Hagan Asset Management or its affiliates may hold positions in the securities discussed and may trade such securities without notice.
Day Hagan Asset Management is a division of and doing business as (DBA) Ashton Thomas Private Wealth, LLC, an SEC-registered investment adviser. Registration with the SEC does not imply a certain level of skill or training.
There is no guarantee that any investment strategy will achieve its objectives, generate dividends, or avoid losses.
This material is for educational purposes only. Further distribution is prohibited without prior permission. Please see the information on Disclosures and Fact Sheets here: https://dhfunds.com/literature. Charts with models and return information use indices for performance testing to extend the model histories, and they should be considered hypothetical. All Rights Reserved. (© Copyright 2026 Day Hagan Asset Management.)
All hypothetical results are presented for illustrative purposes only. Back-testing and other statistical analysis is provided in use simulated analysis and hypothetical circumstances to estimate how it may have performed prior to its actual existence. The results obtained from "back-testing" information should not be considered indicative of the actual results that might be obtained from an investment or participation in a financial instrument or transaction referencing the Index. The Firm provides no assurance or guarantee that the products/securities linked to the strategy will operate or would have operated in the past in a manner consistent with these materials. The hypothetical historical levels have inherent limitations. Alternative simulations, techniques, modeling or assumptions might produce significantly different results and prove to be more appropriate. Actual results will vary, perhaps materially, from the simulated returns presented.
© 2026 Day Hagan Asset Management