
Day Hagan Smart Sector® International Strategy Update September 2026
A downloadable PDF copy of the Article:
Day Hagan Smart Sector® International Strategy Update September 2026 (pdf)
Executive Summary
August rewarded international markets that could turn a broad theme into visible earnings. Semiconductor foundries, memory producers, automation companies, and the infrastructure behind artificial intelligence generally outperformed, while expensive or economically sensitive markets without comparable earnings confirmation tended to lag. The distinction matters: this is no longer a market in which a good macro story is enough. Investors are asking which countries are converting investment, exports, and pricing power into cash flow.
That question produced several meaningful changes in the model. The United Kingdom and Taiwan move to overweight. Japan, India, and the Netherlands move to neutral. Switzerland moves to underweight. Australia, China, and South Korea remain overweight, while Canada, France, and Germany remain underweight. The positioning is deliberately mixed across regions because the model is responding to country-level evidence rather than making a single call on Europe or Asia.
Asia still supplies the clearest earnings momentum, but the opportunity has broadened. South Korea's export surge and the cash generation of its memory leaders continue to support an overweight. Taiwan's semiconductor cycle now has stronger confirmation from trend, mean reversion, the global technical scorecard, and valuation signals, earning an overweight despite concentration and geopolitical risk. China remains overweight as six of seven indicators are constructive and August factory data improved, even though domestic services and property remain soft.
Japan and India move to neutral for different reasons. Japan's price trend remains healthy, but forward-earnings, sentiment, China sensitivity, and currency indicators are bearish; weak household spending and a still-fragile yen argue against adding risk after a strong run. India retains attractive long-term growth, but expensive equities, imported-energy exposure, and weaker technical and earnings signals offset a late-month improvement in the rupee. Neutral preserves participation without treating structural growth as a substitute for entry discipline.
Europe's economic pulse improved, but the policy backdrop became less forgiving. Euro-area manufacturing expanded at its fastest pace in more than four years, led by a sharp acceleration in Germany and a return to modest growth in France. At the same time, euro-area inflation rose to 3.3% in August, largely because of energy, after the European Central Bank had already raised its deposit rate to 2.25% in June and held it there in July. The U.K. earns an overweight because valuation, price momentum, and sterling now offset weak construction and tight financing conditions. France and Germany remain underweight, the Netherlands moves to neutral, and Switzerland moves to underweight.
Currency provided an important second source of confirmation. The U.S. dollar declined for a second consecutive month, while the euro and pound strengthened. The yen recovered during August but remained vulnerable enough to keep intervention and additional Bank of Japan tightening in play. The South Korean won strengthened alongside exports and back-to-back rate increases. The Australian and Canadian dollars also firmed, while the yuan's appreciation prompted Chinese authorities to lean against a move that could challenge exporters. Currency can reinforce an equity thesis, but it can also expose where policy and earnings are pulling in opposite directions.
Central banks are no longer moving as a group. The Reserve Bank of Australia held at 4.35% after raising rates earlier this year; the Bank of Korea raised its base rate to 3.00%; and the Philippine central bank lifted its policy rate to 5.00% as inflation remained above its comfort range. The Bank of Canada held at 2.25%, the Bank of Japan held at 1.00%, and the People's Bank of China kept benchmark lending rates unchanged. Israel moved the other way, cutting to 3.25% on September 1 as inflation stayed contained. For equity investors, that dispersion changes bank margins, domestic demand, valuation, and currency translation at the same time.
The portfolio therefore enters September with a practical barbell: AI and advanced-manufacturing exposure through South Korea, Taiwan, China, Japan, Germany, and the Netherlands; and real-asset, financial, healthcare, and defense exposure through Australia, the U.K., Chile, Israel, and Italy. The Explore sleeve rotates into the Philippines, Thailand, and Italy while retaining Chile and Israel. Risks remain substantial, including energy-led inflation, high semiconductor expectations, geopolitical events, tariffs, and the possibility that tighter policy slows demand faster than earnings estimates adjust. Positioning and indicator readings are as of September 4, 2026. Company references are illustrative of country conditions and are not security recommendations.
Holdings
Core: Developed Market Positions (approximately 85% of equity holdings)
Country
Australia
Canada
China
France
Germany
India
Japan
Netherlands
South Korea
Switzerland
Taiwan
United Kingdom
Outlook
Overweight
Underweight
Overweight
Underweight
Underweight
Neutral
Neutral
Neutral
Overweight
Underweight
Overweight
Overweight
Explore: Emerging Market Positions (approximately 15% of equity holdings)
Philippines
Chile
Israel
Thailand
Italy
Position Details
Core: Developed Market Commentary
Approximately 85% of the strategy is allocated across 12 large, liquid non-U.S. equity markets. The fund overweights and underweights these markets based on macro, fundamental, behavioral, currency, and technical indicators. The discussion below reflects information available through September 4, 2026.
AUSTRALIA — OVERWEIGHT
Australia remains overweight because its earnings mix is unusually well suited to a market balancing heavy infrastructure investment against persistent inflation. BHP's full-year underlying profit rose 30% to $13.2 billion, with copper operating earnings surpassing iron ore, while Commonwealth Bank reported record annual profit. Those results point to two distinct sources of cash flow—globally priced resources and a profitable banking system—without requiring a broad acceleration in household spending.
The Reserve Bank of Australia held the cash rate at 4.35% in August after 75 basis points of tightening this year. The Board described policy as somewhat restrictive and kept further action on the table because inflation remains above target. That stance is a headwind for mortgages, housing turnover, and discretionary demand; CBA's 15% decline in mortgage applications is a useful reminder that record bank earnings do not mean the domestic cycle is easy.
The Australian dollar strengthened against the U.S. dollar during August, adding currency support for dollar-based investors. A firmer currency can reduce imported inflation, but it can also temper the translated value of offshore revenue. The portfolio therefore emphasizes miners, copper, gold, energy infrastructure, and well-capitalized financials rather than highly leveraged consumers.
Five of eight indicators are bullish. Relative strength versus its adaptive and absolute moving averages, gold, beta, and relative earnings yield support the overweight. The Australia-U.S. interest-rate differential and ACWI technical scorecard are bearish, while the bear-market-bounce signal is neutral. The constructive signals justify the country weight; the rate-sensitive warnings shape what we prefer to avoid within it.
Figure 1: Resource earnings, currency support, and improving trend outweigh Australia's rate-sensitive risks.
CANADA — UNDERWEIGHT
Canada remains underweight despite better price behavior and encouraging bank results. RBC, TD, CIBC, BMO, and Scotiabank all exceeded quarterly profit expectations, helped by capital markets, wealth management, and resilient credit. Energy, pipelines, gold, engineering, and digital commerce also provide useful exposures. The issue is not a shortage of investable companies; it is that the country-level signal has not fully confirmed the opportunity.
The Bank of Canada held its overnight rate at 2.25% on September 2. August data then delivered a split message: the Ivey PMI reached its strongest level in more than four years, while employment fell by 41,700 and full-time jobs accounted for most of the decline. A stronger Canadian dollar during August helped U.S.-dollar translation, but slower wage growth and trade friction with the United States leave the domestic credit cycle exposed.
The bank results reduce near-term credit concerns, and higher energy prices can support producer cash flow. At the same time, strong capital-markets revenue is cyclical, and a housing-heavy financial system remains sensitive to employment and refinancing costs. The underweight keeps selective exposure to banks, energy, pipelines, gold, and growth franchises without assuming that one strong earnings season settles the macro debate.
Four of seven indicators are bullish: triple-moving-average diffusion, the absolute moving-average cross, the ACWI technical scorecard, and the Canadian-dollar signal. Mean reversion, the OECD leading indicator, and relative earnings yield remain bearish. That improving but incomplete mix supports patience rather than a larger country weight.
Figure 2: Better bank earnings and currency behavior have not yet overcome Canada's leading and valuation signals.
CHINA — OVERWEIGHT
China remains overweight because the market's evidence has become broader than a simple rebound from low valuation. Six of seven indicators are bullish, and August manufacturing improved: the official factory PMI rose to 49.8, still just below expansion, while the RatingDog survey advanced to 51.5 and reported the strongest increase in export orders in six months. Services remained weak, underscoring that the opportunity is concentrated in exports, industrial upgrading, and technology rather than a full domestic recovery.
The People's Bank of China kept the one-year and five-year loan prime rates at 3.00% and 3.50% in August. The yuan continued a long appreciation, but authorities began leaning against further gains to protect exporter competitiveness. That is a constructive currency signal with an important limit: policymakers want stability, not an unchecked rally.
Corporate reports point to better operating discipline. Tencent's second-quarter revenue rose 11% as artificial intelligence improved advertising, although profit missed expectations. Meituan returned to adjusted profit after a first-quarter loss as price competition eased. Together with batteries, energy storage, robotics, industrial software, and domestic chip development, these reports support a selective earnings-recovery thesis while property and consumer confidence remain unresolved.
Relative price momentum, the absolute moving-average cross, bear-market-bounce behavior, PMI, the emerging-market currency basket, and high-yield credit spreads are bullish; mean reversion is the lone bearish reading. The overweight reflects unusually broad model confirmation, not a conclusion that China's structural risks have disappeared.
Figure 3: Broad market confirmation and a firmer yuan support China's selective earnings recovery.
FRANCE — UNDERWEIGHT
France remains underweight even as the factory cycle begins to stir. The August manufacturing PMI rose to 51.1 from 49.8, its first expansionary reading in several months. The detail was less convincing than the headline: output improved, but new orders declined and business confidence weakened. France still offers world-class exposure to aerospace, defense, luxury, healthcare, payments, and financial services; the domestic demand signal is not yet broad enough to carry the index.
Inflation increased to 2.7% in August as the euro-area rate reached 3.3%. The ECB held its deposit rate at 2.25% in July after raising it in June, leaving households and businesses with tighter financing just as energy costs rose. The euro strengthened for a second month, supporting U.S.-dollar returns but creating a translation headwind for exporters.
Breadth, the ACWI technical scorecard, 50-day momentum, and valuation are bullish. The moving-average cross, OECD leading indicator, and relative dividend yield are bearish, while fund flows are neutral. That balanced set is not enough to overturn the underweight because the policy and order backdrop still place a higher burden on company execution.
Figure 4: France's factory headline improved, but orders, policy, and leading signals still argue for underweight.
GERMANY — UNDERWEIGHT
Germany remains underweight, although August delivered the strongest challenge yet to that view. The manufacturing PMI rose to 54.3, its best reading in more than four years, as new orders accelerated and production posted its strongest growth since early 2022. Infrastructure, defense, grid investment, automation, and data-center demand are beginning to show up in corporate order books.
Siemens reported record quarterly industrial profit, with orders rising 13% as demand for data centers, factory automation, and electronics manufacturing increased. The report shows why Germany should not be treated as a simple auto-export story. Yet inflation rose to 2.9% in August, the euro strengthened, and energy-intensive producers still face a difficult cost base. Automakers with heavy China exposure remain more challenged than electrification and industrial-technology suppliers.
Breadth, bear-market-bounce behavior, and the relative moving-average cross are bullish. The ACWI technical scorecard, relative dividend yield, fund flows, manufacturing-confidence signal, and euro relationship are bearish. The model therefore waits for the better survey data to produce broader flows and relative earnings confirmation before increasing the country weight.
Figure 5: Germany’s factory data are improving, but orders and earnings breadth still need to follow.
INDIA — NEUTRAL
India moves to neutral, balancing exceptional long-term growth potential against a less supportive near-term signal set. August manufacturing slowed to 52.9, its weakest pace in five years, while services improved to 54.1 and hiring reached a 15-month high. Infrastructure, formalization, digital payments, bank penetration, and rising household income remain durable themes, but the market still asks investors to pay a premium for them.
The Reserve Bank of India kept the repo rate at 5.25% in August and retained a neutral stance. The rupee stabilized late in the month as special deposit programs and intervention helped lift foreign-exchange reserves to a record $740.8 billion. That larger buffer reduces immediate currency stress, but it does not remove India's exposure to imported oil, higher freight costs, and pressure on the current account.
The neutral weight maintains exposure to lenders, capital goods, logistics, digital platforms, and technology services while recognizing that weaker factory momentum and margin pressure can make earnings forecasts vulnerable. The shift is an improvement from underweight, not an all-clear on valuation or energy sensitivity.
Mean reversion and the OECD leading indicator are bullish. The ACWI technical scorecard, rupee, crude-oil relationship, and forward-earnings growth are bearish, while the absolute trend and gold signals are neutral. With only two of eight readings bullish, neutral is a measured compromise between structural quality and near-term evidence.
Figure 6: India moves to neutral as currency reserves improve, but oil, earnings, and technical risks remain.
NETHERLANDS — NEUTRAL
The Netherlands moves to neutral because every model indicator is now bullish. Absolute and relative trend, mean reversion, the ACWI technical scorecard, semiconductors, the euro, forward earnings, and the OECD leading indicator all support the market. That breadth deserves recognition even though the country index remains concentrated and carries a premium valuation.
The earnings story extends beyond ASML. Adyen raised its 2026 net-revenue growth outlook after acquisitions broadened its platform, while ASML's July report increased its annual forecast and outlined additional capacity for leading-edge lithography. These companies sit at two scarce points in global commerce: advanced chip production and high-quality payments infrastructure.
The euro's second consecutive monthly gain adds currency support for U.S. investors, but the ECB's 2.25% deposit rate and August inflation of 3.3% increase the odds that financing stays restrictive. Neutral captures unusually strong market confirmation while respecting valuation, semiconductor concentration, and the possibility that capital-spending expectations are already demanding.
Figure 7: All seven Dutch indicators are bullish; valuation and concentration keep the position at neutral.
SOUTH KOREA — OVERWEIGHT
South Korea remains overweight as August exports rose 68.7% from a year earlier to $98.3 billion, extending the expansion to a fifteenth month. The scale of the increase reflects unusually strong demand for memory, servers, and other technology used in artificial-intelligence infrastructure. The country index also offers autos, shipbuilding, defense, batteries, and financials, but semiconductors remain the principal earnings engine.
Samsung Electronics and SK Hynix are expected to hold a combined $263 billion in net cash by year-end, creating room for capital investment, shareholder returns, and balance-sheet resilience. That cash generation is attractive, but it also raises expectations. U.S. tariff discussions and customer concentration could quickly affect sentiment even when demand remains strong.
The Bank of Korea raised its base rate for a second consecutive meeting in August, to 3.00%, as growth and inflation exceeded expectations. The won strengthened sharply during the month, helped by export receipts and a more hawkish policy stance. For a dollar-based investor, that currency move validates the equity thesis, although higher domestic rates can restrain consumers and smaller companies.
The absolute moving-average cross, mean reversion, crude relationship, and OECD leading indicator are bullish. The ACWI technical scorecard and forward-earnings signal are bearish, while the won indicator is neutral. The overweight remains focused on companies turning the AI cycle into cash flow, with position sizing mindful of concentration and elevated expectations.
Figure 8: Export momentum, cash generation, and a firmer won support Korea despite higher rates and expectations.
TAIWAN — OVERWEIGHT
Taiwan moves to overweight as the model now confirms what company results have been signaling: the AI hardware cycle is translating into sustained earnings. TSMC's July revenue extended strong year-over-year growth after a record second quarter, and the central bank sharply raised its 2026 growth forecast as advanced-technology exports and private investment accelerated. The country remains the most direct public-market exposure to leading-edge foundry capacity and semiconductor packaging.
The Taiwan dollar strengthened during August and ended September 4 near NT$31.63 per U.S. dollar. That improvement helps dollar-based returns and lowers imported costs, although the model's currency indicator remains bearish on a longer comparison. Taiwan's central bank has kept policy settings steady and is monitoring the interaction of AI investment, external demand, and geopolitical risk.
The investment case still carries an unusually high concentration burden. TSMC and the semiconductor complex dominate the index, customers are spending at exceptional rates, and the market remains exposed to export controls, power availability, capacity execution, and cross-strait tensions. An overweight recognizes improving confirmation; it does not assume that the chip cycle or geopolitics have become predictable.
The absolute moving-average cross, mean reversion, ACWI technical scorecard, semiconductor relationship, and valuation signal are bullish. China PMI and the Taiwan-dollar indicator are bearish. With five of seven readings constructive, the model supports an overweight while retaining explicit limits around concentration and event risk.
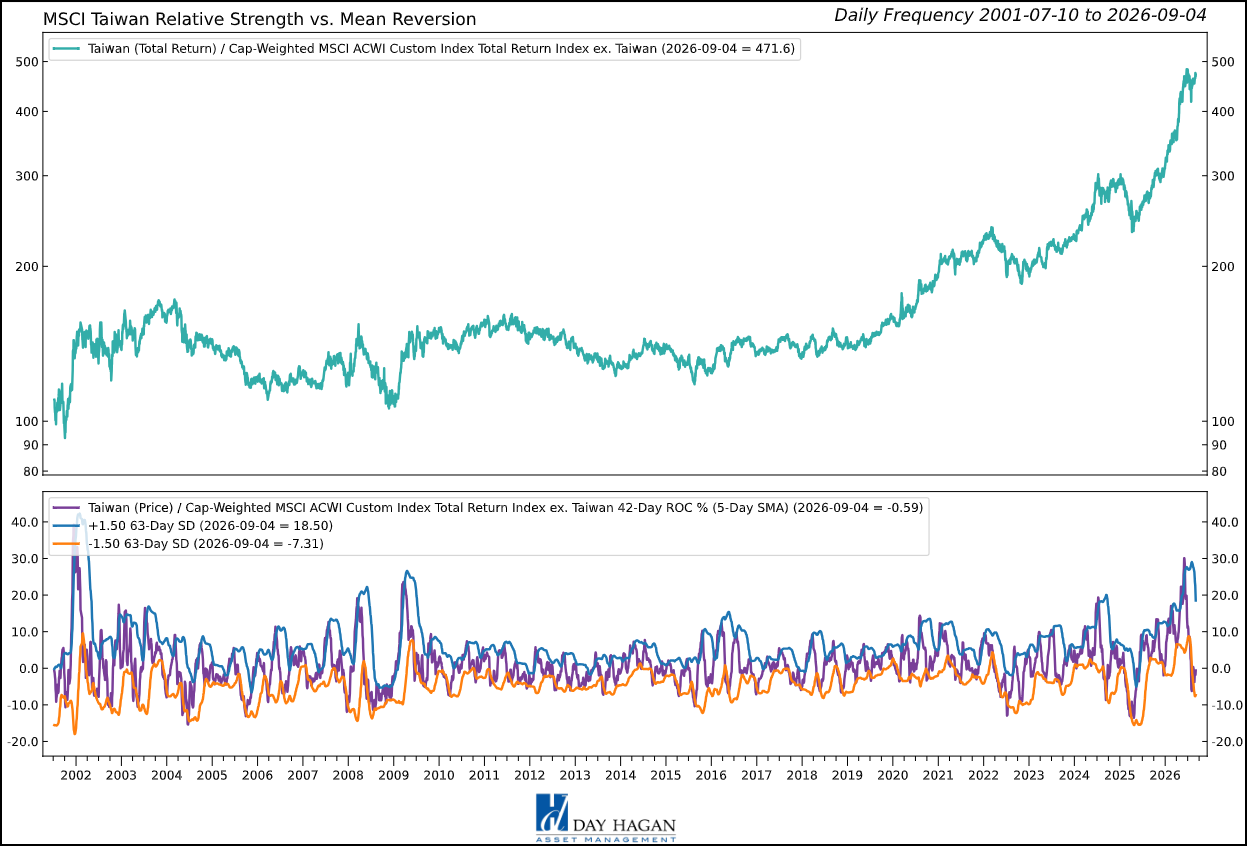
Figure 9: Five of seven Taiwan indicators are bullish, moving the market to overweight despite concentration risk.
JAPAN — NEUTRAL
Japan moves to neutral because a broad corporate-improvement story now meets an equally broad set of macro and market cautions. Banks, automation, factory equipment, entertainment, sensors, and governance reform continue to create opportunities. Mitsubishi UFJ's latest profit increased sharply as loan and fee income grew, while Sony benefited from games, music, image sensors, and cost control. The country is more than a weak-yen export trade.
The Bank of Japan held its policy rate at 1.00% in July but acknowledged greater upside inflation risk. The yen strengthened during August, helped by official intervention and expectations of further tightening, yet it remained weak enough for authorities to repeat that excessive moves would not be tolerated. Japan's 10-year yield reaching 3% also raises the cost of the government's large fiscal ambitions.
Household spending fell 3.6% from a year earlier in July, the eighth consecutive decline, showing that higher wages have not fully restored purchasing power. Weak consumption, higher energy import costs, and rising bond yields argue for more selectivity, even as government budget requests emphasize AI, semiconductors, defense, and economic security.
The absolute and relative moving-average crosses, ACWI technical scorecard, and valuation signal are bullish. China PMI, forward earnings, sentiment reversal, and the yen signal are bearish. A four-to-four split is a clear case for neutral: retain exposure to banks, automation, semiconductors, and governance reform, but do not rely on currency weakness or fiscal spending to carry the whole market.
Figure 10: Japan's corporate reform remains compelling, but household, earnings, and currency signals balance the case.
SWITZERLAND — UNDERWEIGHT
Switzerland moves to underweight. The country still offers enviable quality—healthcare, staples, industrial technology, wealth management, and global brands—but quality can become a crowded defensive position when trend and income signals deteriorate. Nestlé's agreement to sell mainstream vitamin brands for $1 billion shows a sharper focus under new management, while the debate over UBS capital requirements adds a separate regulatory uncertainty to the country's largest financial franchise.
The Swiss National Bank held its policy rate at 0% in June and signaled a greater willingness to intervene against rapid franc appreciation. Inflation remains low, leaving the SNB more flexibility than most peers. The franc was slightly firmer against the dollar in August, helpful for U.S. investors but challenging for exporters and a reason policymakers remain attentive to the currency.
Defensive earnings and a strong currency can still be valuable if global growth slows. The counterweight is valuation: investors are paying for stability at a time when policy is already near its lower bound and several peers offer stronger earnings momentum. The underweight is a relative allocation decision, not a negative judgment on Swiss corporate quality.
The 50-day momentum, moving-average slope, and relative 10-year-yield signals are bullish. The moving-average cross, 200-day breadth, and relative dividend yield are bearish, while fund flows are neutral. The evenly divided framework, paired with a premium defensive profile, now supports an underweight.
Figure 11: Swiss quality remains intact, but breadth, dividend yield, and valuation provide limited margin for error.
UNITED KINGDOM — OVERWEIGHT
The United Kingdom moves to overweight because valuation, price momentum, and sterling now offset a still-difficult domestic rate environment. The market offers global energy, banks, defense, miners, healthcare, consumer brands, and substantial dividend income at a lower valuation than many developed peers. August's all-sector PMI reached a six-month high of 51.8, suggesting modest expansion even as construction remained weak.
The Bank of England held Bank Rate at 3.75% in July by a 6–3 vote, with the dissenters favoring an increase. A September 4 business survey showed expected price increases edging lower, but wage expectations remained firm. Sterling strengthened for a second consecutive month, supporting dollar-based returns while also trimming the translated value of overseas earnings.
Recent results show the breadth of the opportunity. Shell's earnings benefited from energy and trading, Barclays improved profit and capital returns, and AstraZeneca exceeded second-quarter profit expectations while maintaining its long-term targets. These reports do not erase a construction PMI of 44.3 or high gilt yields; they show that much of the index can earn globally even when the domestic cycle is subdued.
Price momentum, sterling, and valuation are bullish. The moving-average cross, sentiment, and U.K. credit-spread signal are bearish. The three-to-three split would normally argue for neutrality, but the combination of low relative valuation, improving currency behavior, and globally diversified earnings earns an overweight, with domestic rate-sensitive companies treated selectively.
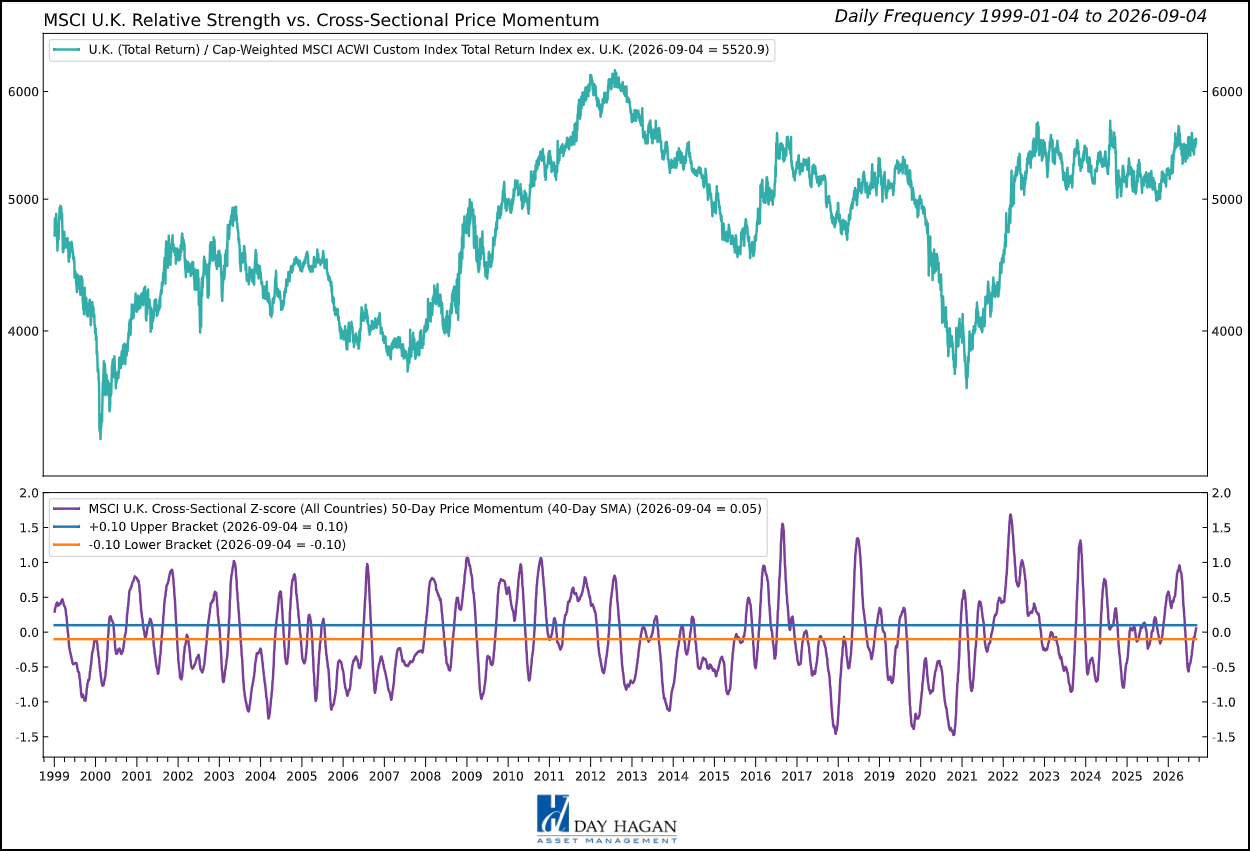
Figure 12: Global earnings, valuation, and sterling move the U.K. to overweight despite tight domestic financing.
Emerging Market Positions
Approximately 15% of the strategy is allocated across five markets from a pool of more than 20 smaller markets. Selection is based on a multifactor technical ranking system that uses trend and mean-reversion indicators. The process seeks to identify oversold opportunities likely to mean-revert and modest pullbacks within longer-term uptrends. These positions can be more volatile and less liquid than the core allocation.
Current Holdings
Philippines
Chile
Israel
Thailand
Italy
Explore Emerging Market Commentary
PHILIPPINES
The Philippines enters the Explore sleeve as a tactical exposure to banks, property, utilities, consumer demand, infrastructure, and business-process outsourcing. The long-term case rests on a young population, formalization, digital finance, and capital investment. The near-term case is less comfortable, which is precisely why the position belongs in the smaller, actively ranked sleeve rather than the core allocation.
Inflation averaged 5% through July, above the central bank's 2%–4% comfort range, and the Bangko Sentral ng Pilipinas raised its target rate by 25 basis points to 5.00% in August. The peso has remained weak, increasing imported-energy costs and the burden on companies with dollar liabilities. Policy is therefore acting as a stabilizer, but also as a restraint on credit-sensitive demand.
The opportunity is a possible improvement from depressed expectations rather than a forecast of smooth acceleration. Bank margins, infrastructure execution, remittances, and service exports can support earnings, while inflation, fiscal borrowing, currency volatility, and weaker consumer purchasing power are the principal risks. Position size is designed to reflect that asymmetry.
CHILE
Chile remains in the Explore sleeve as a focused exposure to copper, selected lithium assets, banks, utilities, and infrastructure. Codelco's first-half pretax profit more than quadrupled to $1.97 billion as stronger copper prices outweighed lower production. The result captures both sides of the thesis: the commodity can generate substantial cash flow, but operating execution is essential.
The Central Bank of Chile held its policy rate at 4.50% in July as inflation remained above target and oil prices complicated the outlook. The peso continues to trade as a liquid expression of copper demand and global risk appetite. A stronger currency would improve dollar-based returns and reduce imported inflation; a reversal in copper would work in the opposite direction.
Codelco's production fell 11% amid mine disruptions and higher costs, showing why high commodity prices alone are not enough. Grid investment, electrification, and data-center power demand support the long-run copper case, while China-linked demand, project delays, political decisions, and currency swings remain the principal risks.
ISRAEL
Israel remains an Explore holding because its technology, cybersecurity, defense electronics, banks, and medical-technology companies can earn globally even as the domestic risk premium changes quickly. A $3.5 billion air-defense agreement with Greece illustrates the export demand for Israeli systems. The opportunity is substantial, but the market remains unusually sensitive to security events and politics.
The Bank of Israel cut its policy rate by 25 basis points to 3.25% on September 1, its third consecutive reduction, after July inflation eased to 1.5%. The shekel weakened immediately after the decision but remained stronger for the year. A strong currency restrains inflation and supports dollar liabilities, although it can reduce the local-currency revenue of technology exporters.
Easier policy and the possibility of a lower risk premium support the position. The October election, regional security, fiscal spending, labor constraints, and abrupt currency moves are the main counterweights. This is a diversified innovation-and-normalization thesis, not a forecast that geopolitical risk has ended.
THAILAND
Thailand enters the Explore sleeve with a mix of tourism, electronics, food exports, healthcare, banks, industrial estates, and supply-chain investment. The Bank of Thailand said the technology and AI cycle is supporting activity, but also described growth as low and uneven. That combination creates room for specific companies to improve even if the national economy remains subdued.
The central bank held its policy rate at 1.00% in August and characterized policy as accommodative. The baht strengthened modestly against the dollar during the month, reducing imported costs but potentially squeezing exporters and tourism operators when foreign revenue is translated home. Credit growth has improved, while lending to small and midsize companies continues to contract.
The position favors export manufacturing, data-center and electronics investment, healthcare, airports, and tourism franchises with pricing power. Weak household balance sheets, softer Chinese travel, SME credit quality, trade protectionism, and a currency that becomes too strong are the principal risks.
ITALY
Italy enters the Explore sleeve through banks, insurance, defense, industrial automation, energy infrastructure, and branded exporters. Intesa Sanpaolo raised its 2026 profit outlook after a strong second quarter, while Generali reported better-than-expected first-half operating profit and announced a share repurchase. Those reports show how financial reform and higher nominal rates can translate into capital generation.
Italy also inherits the euro area's tougher policy mix. August inflation rose to 3.2%, the manufacturing sector contracted, and the ECB's deposit rate remained at 2.25%. The euro strengthened during August, helping U.S.-dollar translation but creating a headwind for exporters. Bank consolidation and proposals for financial and energy companies to support public finances add policy uncertainty.
The Explore position is therefore targeted rather than broad. Banks with excess capital, insurers, defense electronics, grid investment, and high-quality exporters offer potential, while public debt, energy costs, political intervention, and a weaker factory cycle limit conviction. The smaller sleeve allows the strategy to participate without treating recent financial-sector strength as permanent.
Catastrophic Stop Model
The Catastrophic Stop model combines time-tested, objective indicators designed to identify high-risk periods for the equity market. The model entered September recommending a fully invested equity allocation relative to the benchmark.
The weight of the evidence suggests that international equity exposure can remain selective and fully invested at this time. If the model triggers a sell signal below 40% for two consecutive days, indicating more substantial market stress, the strategy will raise cash in accordance with its rules. The signal is systematic and may change as market conditions evolve.
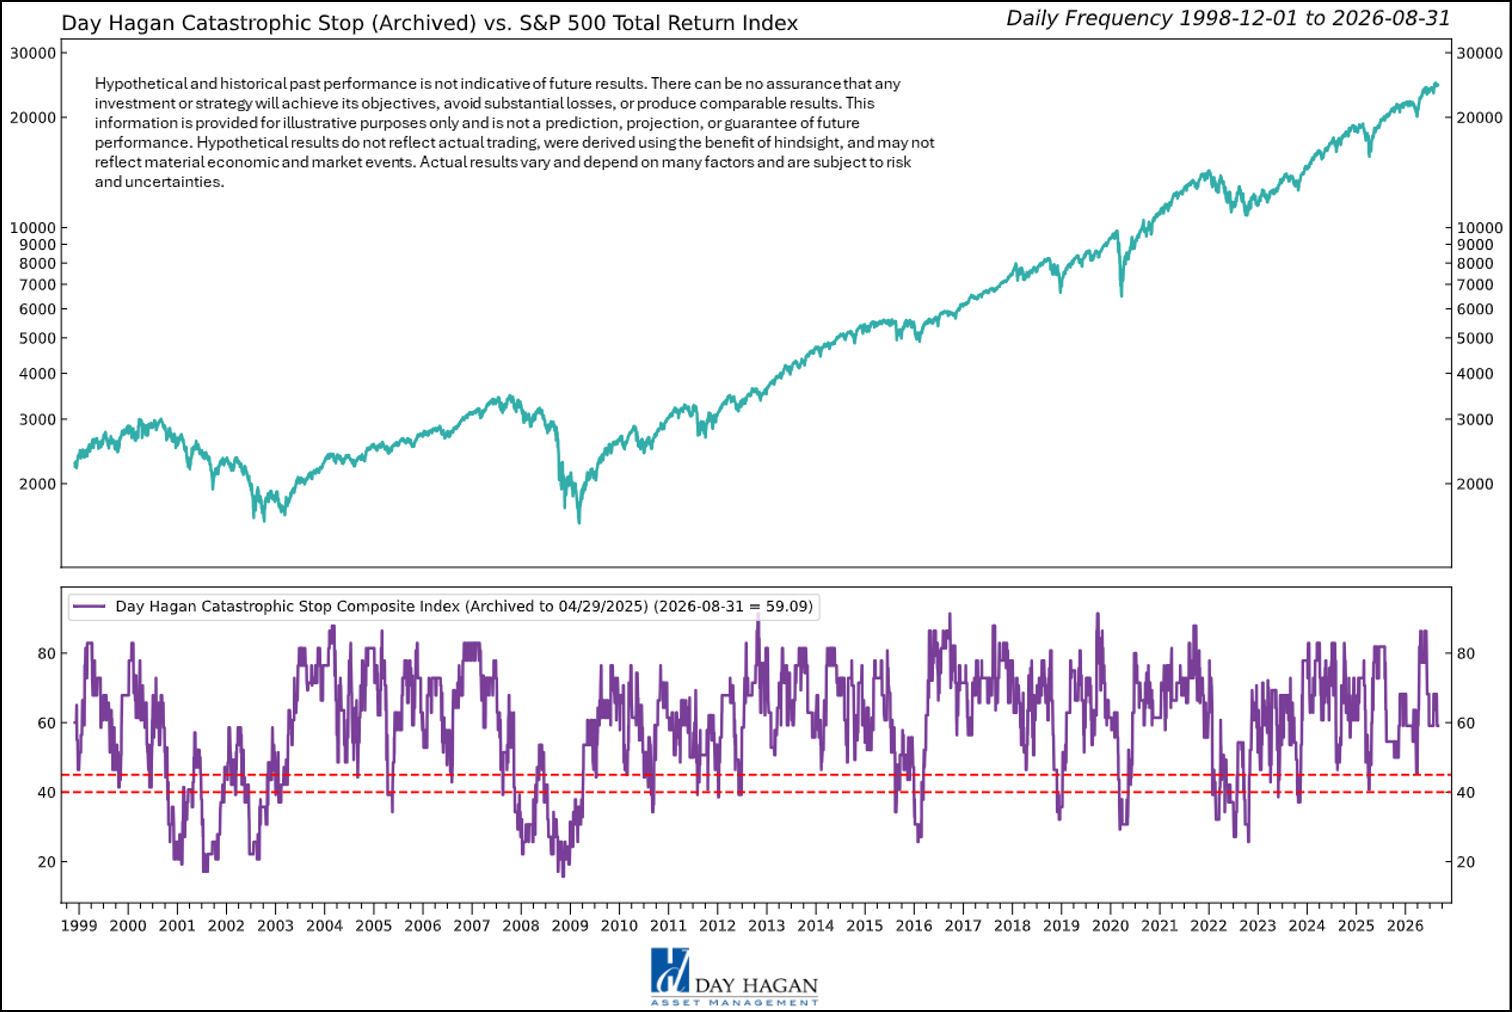
Figure 13: The Catastrophic Stop model recommends a fully invested equity position relative to the benchmark.
This strategy uses measures of price, valuation, economic trends, liquidity, and market sentiment to make objective, rational, and unemotional decisions about how much capital to risk and where to allocate it.
For more information, please contact us at:
Day Hagan Asset Management
1000 S. Tamiami Trl
Sarasota, FL 34236
Toll Free: (800) 594-7930
Office Phone: (941) 330-1702
Website: https://dayhagan.com or https://dhfunds.com
© 2026 Day Hagan Asset Management
This material is for educational purposes only. Further distribution is prohibited without prior permission. Please see the information on Disclosures and Fact Sheets here: https://dhfunds.com/literature. Charts with models and return information use indices for performance testing to extend the model histories, and they should be considered hypothetical. All Rights Reserved. (© Copyright 2026 Day Hagan Asset Management.)
Day Hagan Smart Sector® International ETF
Symbol: SSXU
Strategy Description
The Smart Sector® International strategy combines three quantitative investment strategies: Core International, Explore International, and Catastrophic Stop.
The Process Is Based On The Weight Of The Evidence
Core Allocation
The fund begins by overweighting and underweighting the largest non-U.S. equity markets based on proprietary models.
Each of the models utilizes market-specific, weight-of-the-evidence composites of fundamental, economic, technical, and behavioral indicators to determine each area’s probability of outperforming the ACWI, for example. U.S. Markets are weighted accordingly relative to benchmark weightings.
Explore Allocation
To select smaller markets, the fund uses a multi-factor technical ranking system to choose the top markets. The markets with the highest rankings split the non-core model allocation equally.
When Market Risks Become Extraordinarily High — Reduce Your Portfolio Risk
The model remains fully invested unless the Catastrophic model is triggered, whereupon the equity-invested position may be trimmed by up to 50%.
The Catastrophic Stop model combines time-tested, objective indicators designed to identify periods of high risk for the broad U.S. equity market. The model uses price-based, breadth, deviation from trend, fundamental, economic, interest rate, behavioral, and volatility-based indicator composites.
When Market Risks Return To Normal — Put Your Money Back To Work
When the Catastrophic Stop model moves back to bullish levels, indicating lower risk, the strategy will reverse toward being fully invested.
Disclosures
The data and analysis contained within are provided “as is” and without warranty of any kind, either express or implied. The information is based on data believed to be reliable, but it is not guaranteed. Day Hagan DISCLAIMS ANY AND ALL EXPRESS OR IMPLIED WARRANTIES, INCLUDING, BUT NOT LIMITED TO, ANY WARRANTIES OF MERCHANTABILITY, SUITABILITY, OR FITNESS FOR A PARTICULAR PURPOSE OR USE. All performance measures do not reflect tax consequences, execution, commissions, and other trading costs, and as such, investors should consult their tax advisors before making investment decisions, as well as realize that the past performance and results of the model are not a guarantee of future results. The Smart Sector® Strategy is not intended to be the primary basis for investment decisions, and the usage of the model does not address the suitability of any particular investment for any particular investor.
Using any graph, chart, formula, model, or other device to assist in deciding which securities to trade or when to trade them presents many difficulties, and their effectiveness has significant limitations, including that prior patterns may not repeat themselves continuously or on any particular occasion. In addition, market participants using such devices can impact the market in a way that changes the effectiveness of such devices. Day Hagan believes no individual graph, chart, formula, model, or other device should be used as the sole basis for any investment decision and suggests that all market participants consider differing viewpoints and use a weight-of-the-evidence approach that fits their investment needs.
Past performance does not guarantee future results. No current or prospective client should assume future performance of any specific investment or strategy will be profitable or equal to past performance levels. All investment strategies have the potential for profit or loss. Changes in investment strategies, contributions or withdrawals, and economic conditions may materially alter the performance of your portfolio. Different types of investments involve varying degrees of risk, and there can be no assurance that any specific investment or strategy will be suitable or profitable for a client’s portfolio. Historical performance results for investment indexes and/or categories generally do not reflect the deduction of transaction and/or custodial charges or the deduction of an investment management fee, the incurrence of which would have the effect of decreasing historical performance results. There can be no assurances that a portfolio will match or outperform any particular benchmark. Comparisons to indices are inherently unreliable indicators of future performance. The strategies used to generate the performance vary from those used to generate the returns depicted in the benchmarks. Investors cannot directly invest in an index.
The information contained herein is provided for informational purposes only and should not be construed as investment advice or a recommendation to buy or sell any security. The securities, instruments, or strategies described may not be suitable for all investors, and their value and income may fluctuate. Past performance is not indicative of future results, and there is no guarantee that any investment strategy will achieve its objectives, generate profits, or avoid losses.
This material is intended to provide general market commentary and should not be relied upon as individualized investment advice. Investors should consult with their financial professional before making any investment decisions based on this information.
The material may contain “forward-looking” information that is not purely historical in nature. Such information may include, among other things, projections, forecasts, estimates of market returns, and proposed or expected portfolio composition. Day Hagan Asset Management, its affiliates, employees, or third-party data providers shall not be liable for any loss sustained by any person relying on this information. All opinions and views expressed are subject to change without notice and may differ from those of other investment professionals within Day Hagan Asset Management or Ashton Thomas Private Wealth, LLC.
Accounts managed by Day Hagan Asset Management or its affiliates may hold positions in the securities discussed and may trade such securities without notice.
Day Hagan Asset Management is a division of and doing business as (DBA) Ashton Thomas Private Wealth, LLC, an SEC-registered investment adviser. Registration with the SEC does not imply a certain level of skill or training.
This material is for educational purposes only. Further distribution is prohibited without prior permission. Please see the information on Disclosures and Fact Sheets here: https://dhfunds.com/literature. Charts with models and return information use indices for performance testing to extend the model histories, and they should be considered hypothetical. All Rights Reserved. (© Copyright 2026 Day Hagan Asset Management.)
All hypothetical results are presented for illustrative purposes only. Back-testing and other statistical analysis is provided in use simulated analysis and hypothetical circumstances to estimate how it may have performed prior to its actual existence. The results obtained from "back-testing" information should not be considered indicative of the actual results that might be obtained from an investment or participation in a financial instrument or transaction referencing the Index. The Firm provides no assurance or guarantee that the products/securities linked to the strategy will operate or would have operated in the past in a manner consistent with these materials. The hypothetical historical levels have inherent limitations. Alternative simulations, techniques, modeling or assumptions might produce significantly different results and prove to be more appropriate. Actual results will vary, perhaps materially, from the simulated returns presented.
© 2026 Day Hagan Asset Management
Definitions:
S&P/ASX 200 – Designed to measure the performance of the 200 largest index-eligible stocks listed on the Australian Securities Exchange by float-adjusted market capitalization.
PMI — A survey-based economic indicator that measures business activity in sectors such as manufacturing and services; readings above 50 generally indicate expansion, while readings below 50 indicate contraction.
CPI — A measure of inflation that tracks changes in the prices consumers pay for goods and services over time.
Core Inflation — Inflation excluding more volatile items, typically food and energy, used to gauge underlying price trends.
Federal Reserve (Fed) — The central bank of the United States, responsible for monetary policy, interest rates, and financial stability.
ECB — The European Central Bank, responsible for setting monetary policy for countries that use the euro.
Bank of Japan (BoJ) — Japan’s central bank, responsible for monetary policy, interest rates, and financial conditions in Japan.
Bank of Canada (BoC) — Canada’s central bank, responsible for setting policy rates and managing inflation and economic stability.
Bank of England (BoE) — The United Kingdom’s central bank, responsible for monetary policy and financial stability.
SNB — The Swiss National Bank, responsible for monetary policy and maintaining price stability in Switzerland.
PBoC — The People’s Bank of China, which manages monetary policy, liquidity, and key lending benchmarks in China.
S&P 500 — A major U.S. stock market index tracking 500 large publicly traded U.S. companies; widely used as a benchmark for the U.S. equity market.
DJIA — The Dow Jones Industrial Average, a price-weighted stock index of 30 large U.S. companies, often used as a headline indicator of the U.S. stock market.
Nasdaq Composite — A stock market index composed largely of companies listed on the Nasdaq exchange, with especially heavy representation from technology and growth stocks.
STOXX 600 — A broad European stock index that tracks 600 large, mid, and small companies across Europe.
Nikkei 225 — A major Japanese stock market index tracking 225 prominent Japanese companies.
TSX — Canada’s main stock market benchmark, often referring to the S&P/TSX Composite Index.
CAC 40 — France’s main stock market index, tracking 40 major French companies.
DAX — Germany’s main stock market index, tracking major German listed companies.
FTSE 100 — The leading U.K. stock market index, tracking 100 large companies listed in London.
Shanghai Composite — A major Chinese stock index tracking stocks listed on the Shanghai Stock Exchange.
Shenzhen Component — A major Chinese stock index tracking companies listed on the Shenzhen Stock Exchange.
ACWI ex-U.S. Index — The MSCI All Country World Index excluding the United States; a benchmark for developed and emerging equity markets outside the U.S.
10-Year Yield — The interest rate paid on a 10-year government bond; a key benchmark for long-term borrowing costs and valuation.
Bund Yield — The yield on German government bonds, often used as a benchmark for euro-area sovereign debt.
Gilt Yield — The yield on U.K. government bonds, commonly called gilts.
OAT Yield — The yield on French government bonds.
Policy Rate — The benchmark interest rate set by a central bank to influence borrowing costs, inflation, and economic activity.
Basis Point (bp) — One one-hundredth of a percentage point; 25 basis points equals 0.25%.
Relative Strength — A measure of how a market, sector, or asset performs compared with another market or benchmark.
Overweight / Underweight / Neutral — Portfolio positioning terms: overweight means above benchmark allocation, underweight means below benchmark allocation, and neutral means roughly in line with the benchmark.