
Day Hagan Smart Sector® with Catastrophic Stop Strategy Update September 2026
A downloadable PDF copy of the Article:
Day Hagan Smart Sector® with Catastrophic Stop Strategy Update September 2026 (pdf)
Executive Summary
August rewarded two very different sources of leadership. Energy and Information Technology outperformed as crude oil rose and enthusiasm returned to the AI buildout theme. Utilities and Industrials lagged. Beneath the index, investors favored companies with current cash flow, visible demand, and the ability to fund growth without relying on cheaper money. The lesson was not that one style had won. It was that the market was willing to pay for growth or cyclicality when the evidence was tangible.
The economy also sent two messages. The ISM Manufacturing PMI registered 54.6 in August and the Services PMI reached 55.4, identifying both sides of the economy as being in expansion. Industrial and manufacturing production each increased 0.2% in July. August payrolls then rose by 162,000, the unemployment rate held at 4.1%, and earlier payroll estimates were revised higher. That combination supports business investment, technology demand, capital-markets activity, and credit quality, even though the pace of GDP growth has moderated.
The household picture is less comfortable. July retail sales fell 0.6%, personal consumption expenditures increased only 0.2%, and August consumer confidence slipped to 89.4. The expectations component fell to 68.2, a level consistent with considerable caution about future income and business conditions. Average hourly earnings rose 3.1% from a year earlier, slightly below July consumer inflation. Consumers are still participating, but the difference between essential spending and optional purchases is becoming more important.
Inflation improved at the margin without becoming benign. July CPI eased to 3.4% year over year and core CPI to 2.5%, while producer prices were unchanged during the month. The twelve-month PPI rate nevertheless remained 4.7%, the PCE price index held at 3.7%, and energy costs stayed elevated. WTI crude traded near $91 on September 4 after another strong month, keeping pressure on freight, chemicals, packaging, airlines, and household budgets while supporting producers and refiners.
Interest rates remain an important dividing line. The 10-year Treasury yield was near 4.8% on September 4, and the 30-year yield ended August around 5.25%. Stronger hiring reduced the case for near-term Federal Reserve relief. Those yields favor banks and insurers that can manage funding well, but they raise the hurdle for REITs, Utilities, housing, and long-duration growth stocks. Balance-sheet strength is therefore not a slogan in this environment; it is a practical source of flexibility.
Earnings remain the strongest support for equities. With 97% of S&P 500 companies reporting second-quarter results, FactSet calculated blended earnings growth of 52.0%; 86% of companies exceeded earnings estimates and 77% exceeded revenue estimates. The headline was somewhat distorted by investment gains at Alphabet and Amazon, but earnings still grew 33.8% when both companies were excluded. Ten sectors reported growth, showing that the profit cycle is broader than just the two largest contributors.
The September allocation concentrates active risk where the evidence is clearest. Information Technology and Financials are overweight. Communication Services remains underweight, and Industrials moves to a modest underweight as eight of thirteen indicators are bearish. The remaining sectors are neutral. That includes Energy, despite an unanimously bullish indicator set, because oil is carrying a geopolitical premium that can change abruptly. It also includes Consumer Discretionary, Consumer Staples, Materials, Real Estate, Health Care, and Utilities, where competing signals argue for selection rather than a large benchmark departure.
Sector
Consumer Discretionary
Consumer Staples
Communication Services
Energy
Financials
Health Care
Industrials
Information Technology
Materials
Real Estate
Utilities
Outlook (relative to benchmark weighting)
Neutral
Neutral
Underweight
Neutral
Overweight
Neutral
Modestly Underweight
Overweight
Neutral
Neutral
Neutral
Sector Review
The two overweights offer different return engines. Information Technology captures semiconductors, networking, cybersecurity, cloud infrastructure, and software businesses translating AI investment into revenue and contracted demand. Financials add banks, insurers, exchanges, brokers, and asset managers that can benefit from nominal growth, market activity, loan growth, and a steeper yield curve. Both groups have earnings support, but each still requires discipline around valuation, concentration, funding, and credit.
Most sectors are neutral because the opportunity is narrower than the sector label. Consumer Discretionary and Staples contain strong franchises, yet household purchasing power is uneven. Energy has the most favorable model but remains tied to oil and geopolitical outcomes. Materials balance improving copper and manufacturing signals against weak relative trends. Real Estate and Utilities have attractive structural demand, but long yields above 5% compete directly with income-oriented equities. Health Care combines durable demand with policy and product-cycle risk.
The underweights are more targeted. Communication Services has powerful digital platforms, but five of six indicators are bearish and reported earnings remain unusually concentrated in Alphabet. Industrials moves modestly underweight because momentum, volatility, commodity, and currency signals have weakened even as aerospace, defense, grid equipment, and automation retain attractive order books. The strategy is reducing broad exposure, not dismissing the strongest businesses inside either sector.
Across sectors, the portfolio favors visible demand, recurring revenue, positive estimate revisions, pricing power, and the ability to finance investment internally. It is less dependent on a rapid Fed easing cycle, a broad housing recovery, or an indefinite rise in oil. The models are not forecasts of certainty. They provide a disciplined way to test whether market behavior, fundamentals, valuation, and macro conditions are confirming the investment case.
Consumer Discretionary - Neutral
Consumer Discretionary enters September with a better labor backdrop but a more selective shopper. August payrolls rebounded and unemployment held at 4.1%, yet July retail sales declined 0.6%, consumer confidence fell again, and wage growth trailed inflation. Housing is another restraint: July starts dropped sharply, including a decline in single-family construction. The consumer has not disappeared, but credit costs and essential expenses leave less room for weak products or undifferentiated retailers.
Company reports showed why a broad conclusion is difficult. Target's comparable sales increased 3.8%, supported by higher traffic and stronger digital demand. Home Depot's U.S. comparable sales rose 1.3%, while Lowe's comparable sales were nearly flat as professional demand and online growth offset persistent do-it-yourself pressure. These results favor businesses winning traffic, convenience, and market share rather than assuming a broad recovery in homes, furnishings, apparel, or financed purchases.
Six of the sector's eleven indicators are bullish, including short- and intermediate-term trend, momentum, housing starts, and long-rate signals. Credit, valuation, and net-new-high measures remain bearish. Neutral recognizes the improvement without overlooking the household divide. We favor durable franchises, recurring services, digital commerce, travel experiences, and companies serving higher-income consumers, while remaining cautious with leveraged balance sheets, weak traffic, and products that depend on promotional pricing.
Figure 1: Improving momentum supports a neutral weight, while participation, credit, valuation, and housing risks still demand selectivity.
Consumer Staples - Neutral
Staples offer dependable demand, but dependable does not mean exceptionally profitable. Food inflation was 3.0% in July, oil remained elevated, and global supply disruptions increased pressure on transportation, packaging, fertilizer, and agricultural inputs. At the same time, cautious households continue to compare prices and shift between national brands and private label. Companies need productivity and genuine brand strength to protect margins without asking consumers to absorb another round of price increases.
Walmart's U.S. comparable sales increased 2.6%, with store-fulfilled delivery rising 40% and marketplace sales growing more than 50%. The combination illustrates where Staples can still compound: value, convenience, scale, and digital fulfillment. The weaker parts of the sector include packaged-food businesses losing units, companies dependent on repeated pricing, and household-product manufacturers facing higher freight and resin costs without enough volume growth to offset them.
The composite model is cautious: eight of twelve indicators are bearish, including trend, momentum, relative breadth, food sales, food inflation, and sales yield. Financial conditions and short interest are more supportive. We are neutral because the sector can provide useful ballast if growth disappoints, but we would not treat every defensive company alike. Preference goes to category leaders with stable units, international reach, strong free cash flow, and productivity programs that can absorb cost volatility.
Figure 2: Defensive demand supports a neutral weight, but weak relative trends and input costs favor proven category leaders.
Communication Services - Underweight
Communication Services still contains some of the market's strongest franchises, but it also contains slow-growth telecom, challenged legacy media, and increasingly capital-intensive digital platforms. Search, social advertising, and streaming engagement remain healthy. The investment question has shifted from whether AI can improve targeting and content to whether those benefits will earn an acceptable return on rapidly growing infrastructure spending.
FactSet's reported second-quarter sector earnings growth reached 116.9%, but the rate falls to 5.6% without Alphabet. Alphabet's operating results were strong, yet a $98 billion unrealized investment gain made the sector headline unusually flattering. August employment data supplied a separate warning: the information industry lost 23,000 jobs, with declines in computing infrastructure, publishing, broadcasting, and content providers. The industry is investing heavily while also removing costs.
Five of six sector indicators are bearish, including relative trend, deviation from trend, the yield curve, and relative earnings yield. That evidence supports an underweight even though selected platforms can continue to grow. We favor businesses with durable audiences, measurable advertising returns, improving streaming economics, and the balance sheet to fund AI internally. We are less interested in broad telecom exposure, structurally declining media assets, or companies whose spending plans are rising faster than free cash flow.
Figure 3: Strong digital franchises remain investable, but concentration, spending demands, and weak model readings support an underweight.
Energy - Neutral
Energy was one of August's strongest sectors as crude prices climbed and supply risk remained elevated. WTI ended August near $87 and traded around $91 on September 4. FactSet estimates second-quarter sector earnings grew 146.3%, helped by an average oil price 45% above the prior-year quarter. Refining and marketing, integrated producers, and exploration and production reported the strongest growth, while equipment and services remained the exception.
The operating backdrop is favorable. Chevron, Exxon, Marathon Petroleum, Phillips 66, and Valero all reported revenue above estimates, and sector revenue growth was revised higher as results arrived. Midstream companies add fee-based cash flow, refiners offer product-margin exposure, and low-cost producers convert higher prices into cash more directly. The common requirement is capital discipline; a high oil price is most valuable when management does not immediately turn it into an undisciplined drilling budget.
All eleven Energy indicators are bullish, spanning trend, breadth, volatility, free-cash-flow yield, inventories, rig activity, crude prices, and the dollar. We remain neutral because part of the oil price reflects the Iran conflict and impaired shipping through the Strait of Hormuz. A diplomatic change, restored flows, or additional supply could remove that premium quickly. Neutral preserves an inflation and geopolitical hedge without making a single commodity outcome the portfolio's central assumption.
Figure 4: Energy has the strongest model, but a neutral weight balances cash-flow support against reversible geopolitical risk.
Financials - Overweight
Financials offer several ways to participate in nominal growth. Banks can benefit from loan demand and a steeper yield curve. Insurers earn more on reinvested premiums. Exchanges and market-data companies monetize trading without taking traditional lending risk. Brokers and asset managers benefit when client activity improves. The overweight therefore does not depend on one bank, one credit category, or one path for interest rates.
Second-quarter results gave the thesis stronger fundamental support. FactSet's blended sector earnings growth increased to 22.0% from 5.2% at quarter-end, while revenue growth rose to 14.2%. JPMorgan, Goldman Sachs, Berkshire Hathaway, Travelers, Morgan Stanley, and Allstate were among the companies reporting positive earnings surprises. The August labor rebound also reduced immediate credit concerns, although household delinquencies and commercial real estate still require close monitoring.
Seven of thirteen indicators are bullish, including momentum, total-return trend, volatility, economic surprises, loan growth, and the yield curve. Financial-institution credit spreads and forward earnings yield remain bearish, while business-credit conditions are neutral. We favor diversified banks, insurers, exchanges, brokers, and fee businesses with strong capital. We remain cautious with expensive deposits, concentrated commercial-real-estate exposure, weak reserves, or growth that depends on loosening underwriting standards.
Figure 5: Earnings breadth, loan growth, and the yield curve support the overweight, with funding and credit discipline still essential.
Health Care - Neutral
Health Care's demand is steadier than the economy, but its earnings have very different drivers. Managed care must price utilization correctly. Pharmaceuticals depend on product launches, patent lives, and policy. Medical devices benefit from procedures and innovation. Life-science tools need research budgets and biotechnology funding to recover. Company selection usually matters more than the macro label.
FactSet reports a 6.5% second-quarter earnings decline, but acquisition and research charges at Gilead and Merck distort the comparison. Excluding those companies, earnings grew 18.1%. Eli Lilly supplied the clearest growth example: quarterly revenue increased 48%, led by Mounjaro and Zepbound volume, and management raised guidance. Providers, equipment, and life-science tools also reported growth, showing that the weakness was not sector-wide.
The indicators are almost evenly divided: four bullish, five bearish, and one neutral. Trend and breadth improved, while medical inflation, health spending, book yield, and drawdown measures remain less supportive. Neutral captures durable demand and product-cycle opportunities without ignoring reimbursement, drug-pricing, patent, and valuation risks. We favor devices, profitable biotechnology, selected managed care, and pharmaceutical companies with multiple growth drivers.
Figure 6: Better trend and breadth meet mixed spending and valuation signals, keeping Health Care at a neutral weight. Pricing power has been declining.
Industrials - Modestly Underweight
Industrials combine durable investment themes with a less durable business cycle. Aerospace, defense, grid equipment, power management, and automation have visible demand. Freight, trucking, lower-margin machinery, and construction-linked businesses are more exposed to fuel costs and uneven demand. August reflected that split: the broad sector lagged even as selected capital-goods companies reported strong results.
The data were constructive but not accelerating. The ISM Manufacturing PMI registered 54.6, new orders 53.7, and July industrial and manufacturing production each advanced 0.2%. August manufacturing payrolls increased by 16,000. Caterpillar's sales and revenue rose 24%, and its adjusted margin expanded. Those figures support equipment and infrastructure leaders, but weak housing starts, softer consumer expectations, and high oil limit the case for a broad cyclical overweight.
Eight of thirteen indicators are bearish, including momentum, volatility, RSI, sales yield, oil, industrial commodities, and the dollar. Trend, cash-flow yield, new lows, and industrial production are bullish. A modest underweight respects that deterioration without abandoning strong order books. We favor aerospace, defense, electrical equipment, automation, and power systems, while reducing freight, fuel-sensitive transportation, and businesses dependent on a synchronized global manufacturing surge.
Figure 7: Strong structural order books remain attractive, but weak momentum and macro-sensitive signals warrant a modest underweight.
Information Technology - Overweight
Technology regained leadership in August as investors returned to the AI infrastructure buildout. The opportunity extends beyond one chipmaker. Semiconductors provide compute, memory, and custom accelerators. Networking and optical systems move the data. Cloud platforms organize the infrastructure. Cybersecurity protects it. Software must convert AI capability into contracted revenue, retention, or higher margins. The portfolio favors companies where demand can be measured rather than inferred from promotional language.
The latest reports strengthened that distinction. NVIDIA projected third-quarter revenue of $108 billion, above the market estimate cited at the release. Broadcom reported $16.7 billion of AI semiconductor revenue, more than triple the prior-year period, and projected further acceleration. Salesforce reported $66.3 billion of remaining performance obligations, up 11%, while subscription and support revenue rose 12%. Together, the reports showed demand across compute, networking, data, and enterprise software.
Six of seven Technology indicators are bullish, including momentum, two overbought/oversold measures, sales yield, inflation expectations, and earnings-revision breadth. Short interest is the lone bearish reading. FactSet estimates sector earnings grew 75.3%; even without semiconductors, growth was 38.3%. The overweight is supported by earnings and market confirmation, but concentration, high expectations, supply constraints, and heavy customer capital spending argue for diversification and disciplined position sizes.
Figure 8: Earnings revisions and measurable AI demand support the overweight, with concentration and expectations setting a high bar.
Materials - Neutral
Materials enter September with a balanced model and uneven fundamentals. U.S. manufacturing remained in expansion, industrial production increased, and ISM respondents identified steel among commodities in short supply. Copper and sector price momentum support metals and electrification beneficiaries. Housing and global demand are less supportive, while higher energy costs can pressure chemicals, packaging, glass, and other intensive producers.
Recent reports reinforced the need to separate businesses. Nucor reflected healthy steel demand, Freeport-McMoRan benefited from copper, and Dow returned to operating profitability. The drivers are not interchangeable. Copper and steel can benefit from grid, data-center, infrastructure, and reshoring investment. Specialty chemicals rely on differentiated products. Commodity chemicals and packaging need better volumes and cost control. Construction materials depend more on infrastructure than housing.
Seven of fourteen indicators are bullish and seven are bearish. Momentum, volatility, copper, sales yield, and industrial production are constructive; the moving-average trend, emerging-market momentum, precious metals, natural gas, and earnings yield are not. Neutral is the appropriate expression of that split. We favor low-cost producers, specialty businesses, and electrification beneficiaries, while avoiding the assumption that every commodity producer will benefit equally from U.S. capital spending.
Figure 9: Improving copper and manufacturing signals offset weak relative trends, leaving Materials neutral and highly selective.
Real Estate - Neutral
Real Estate divides into scarce, well-financed assets and properties facing too much supply or debt. Data centers benefit from AI demand and limited power. Industrial warehouses serve e-commerce and supply-chain redesign. Necessity retail has healthy occupancy and modest construction. Apartments depend on local supply and job growth. Office owners still face high vacancies, concessions, and refinancing risk.
The backdrop became more restrictive. July housing starts fell 12.4%, single-family starts declined 9.9%, and the 30-year Treasury yield ended August near 5.25%. The 10-year yield approached 4.8% after the September 4 jobs report. Those rates raise financing costs and compete with REIT dividends, while stronger employment and data-center demand support better property types.
Six of ten indicators are bullish, including trend, breadth, unemployment, long rates, construction-supply production, and economic surprises. Homebuilding, small-business credit, and short-term price measures are bearish. We moved to neutral because the favorable model does not fully offset refinancing and rate risk. Preference goes to contractual rent growth, scarce assets, long debt maturities, and internally funded development; caution remains warranted around weak offices and near-term maturities.
Figure 10: Constructive breadth and economic signals meet high financing costs and a waning Homebuilding sub-industry, supporting a neutral position.
Utilities - Neutral
Utilities are part income investment and part infrastructure investment. Regulated electric companies can grow rate bases through transmission, generation, and grid hardening. Data centers are lifting load forecasts after decades of little growth. Independent power and nuclear operators may benefit from scarce round-the-clock electricity. Gas and water utilities offer steadier demand but less AI exposure.
The sector lagged in August as long yields rose and investors favored Energy and Technology. That raises the required return on capital without erasing the demand story. Dominion, Southern, and NextEra recently reported earnings growth while investing in power capacity and networks. Utilities must earn allowed returns, control construction costs, and avoid unacceptable customer bill pressure.
The model is mixed: five indicators are bullish, six bearish, and two neutral. Momentum, breadth, oil sensitivity, capacity utilization, and dividend yield are constructive. Moving-average trend, price reversals, valuation relative to Treasuries, and manufacturing signals are less supportive. Neutral participates in the electricity-demand theme without treating every utility as an AI beneficiary. We prefer sound balance sheets, constructive regulation, visible capital plans, and funding needs that do not depend on repeated equity issuance.
Figure 11: Electricity demand remains compelling, but Treasury competition, valuation, and financing needs keep Utilities neutral.
Catastrophic Stop Update
The Catastrophic Stop model combines time-tested, objective indicators designed to identify high-risk periods for the equity market. The model entered September recommending a fully invested equity allocation relative to the benchmark.
The evidence does not currently indicate broad deterioration associated with a major downtrend. If the model falls below 40% for two consecutive days, the strategy will raise cash under its rules.
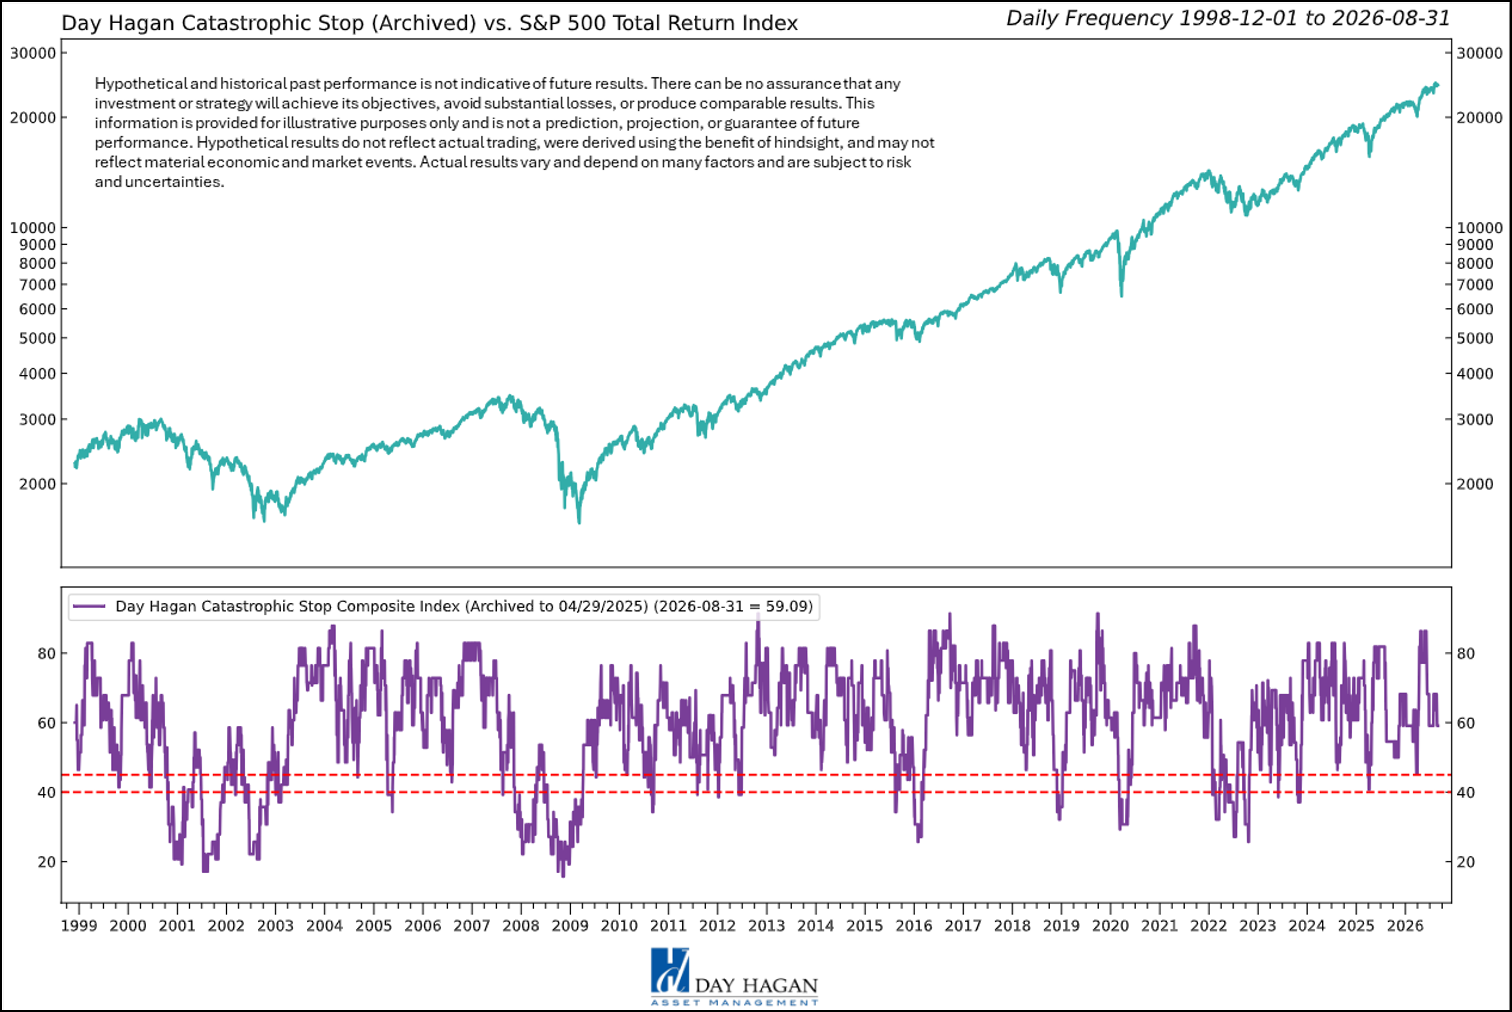
Figure 12: The Catastrophic Stop model recommends a fully invested equity position relative to the benchmark.
Hypothetical and historical past performance is not indicative of future results. There can be no assurance that any investment or strategy will achieve its objectives or avoid substantial losses or have comparable results. This information is provided for illustrative purposes only and is not a prediction, projection, or guarantee of future performance. Hypothetical results do not reflect actual trading, were derived using the benefit of hindsight, and may not reflect material economic and market events. Actual results vary and depend on many factors and subject to risk and uncertainties.
Our goal is to stay aligned with the prevailing trend and introduce risk management when conditions deteriorate. Growth, liquidity, earnings, and equity demand remain constructive, while inflation, long rates, oil, and consumer confidence deserve attention. The Catastrophic Stop remains positive. If it shifts to bearish levels, our discipline will call for raising cash.
The strategy uses price, valuation, economic, liquidity, and sentiment measures to guide allocation. Data are through September 4, 2026. Company references illustrate sector conditions and are not recommendations.
Day Hagan Asset Management
1000 S. Tamiami Trl
Sarasota, FL 34236
Toll Free: (800) 594-7930
Office Phone: (941) 330-1702
Website: https://dayhagan.com or https://dhfunds.com
This material is for educational purposes only. Further distribution is prohibited without prior permission. Please see the information on Disclosures and Fact Sheets here: https://dhfunds.com/literature. Charts with models and return information use indices for performance testing to extend the model histories, and they should be considered hypothetical. All Rights Reserved. (© Copyright 2026 Day Hagan Asset Management.)
Day HaganSmart Sector®
With Catastrophic Stop ETF
Symbol: SSUS
Disclosures
The data and analysis contained within are provided “as is” and without warranty of any kind, either express or implied. The information is based on data believed to be reliable, but it is not guaranteed. Day Hagan DISCLAIMS ANY AND ALL EXPRESS OR IMPLIED WARRANTIES, INCLUDING, BUT NOT LIMITED TO, ANY WARRANTIES OF MERCHANTABILITY, SUITABILITY, OR FITNESS FOR A PARTICULAR PURPOSE OR USE. All performance measures do not reflect tax consequences, execution, commissions, and other trading costs, and as such, investors should consult their tax advisors before making investment decisions, as well as realize that the past performance and results of the model are not a guarantee of future results. The Smart Sector® Strategy is not intended to be the primary basis for investment decisions, and the usage of the model does not address the suitability of any particular investment for any particular investor.
Using any graph, chart, formula, model, or other device to assist in deciding which securities to trade or when to trade them presents many difficulties, and their effectiveness has significant limitations, including that prior patterns may not repeat themselves continuously or on any particular occasion. In addition, market participants using such devices can impact the market in a way that changes the effectiveness of such devices. Day Hagan believes no individual graph, chart, formula, model, or other device should be used as the sole basis for any investment decision and suggests that all market participants consider differing viewpoints and use a weight-of-the-evidence approach that fits their investment needs.
Past performance does not guarantee future results. No current or prospective client should assume future performance of any specific investment or strategy will be profitable or equal to past performance levels. All investment strategies have the potential for profit or loss. Changes in investment strategies, contributions or withdrawals, and economic conditions may materially alter the performance of your portfolio. Different types of investments involve varying degrees of risk, and there can be no assurance that any specific investment or strategy will be suitable or profitable for a client’s portfolio. Historical performance results for investment indexes and/or categories generally do not reflect the deduction of transaction and/or custodial charges or the deduction of an investment management fee, the incurrence of which would have the effect of decreasing historical performance results. There can be no assurances that a portfolio will match or outperform any particular benchmark. Comparisons to indices are inherently unreliable indicators of future performance. The strategies used to generate the performance vary from those used to generate the returns depicted in the benchmarks. Investors cannot directly invest in an index.
The information contained herein is provided for informational purposes only and should not be construed as investment advice or a recommendation to buy or sell any security. The securities, instruments, or strategies described may not be suitable for all investors, and their value and income may fluctuate. Past performance is not indicative of future results, and there is no guarantee that any investment strategy will achieve its objectives, generate profits, or avoid losses.
This material is intended to provide general market commentary and should not be relied upon as individualized investment advice. Investors should consult with their financial professional before making any investment decisions based on this information.
Data and analysis are provided “as is” without warranty of any kind, either express or implied. Day Hagan Asset Management, its affiliates, employees, or third-party data providers shall not be liable for any loss sustained by any person relying on this information. All opinions and views expressed are subject to change without notice and may differ from those of other investment professionals within Day Hagan Asset Management or Ashton Thomas Private Wealth, LLC.
Accounts managed by Day Hagan Asset Management or its affiliates may hold positions in the securities discussed and may trade such securities without notice.
Day Hagan Asset Management is a division of and doing business as (DBA) Ashton Thomas Private Wealth, LLC, an SEC-registered investment adviser. Registration with the SEC does not imply a certain level of skill or training.
There is no guarantee that any investment strategy will achieve its objectives, generate dividends, or avoid losses.
This material is for educational purposes only. Further distribution is prohibited without prior permission. Please see the information on Disclosures and Fact Sheets here: https://dhfunds.com/literature. Charts with models and return information use indices for performance testing to extend the model histories, and they should be considered hypothetical. All Rights Reserved. (© Copyright 2026 Day Hagan Asset Management.)
Definitions
Sector Composite Models — Day Hagan Sector Composite Models use quantitative, rules-based indicators to evaluate relative sector conditions across trend, momentum, valuation, breadth, macroeconomic, and sentiment inputs. The models are designed to support disciplined sector allocation decisions. Hypothetical and historical past performance is not indicative of future results. There can be no assurance that any investment or strategy will achieve its objectives, avoid substantial losses, or have comparable results. This information is provided for illustrative purposes only and is not a prediction, projection, or guarantee of future performance. Hypothetical results do not reflect actual trading, were derived using the benefit of hindsight, and may not reflect material economic and market events. Actual results vary and depend on many factors and are subject to risks and uncertainties.
S&P 500 — A stock market index tracking 500 of the largest publicly traded U.S. companies; commonly used as a benchmark for the overall U.S. equity market.
Dow Jones Industrial Average (DJIA) — A price-weighted stock index of 30 large U.S. companies, often used as a headline measure of the stock market.
Nasdaq Composite — A stock market index that includes thousands of stocks listed on the Nasdaq exchange, with heavy exposure to technology companies.
PMI (Purchasing Managers’ Index) — A survey-based economic indicator that measures business activity; readings above 50 generally indicate expansion, while readings below 50 indicate contraction.
ISM (Institute for Supply Management) Index — A widely followed U.S. manufacturing activity index based on purchasing manager surveys; used to gauge economic momentum.
CPI (Consumer Price Index) — A measure of inflation that tracks changes in the prices consumers pay for goods and services.
Medical CPI — A CPI subcategory that measures inflation specifically in medical care goods and services.
Federal Reserve (the Fed) — The central bank of the United States, responsible for setting monetary policy and influencing interest rates and financial conditions.
Benchmark weighting — The percentage weight a sector or asset has in a benchmark index, used as a reference point for portfolio positioning.
Overweight — A portfolio position above the benchmark weighting, reflecting a more favorable view of that sector or asset.
Underweight — A portfolio position below the benchmark weighting, reflecting a less favorable view of that sector or asset.
Neutral — A portfolio position roughly in line with the benchmark weighting, indicating no strong directional preference.
Sector rotation — A market dynamic in which investors shift money between sectors based on changing economic, interest-rate, or earnings expectations.
Relative strength — A measure of how a stock, sector, or asset performs compared with a benchmark or another asset.
Breadth — A technical measure showing how broadly market participation is spread, such as how many stocks in a sector are advancing or hitting new highs/lows.
RSI (Relative Strength Index) — A technical momentum indicator used to assess whether an asset may be overbought or oversold.
Yield curve — The relationship between yields on short- and long-term Treasury securities; changes in its shape can signal shifts in economic expectations.
10Y-2Y spread — The difference between the 10-year and 2-year U.S. Treasury yields, often used as a quick measure of the yield curve’s steepness.
WTI crude — West Texas Intermediate crude oil, a key U.S. benchmark price for oil.
REITs (Real Estate Investment Trusts) — Companies that own, operate, or finance income-producing real estate and typically trade like stocks.
Communication Services sector: The Communication Services Sector includes telecom and media & entertainment companies, including producers of interactive gaming products and companies engaged in content and information creation or distribution through proprietary platforms.
Consumer Discretionary sector: The Consumer Discretionary sector's manufacturing segment includes automobiles & components, household durable goods, leisure products, and textiles & apparel. The services segment includes hotels, restaurants, and other leisure facilities. It also includes distributors and retailers of consumer discretionary products.
Consumer Staples sector: The Consumer Staples sector includes manufacturers and distributors of food, beverages, and tobacco, as well as producers of non-durable household goods and personal products. It also includes distributors and retailers of consumer staples, including food & drug retailers.
Energy sector: The Energy sector includes companies that operate in the areas of exploration & production, refining & marketing, and storage & transportation of oil & gas and coal & consumable fuels. It also includes companies that offer oil & gas equipment and services.
Financials sector: The Financials sector includes banking, financial services, consumer finance, capital markets, and insurance activities. It also includes Financial Exchanges & Data and Mortgage REITs.
Fixed Income sector: The Fixed Income sector includes investment securities that pay investors fixed interest payments until the maturity date. Designed for income generation and capital preservation, this sector includes government, corporate, and municipal bonds, as well as certificates of deposit (CDs).
Health Care sector: The Health Care sector includes health care providers & services, health care equipment & supplies, and health care technology companies. It also includes companies involved in the research, development, production, and marketing of pharmaceuticals and biotechnology products.
Industrials sector: The Industrials sector includes aerospace & defense, building products, electrical equipment and machinery, and companies that offer construction & engineering services. It also includes providers of commercial & professional services including printing, environmental and facilities services, office services & supplies, security & alarm services, human resource & employment services, research & consulting services. It also includes companies that provide transportation services.
Information Technology sector: The Information Technology sector includes software and information technology services, manufacturers and distributors of technology hardware & equipment such as communications equipment, cellular phones, computers & peripherals, electronic equipment and related instruments, and semiconductors and related equipment & materials.
Materials sector: The Materials sector includes chemicals, construction materials, forest products, glass, paper and related packaging products, and metals, minerals and mining companies, including producers of steel.
Real Estate sector: The Real Estate sector includes companies engaged in real estate development and operation. It also includes companies offering real estate-related services and Equity Real Estate Investment Trusts (REITs).
© 2026 Day Hagan Asset Management