
Day Hagan Smart Sector® International Strategy Update September 2025
A downloadable PDF copy of the Article:
Day Hagan Smart Sector® International Strategy Update September 2025 (pdf)
Executive Summary
Global Equity Performance: A Regional Snapshot
August was shaped by two global forces: new U.S. tariffs and shifting investor flows. The tariff package altered trade expectations and corporate guidance across supply-chain-heavy sectors. Flows swung through the month—early equity outflows on tariff headlines, a mid-month rebound as softer U.S. data hinted that tightening cycles were near an end, and a late fade ahead of Jackson Hole as sector leadership wobbled, especially in technology.
In Australia, the Reserve Bank cut the cash rate for a third consecutive meeting to 3.6%. Officials emphasized data dependence after a material easing in financial conditions since May. Labor indicators were steady, with unemployment at 4.2% and participation firm, supporting a soft-landing view. The July CPI rose compared to June, keeping inflation risk on the radar. With Q2 GDP due in early September, expectations pointed to a modest late-quarter acceleration, informing positioning in rate-sensitive domestic exposures.
Canada’s focus was on data rather than policy. The Bank of Canada did not meet in August, but markets priced a more dovish tilt as growth and inflation cooled. The July CPI eased to 1.7% year-over-year. Q2 GDP surprised on the downside, with exports pressured by U.S. tariffs. A weak spot was partly offset by a small advance estimate for July GDP, but the overall backdrop kept investors leaning towards defensives as they considered whether September easing could cushion exporters.
China stayed in a holding pattern. The PBOC left the one-year and five-year Loan Prime Rates unchanged at 3.0% and 3.5% on August 20. July credit creation was soft, and mid-month activity data were mixed. No broad property stimulus arrived. China-dedicated equity funds saw early-month outflows, reflecting cautious sentiment. Rising Taiwan-related rhetoric late in the month added headline risk, steering allocations toward selective, policy-linked themes rather than broad exposure.
France and Germany signaled tentative stabilization. In France, the services PMI rose to 49.8, and the composite matched 49.8—just below expansion but the best in a year—while the flash August HICP was 0.8% year-over-year. Germany’s manufacturing readings edged toward expansion as services slipped back below 50. Eurozone HICP printed 2.1%, consistent with a steady European Central Bank stance into September.
In the United Kingdom, the Bank of England cut the Bank Rate to 4.0% on August 6, in a close 5–4 vote, balancing sticky service inflation with slower growth. Services PMI rose to a year-plus high, while manufacturing stayed weak. The debate centered on whether the strength of services could persist without broader support.
Japan had no August central bank decision. Tokyo’s core CPI slowed to 2.5%, still above target, and July factory output disappointed notably in the automotive sector amid tariff-related trade frictions. Markets discussed the odds of a later-year hike, but August produced only caution.
Switzerland combined very low inflation with a tariff shock. The SNB did not meet; July CPI confirmed subdued pressures. New U.S. tariffs on Swiss exports, including watches, led firms to front-load shipments and reprice U.S. channels. Across regions, tariffs, the war in Ukraine, and tensions over Taiwan raised risk premia for export-reliant and supply-chain-sensitive sectors, reinforcing cautious positioning into September.
Conclusion
By the end of August, the global equity narrative across these eight countries had crystallized around a few core themes. Central banks were gradually easing or signaling caution, but inflation data remained uneven, forcing markets to price a delicate policy path. Tariffs and geopolitical shocks highlighted the vulnerability of export-driven sectors. PMI and GDP releases offered glimpses of stabilization but little assurance of durable growth. Investor flows reflected the uncertainty: early-month outflows gave way to mid-month inflows before cooling again as August drew to a close. Taken together, the month underscored that equity market drivers were less about performance metrics and more about how investors interpreted policy, data, and geopolitics in real-time.
Holdings
Core: Developed Market Positions (approximately 65% of equity holdings)
Country
Australia
Canada
China
France
Germany
Japan
Switzerland
United Kingdom
Outlook
Neutral
Neutral
Overweight
Underweight
Neutral
Overweight
Underweight
Underweight
Explore: Emerging Market Positions (approximately 35% of equity holdings)
India
Poland
Malaysia
South Korea
Taiwan
Position Details
Core: Developed Market Commentary
Approximately 65% of the strategy is allocated across eight of the largest markets in the ACWI ex-U.S. Index. The fund overweights and underweights the largest non-U.S. equity markets based on macro, fundamental, behavioral, and technical indicators.
Australia: Momentum and trend signals are generally bullish, with leadership supported by adaptive and absolute moving averages, gold, the AU/US rate differential, and beta versus global equities. Short-cycle resilience is mixed, with behavior around bear-market bounces only neutral. Quality and valuation gauges are negative, with the ACWI technical scorecard and relative earnings yield indicating a bearish outlook. Net-net, trend and macro tilts favor Australia, but broader breadth and valuation confirmation are needed before increasing exposure.
Commentary: In August, the Reserve Bank of Australia cut its cash rate by 25 basis points to 3.6%, a move aligned with market expectations and the lowest level since April 2023. This decision reflects a total 75 basis points reduction for the year, attributed to a significant decrease in inflation from its 2022 highs and a softer labor market. While cost pressures are easing, the RBA remains cautious about domestic and global uncertainties, including potential impacts on growth from trade policy. Meanwhile, the S&P Global Australia Manufacturing PMI surged to 53, indicating robust expansion, spurred by rising new orders and a rebound in export demand. Concurrently, the Services PMI rose to 55.8, showcasing the strongest growth in over three years, fueled by increased new business and hiring amid rising input costs. Despite some inflationary pressures, overall business confidence is improving, suggesting a positive outlook for future sales.
Figure 1: A new uptrend in gold prices would be bullish for Australia’s stock market.
Canada: Canada’s relative strength signals are mixed. Trend indicators are constructive: the triple moving average diffusion and the absolute moving average cross are both bullish. Mean reversion is bearish, suggesting recent outperformance may lack follow-through. The broader context is weak, as indicated by the ACWI technical scorecard, OECD leading indicators, the CAD-USD exchange-rate linkage, and the relative earnings yield, all of which point to a bearish outlook. Overall, limited valuation support, macro softness, and currency headwinds are currently offsetting trend strength, leaving leadership tentative but intact so far.
Commentary: The Canadian dollar hit a two-month low on August 21. Recent data from Statistics Canada revealed a 0.4% decline in Q2 real GDP, attributed to a 7.5% drop in exports due to U.S. tariffs, decreased business investment, and a decline in the household saving rate to 4.8%. This downturn has heightened concerns about potential Bank of Canada (BoC) rate cuts, especially as the growth gap with the US has widened, with U.S. GDP growth estimated at an annualized rate of 3.3%. Meanwhile, the S&P Global Canada Manufacturing PMI edged up to 48.3 in August from 46.1, indicating a continued contraction in manufacturing for the seventh month, driven by U.S. tariffs and reduced demand. Although staffing cuts persisted, the pace slowed, and confidence among firms rose to a seven-month high, despite ongoing economic uncertainties.
Figure 2: Canada’s relative strength mean reversion indicator is oversold. A reversal would support a continuation of the recent rally.
China: China’s relative-strength profile leans positive. Trend signals are positive: relative price momentum and the absolute moving-average cross are bullish. Short-term mean reversion is bearish, implying recent gains lack persistence. The bear-market bounce indicator is neutral. Macro linkages lean negative: the relationship to PMI and to the emerging-markets currency basket is bearish. Risk appetite is constructive, with the high-yield credit spread indicator bullish. Net result: improving trend, but weak macro confirmation and currency headwinds keep us at a modestly overweight allocation.
Commentary: In August, the People’s Bank of China (PBOC) kept its key lending rates steady at historic lows for the third month, despite signs of a slowing economy. The one-year Loan Prime Rate (LPR) remains at 3.0%, while the five-year LPR holds at 3.5%. Recent data revealed a sharp slowdown in industrial output growth and retail sales, raising concerns as new yuan loans dropped for the first time in two decades. On a positive note, the China General Manufacturing PMI rose to 50.5, indicating modest output growth due to increased orders and easing foreign demand declines. Meanwhile, the General Services PMI climbed to 53.0, showing the fastest growth since May 2024, driven by strong new orders and export business. However, service providers reduced staffing levels amid cost concerns. Overall sentiment remains optimistic, with expectations for improved market conditions supporting business activity.
Figure 3: Narrow high-yield credit spreads are supportive of risk-on assets like China equities.
France: France’s relative-strength backdrop is skewed negatively. Trend and breadth are weak, with moving-average crossovers, 200-day breadth, cross-sectional 50-day momentum, and the global technical scorecard all indicating bearish signals. Macro confirmation is soft as the linkage to OECD leading indicators is bearish. Offsetting support comes from valuation, as the relative dividend yield and the ACWI valuation scorecard are bullish. Fund flows are neutral, showing no incremental demand. Overall, unfavorable trends, breadth, and macro signals outweigh valuation positives.
Commentary: Concerns about debt sustainability in major economies have led to a significant rise in bond yields, with France’s 30-year yield reaching its highest level since 2009 due to growing political uncertainty ahead of a no-confidence vote. The HCOB France Manufacturing PMI unexpectedly rose to 50.4 in August 2025, marking its first growth since January, albeit reflecting only a slight improvement in conditions as contractions in output and new orders eased. Meanwhile, the Services PMI increased to 49.8, indicating near-stabilization after eleven months of decline, while backlogs grew, supporting the fastest employment growth in 15 months. Consumer confidence, however, dipped to 87, the lowest since October 2023, as households expressed growing pessimism about their financial future and deteriorating perceptions of living standards. Despite some positive views on saving capacity, inflation expectations improved slightly, highlighting ongoing economic challenges and cautious sentiment among consumers.
Figure 4: Breadth has rolled over and is negative for French equities.
Germany: Germany’s relative-strength setup is positive. Breadth is supportive, and the global technical scorecard and manufacturing confidence are bullish. A relatively high dividend yield also helps. However, the relative moving-average cross is bearish, showing some weakness, and the EUR-USD linkage recently turned bearish, implying a currency headwind. Behavior around bear-market bounces is neutral, and relative ETF fund flows are neutral, signaling limited sponsorship. Net result: constructive foundation, but trend and FX keep leadership tentative for now. We are neutral.
Commentary: Germany’s ifo Business Climate Index climbed to 89 in August, up from 88.6 in July, marking its highest since May 2024 and surpassing expectations. While company outlooks improved to 91.6, assessments of the current situation slightly dipped to 86.4, indicating a sluggish economic recovery. Manufacturing sentiment dropped marginally to -12.2, with mixed feelings about orders, although capital goods firms remained optimistic. The service sector PMI also experienced a slight decline to 49.3, signaling a return to contraction due to decreased new work and stagnant hiring. Meanwhile, construction saw a minor drop in satisfaction but improved future expectations. Notably, the GfK Consumer Climate Indicator fell to -23.6, the lowest since April, amid concerns over job losses and inflation. Overall, while optimism persists in certain sectors, challenges remain evident in the economic landscape.
Figure 5: Germany’s Manufacturing Confidence Composite is improving relative to the rest of the world, potentially setting the stage for another leg higher. We’ll need more technical confirmation before increasing exposure.
Japan: Japan’s relative strength picture is broadly positive. Trend signals are strong, with both absolute and relative moving average crosses indicating a bullish trend. Valuation and fundamentals support the case, with the ACWI valuation lens and forward earnings growth bullish. Sentiment and currency factors also help: sentiment reversals and the USD/JPY linkage are bullish. Offsets come from weak global breadth, as the ACWI technical scorecard is bearish, and external demand risks, with the China PMI indicator bearish. We are modestly overweight.
Commentary: The Japanese yen recently slid to a one-month low, nearing 149 per dollar, amid political instability following the resignation of ruling party secretary general Hiroshi Moriyama and mounting pressure on Prime Minister Shigeru Ishiba after an election loss. Key successor contender Sanae Takaichi supports low-interest rates. Bank of Japan Governor Kazuo Ueda reiterated that rate hikes remain off the table as long as growth and inflation continue to meet expectations. In economic indicators, the S&P Global Japan Manufacturing PMI was downgraded to 49.7 in August, marking the 13th consecutive contraction in 14 months due to declining output and falling sales, particularly foreign sales, which were affected by U.S. tariffs. Conversely, the S&P Global Japan Services PMI rose to 53.1, signaling growth for a fifth consecutive month, driven by a surge in new orders. However, foreign demand continued to weaken, affecting staffing levels and overall pricing power despite an improvement in business confidence.
Figure 6: Sentiment continues to improve from recent extreme pessimism levels. This is constructive.
Switzerland: Switzerland’s composite model is negative. Trend and momentum signals are negative: the moving average cross, cross-sectional 50-day momentum, and moving average slope all indicate a bearish trend. Breadth is a positive outlier, with a 200-day moving average breadth that is bullish. Yield factors support the case: relative dividend yield and relative 10-year yield are bullish. However, relative ETF fund flows are bearish, pointing to weak demand. Overall, negative trends and flows offset supportive breadth and yields, mandating an underweight position.
Commentary: In August, the Swiss investors’ sentiment index plummeted by 56.2 points to -53.8, reflecting heightened pessimism after a brief positive spike in July. This decline, the lowest since November 2022, is primarily attributed to the 39% U.S. tariffs on Swiss exports, which account for approximately 17% of the nation’s total exports. Analysts anticipate further weakening of Swiss exports over the next six months, as the related sub-index dropped sharply to -89.8. The KOF Economic Barometer also fell to 97.4, driven down by negative trends in manufacturing and hospitality amid ongoing tariff pressures. Conversely, the Swiss PMI experienced a slight uptick to 49.0, remaining below the growth threshold for the 32nd consecutive month, with improvements in production and order books. Nonetheless, challenges such as declining employment and purchasing volumes reveal persistent weakness in demand, leaving overall business confidence relatively subdued.
Figure 7: Momentum has been exceedingly weak but is at levels historically consistent with major turns.
United Kingdom: The UK’s composite model overall message is negative. The trend is weak (a moving-average cross indicator is bearish), while the cross-sectional price momentum is bullish. Currency is a headwind as the GBP-USD relationship screens bearish. Valuation versus the world is also bearish, limiting support from multiples. Sentiment readings are constructive, with the DSI indicator showing a bullish trend. The credit backdrop is unsupportive, as UK option-adjusted spreads indicate a bearish outlook. Net result: momentum helps, but trend, FX, valuation, and credit mandate a modestly underweight allocation.
Commentary: The Bank of England reduced interest rates by 25 basis points to 4%, the lowest since March 2023, following a notably divided vote. Five of the nine Monetary Policy Committee members supported this cut, while the other four favored maintaining the current rate. Governor Andrew Bailey characterized the decision as “finely balanced,” emphasizing the need for careful future reductions amid persistent inflation, which is anticipated to peak at 4% in September, and a weakening economy. Notably, growth forecasts for 2025 were raised to 1.25%. Meanwhile, the S&P Global UK Manufacturing PMI dropped to 47 in August 2025, marking the 11th consecutive contraction. In contrast, the S&P Global UK Services PMI rose to 54.2, indicating strong output growth and a rebound in new business, despite ongoing declines in employment. Input cost inflation surged, driven by rising raw material prices and National Insurance contributions, although it had only a partial impact on output charges.
Figure 8: Credit spreads in the U.K. are starting to widen a bit. We’re watching closely for signs that the trend extends.
Emerging Market Positions
Approximately 30% of the strategy is allocated across five markets from a pool of more than 20 smaller markets. Selection is based on a multifactor technical ranking system using trend and mean reversion indicators. The process seeks to identify oversold opportunities within the global equity markets that are likely to mean-revert from lower levels and exhibit mild pullbacks from long-term uptrends.
Current Holdings:
India
Poland
Malaysia
South Korea
Taiwan
Explore: Emerging Market Commentary
India: August brought a remarkable wave of economic dynamism. The HSBC Services PMI surged to 62.9, marking the fastest expansion in 15 years, fueled by booming domestic demand and increasing export orders. This robust activity lifted the Composite PMI to 63.2, a 17-year high, signaling broad-based momentum despite intensified cost pressures. Both input and output prices climbed sharply, reaching their steepest levels since the early 2010s. Manufacturing reflected this vigor, with the PMI rising to 59.3, the strongest level in nearly 18 years. At the August Monetary Policy Committee meeting, the central bank held the repo rate steady at 5.5%, striking a cautious balance between supporting growth and being vigilant over trade-related risks, particularly the looming 50% U.S. tariffs on exports.
Poland: Manufacturing activity remained in contraction but showed modest improvement, with the PMI inching up to 46.6 in August from July’s 45.9. This indicated continued weakness even as conditions slowly stabilized. Meanwhile, the central bank appeared poised for a modest easing move amid rising fiscal pressures. Analysts expected a 25-basis-point rate cut, but concerns over swelling deficits and public debt limited the potential for any aggressive policy shift. With government spending ramping up—particularly on defense and welfare—market watchers warned that fiscal looseness may restrict the scope for sustained monetary easing.
Malaysia: Business sentiment trended quietly upward. The Manufacturing PMI rose to 49.9 in August from 49.7, nearing the breakeven mark of 50 and indicating a gradual pickup in demand both domestically and for exports. Foreign reserves climbed to a 10-year high of U.S. $122 billion by mid-August, reinforcing external resilience and bolstering investor confidence. Economists anticipated that Bank Negara Malaysia would hold its policy rate steady at 2.75%, likely maintaining this level through 2027 due to soft inflation and stable growth expectations.
South Korea: Factory conditions contracted for the seventh consecutive month, although the Manufacturing PMI edged up to 48.3 in August from July’s 48.0—still firmly below the 50-point threshold. Inflation eased significantly to a nine-month low, with the headline CPI dropping to 1.7% year-over-year, driven by lower energy and communication costs. Reflecting persistent caution, the Bank of Korea held its benchmark rate at 2.50%, despite growing consensus for potential cuts. Challenges included high household debt and vulnerabilities in the property market, despite the central bank signaling an easing bias and modest growth forecast upgrades.
Taiwan: The manufacturing sector remained under pressure. The PMI improved to 47.4 in August from 46.2, but continued contraction reflected lingering trade policy uncertainty and subdued global demand. On the policy side, the central bank kept its main policy rate steady at 2.0%, with expectations of continued stability in the near term, supported by contained inflation. Notably, Taiwan’s GDP growth forecast was raised sharply; exports are projected to increase by over 24%, with overall growth expected at 4.45% for 2025, underscoring resilience in chip and AI-server demand despite external headwinds.
Catastrophic Stop Model
The Catastrophic Stop model combines time-tested, objective indicators designed to identify high-risk periods for the equity market. The model entered September recommending a fully invested equity allocation relative to the benchmark.
The DH Catastrophic Stop model level is 50%, indicating that investors should maintain their benchmark equity exposure.
Our perspective remained relatively unchanged over the month of August. The excessive optimism noted four weeks ago has slightly moderated, and we have been anticipating a consolidation phase as sentiment and technical indicators trended toward more normalized levels. We will closely monitor overbought and oversold conditions to identify potential reversals before issuing new buy signals.
Balancing modestly higher bond yields, ongoing political and Fed policy uncertainty (though leaning more dovish), tech and AI stock weakness, tariff-related volatility, seasonal September risk, potential Fed rate cuts, broad corporate earnings strength, solid consumer spending, still-good capital flows into ETFs (mostly by retail), and safe-haven inflows (like gold, signaling defense) ultimately leads to the same conclusion: Some excesses still need to be worked down, but given the better economic outlook, supported by corporate earnings forecasts, we currently don’t expect an extended decline. Should our models shift more negatively, we will quickly move to reduce risk.
The weight of the evidence suggests that any weakness is unlikely to extend into a significant downtrend at this time. Of course, if our model flips negative (below 40% for two consecutive days), signaling more substantial problems, we will raise cash immediately.
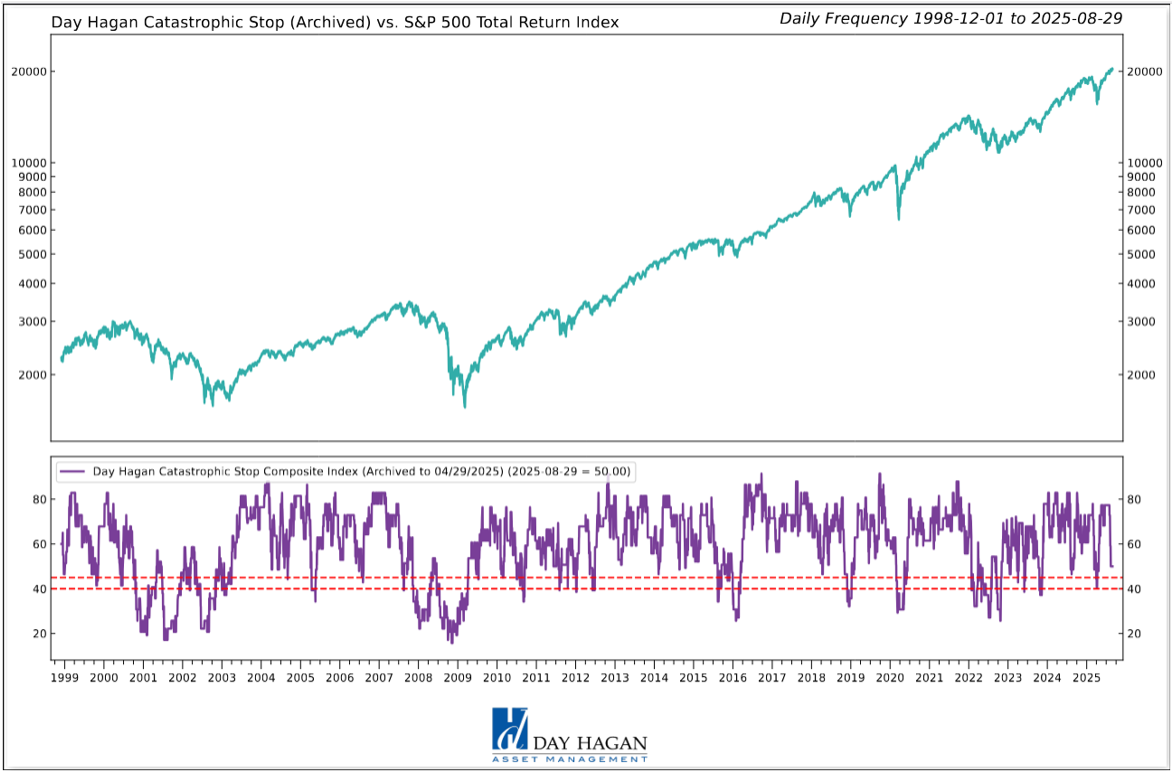
Figure 9: The Catastrophic Stop model recommends a fully invested equity position (relative to the benchmark). Due to the use of indices to extend model history, the model is considered hypothetical.
The Day Hagan Daily Market Sentiment Composite remains on a sell signal, reflecting a shift in investor sentiment from excessive optimism to a neutral stance. Historically, this transition acts as a headwind for equities until excessive optimism subsides, typically indicated by a drop below the 30 threshold, which signals the transition into excessive pessimism.
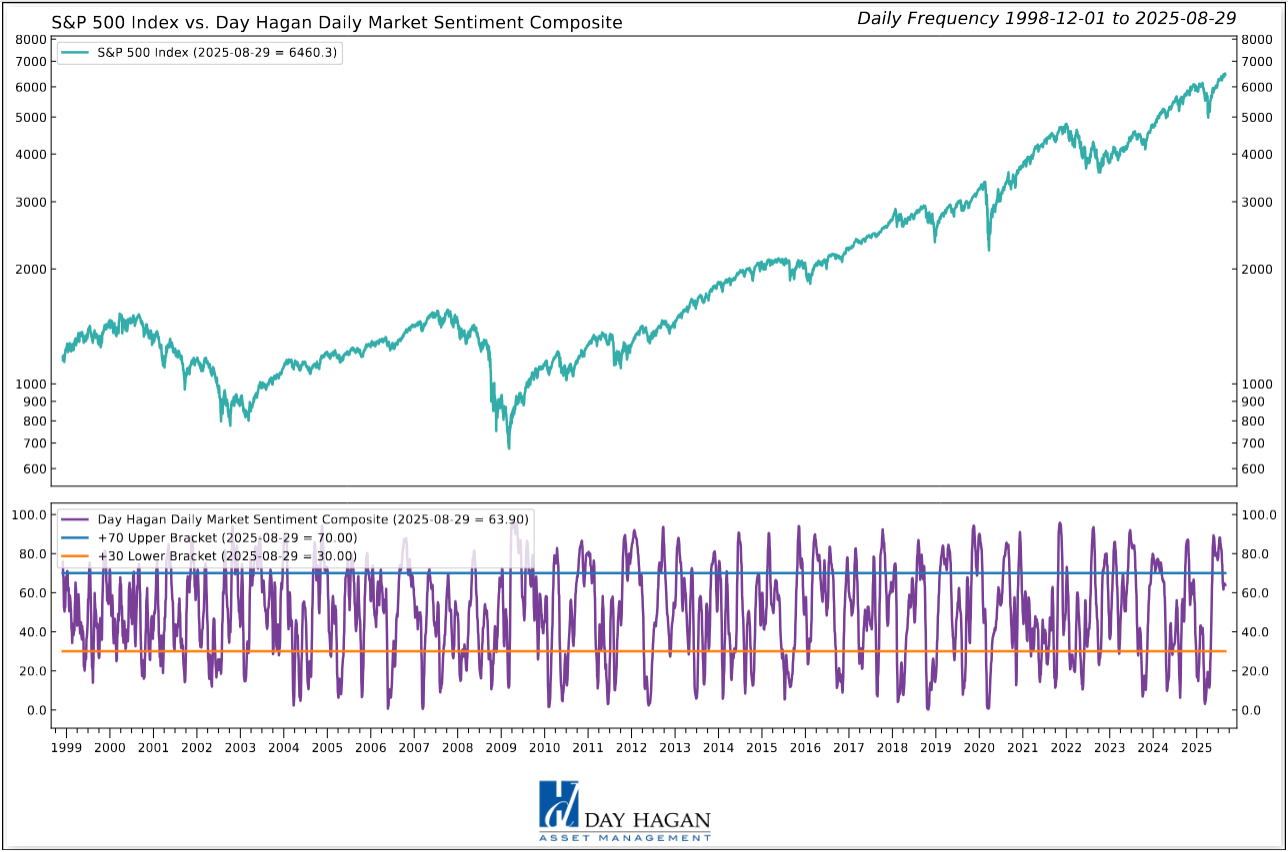
Figure 10: Investor sentiment is being reset as illustrated by the DH Daily Market Sentiment Composite declining below 70. A decline below 30 would be a nice setup for a year-end rally.
This strategy utilizes measures of price, valuation, economic trends, monetary liquidity, and market sentiment to make objective, rational, and unemotional decisions about how much capital to place at risk and where to allocate that capital.
For more information, please contact us at:
Day Hagan Asset Management
1000 S. Tamiami Trl
Sarasota, FL 34236
Toll Free: (800) 594-7930
Office Phone: (941) 330-1702
Website: https://dayhagan.com or https://dhfunds.com
© 2025 Day Hagan Asset Management
This material is for educational purposes only. Further distribution is prohibited without prior permission. Please see the information on Disclosures and Fact Sheets here: https://dhfunds.com/literature. Charts with models and return information use indices for performance testing to extend the model histories, and they should be considered hypothetical. All Rights Reserved. (© Copyright 2025 Day Hagan Asset Management.)
Day Hagan Smart Sector® International ETF
Symbol: SSXU
Strategy Description
The Smart Sector® International strategy combines three quantitative investment strategies: Core International, Explore International, and Catastrophic Stop.
The Process Is Based On The Weight Of The Evidence
Core Allocation
The fund begins by overweighting and underweighting the largest non-U.S. equity markets based on proprietary models.
Each of the models utilizes market-specific, weight-of-the-evidence composites of fundamental, economic, technical, and behavioral indicators to determine each area’s probability of outperforming the ACWI, for example. U.S. Markets are weighted accordingly relative to benchmark weightings.
Explore Allocation
To select smaller markets, the fund uses a multi-factor technical ranking system to choose the top markets. The markets with the highest rankings split the non-core model allocation equally.
When Market Risks Become Extraordinarily High — Reduce Your Portfolio Risk
The model remains fully invested unless the Catastrophic model is triggered, whereupon the equity-invested position may be trimmed by up to 50%.
The Catastrophic Stop model combines time-tested, objective indicators designed to identify periods of high risk for the broad U.S. equity market. The model uses price-based, breadth, deviation from trend, fundamental, economic, interest rate, behavioral, and volatility-based indicator composites.
When Market Risks Return To Normal — Put Your Money Back To Work
When the Catastrophic Stop model moves back to bullish levels, indicating lower risk, the strategy will reverse toward being fully invested.
Disclosures
The data and analysis contained within are provided "as is" and without warranty of any kind, either express or implied. The information is based on data believed to be reliable, but it is not guaranteed. Day Hagan DISCLAIMS ANY AND ALL EXPRESS OR IMPLIED WARRANTIES, INCLUDING, BUT NOT LIMITED TO, ANY WARRANTIES OF MERCHANTABILITY, SUITABILITY, OR FITNESS FOR A PARTICULAR PURPOSE OR USE. All performance measures do not reflect tax consequences, execution, commissions, and other trading costs, and as such, investors should consult their tax advisors before making investment decisions, as well as realize that the past performance and results of the model are not a guarantee of future results. The Smart Sector® Strategy is not intended to be the primary basis for investment decisions and the usage of the model does not address the suitability of any particular in Fixed Income vestment for any particular investor.
Using any graph, chart, formula, model, or other device to assist in deciding which securities to trade or when to trade them presents many difficulties and their effectiveness has significant limitations, including that prior patterns may not repeat themselves continuously or on any particular occasion. In addition, market participants using such devices can impact the market in a way that changes the effectiveness of such devices. Day Hagan believes no individual graph, chart, formula, model, or other device should be used as the sole basis for any investment decision and suggests that all market participants consider differing viewpoints and use a weight-of-the-evidence approach that fits their investment needs.
Past performance does not guarantee future results. No current or prospective client should assume future performance of any specific investment or strategy will be profitable or equal to past performance levels. All investment strategies have the potential for profit or loss. Changes in investment strategies, contributions or withdrawals and economic conditions may materially alter the performance of your portfolio. Different types of investments involve varying degrees of risk, and there can be no assurance that any specific investment or strategy will be suitable or profitable for a client’s portfolio. Historical performance results for investment indexes and/or categories generally do not reflect the deduction of transaction and/or custodial charges or the deduction of an investment management fee, the incurrence of which would have the effect of decreasing historical performance results. There can be no assurances that a portfolio will match or outperform any particular benchmark.
Day Hagan Asset Management is registered as an investment adviser with the United States Securities and Exchange Commission. SEC registration does not constitute an endorsement of the firm by the Commission nor does it indicate that the adviser has attained a particular level of skill or ability.
There may be a potential tax implication with a rebalancing strategy. Re-balancing involves selling some positions and buying others, and this activity results in realized gains and losses for the positions that are sold. The performance calculations do not reflect the impact that paying taxes would have, and for taxable accounts, any taxable gains would reduce the performance on an after-tax basis. This reduction could be material to the overall performance of an actual trading account. Day Hagan does not provide legal, tax or accounting advice. Please consult your tax advisor in connection with this material, before implementing such a strategy, and prior to any withdrawals that you make from your portfolio.
There is no guarantee that any investment strategy will achieve its objectives, generate dividends or avoid losses.
© 2025 Day Hagan Asset Management
