
Day Hagan Smart Sector® with Catastrophic Stop Strategy Update September 2025
A downloadable PDF copy of the Article:
Day Hagan Smart Sector® with Catastrophic Stop Strategy Update September 2025 (pdf)
Executive Summary
In August, sector narratives were shaped by tariffs, macroeconomic indicators, earnings revisions, and interest rate developments. Overall, the tariff landscape tightened as several actions taken earlier in the summer resulted in a higher effective tariff burden by early August.
Analysts estimated a historically elevated average tariff rate, and late in the month, the elimination of the U.S. de minimis exemption introduced additional uncertainty for online retail supply chains and discretionary importers. For cyclicals, manufacturing posed a challenge as the ISM Manufacturing PMI remained in contraction for August. While new orders showed improvement, production weakened, creating pressure on sectors such as Industrials and certain Materials that were reliant on factory throughput. Additionally, Materials faced complications from policy issues concerning metals, as the U.S. imposed 50% tariffs on numerous copper-related imports, effective August 1, which raised input costs and procurement challenges.
In the Energy sector, the focus was more on supply dynamics. Surveys and official outlooks indicated increasing OPEC+ supply and expectations for softer oil balances, shifting attention toward inventory levels and guidance rather than price momentum.
In Consumer Discretionary and Communication Services, trends were influenced by July retail sales data (released on August 15), which indicated steady demand for goods. However, finalized tariff changes and shipping challenges created planning risks for e-commerce-focused categories and advertising expenditures.
The Technology (Information Technology) sector experienced mixed results: while Q2 earnings reports initially provided a positive revision outlook in early August, rising policy uncertainty and late month focus on policy direction dampened risk appetite ahead of Jackson Hole.
Financials and rate-sensitive sectors (Real Estate and Utilities) were influenced by bond market movements, with 10-year Treasury yields declining throughout August. This trend benefited duration-heavy sectors but raised concerns about net interest margins for lenders.
Health Care followed a similar trajectory, reacting to the duration trend and updates on company guidance. There were few sector-specific macro shocks, aside from headlines concerning reimbursement and drug pipeline developments.
Consumer Staples remained stable due to a defensive stance as companies evaluated their ability to pass through costs amid the changing tariff environment.
Finally, the overall macroeconomic tone shifted around Jackson Hole on August 22, where the Federal Reserve emphasized the importance of its framework and highlighted labor market risks. Combined with soft inflation figures published on August 12, this maintained the potential for a September easing, which would support long-duration sectors (Tech, Health Care, Real Estate, and Utilities), while cyclical leadership remained dependent on order volumes and clarity in trade policies.
Holdings
Sector
Consumer Discretionary
Consumer Staples
Communication Services
Energy
Financials
Health Care
Industrials
Information Technology
Materials
Real Estate
Utilities
Outlook (relative to benchmark weighting)
Neutral
Neutral
Modest Overweight
Underweight
Neutral
Neutral
Modest Underweight
Neutral
Underweight
Underweight
Neutral
Sector Review
Consumer Discretionary: The composite model is neutral. On the positive side, various relative-strength signals are broadly constructive. Indicators such as short-term moving average crosses, price deviation from trend, relative momentum, and overbought/oversold conditions are bullish. Additionally, metrics such as the 120-day net new highs, relative forward P/E ratios, consumer credit, and housing starts reinforce the optimism, suggesting strong breadth, healthy valuation, and supportive macroeconomic conditions. However, on the negative side, the “higher for longer” 30-year Treasury yield is bearish, indicating potential duration headwinds that could pose challenges. Meanwhile, discretionary spending remains neutral, suggesting that demand does not align with the prevailing signals. In summary, while the overall setup is positive, it is essential to closely monitor rate sensitivity in the near term.
Commentary: On August 29, the U.S. ended the de minimis exemption, which increased import frictions for online retailers and marketplaces. Demand signals remained steady, as evidenced by the Census Bureau’s report on August 15, which indicated that July retail sales rose by 0.5% month-over-month. This data supported positive results from big-box retailers and off-price stores, although consumer sentiment weakened as the month drew to a close. Results from major companies were critical to the sector’s performance. Amazon reported Q2 revenue of $167.7 billion, with continued growth in Amazon Web Services (AWS), which focused on AI investment and maintaining retail margin discipline. Home Depot announced $45.3 billion in sales along with positive U.S. comparable sales, while Lowe’s reported $24 billion in sales and revealed plans to acquire Foundation Building Materials to enhance their professional exposure. Off-price retail continued to show strength, as TJX Companies recorded a 4% increase in comparable sales and raised its guidance. In the restaurant sector, McDonald’s reiterated plans to open approximately 2,200 locations in 2025 while noting tariff-related cost pressures. Conversely, Starbucks discussed its turnaround efforts despite a 2% decline in global comparable sales. In the automotive sector, Tesla expanded its robotaxi operations in Austin late in the month, keeping the focus on autonomy and regulatory scrutiny.
Figure 1: Relative price momentum continues to favor the Consumer Discretionary sector.
Consumer Staples: The composite model is mixed. On the positive side, several factors indicate constructive conditions, including mean-reversion and sponsorship metrics. Indicators such as the normalization of overbought/oversold conditions, relative net new highs, and tighter financial conditions—evidenced by the Chicago Fed National Financial Conditions Index—suggest improving market breadth and demand. Additionally, robust food sales and a decrease in relative short interest further enhance this optimistic perspective. Conversely, there are significant negative signals. Trend and macro indicators are weak, characterized by concerning trends such as moving-average crossovers, declines in relative momentum, deviations from established trends, and less favorable 45-day breadth readings. Moreover, rising food CPI, sector sales yields, and G10 surprises all appear to skew bearish, indicating a deterioration in trend strength, potential margin pressure, and negative macro surprises.
Commentary: The most significant policy change occurred with the end of the U.S. de minimis exemption on August 29, which has increased import frictions and potential costs for staple supply chains and cross-border e-commerce channels. During August, discount retailers and mass merchants reported resilient demand and digital growth. For instance, Walmart’s August 21 report showed a 5.6% increase in sales in constant currency, along with a 25% rise in global e-commerce, indicating strong defensive strategies and effective product mix management. Costco also demonstrated ongoing momentum in its club formats. In its August 6 update, the company reported strong sales in July and double-digit growth in e-commerce, highlighting the durability of traffic and membership as summer came to a close. In the beverage sector, companies focused on brand investment and pricing strategies. An August report reiterated Coca-Cola’s 5% organic revenue growth for the second quarter and optimism regarding its targets for 2025, while emphasizing the importance of marketing efficiency and local execution. However, the confectionery and snacks sector faced challenges due to cocoa inflation. Mondelez’s August 13 update indicated a projected decline of approximately 10% in adjusted EPS for 2025 (in constant currency), despite ongoing pricing strategies and productivity efforts. This situation highlights the importance of considering cost pass-through and consumer elasticity.
Figure 2: The relative breadth of Consumer Staples remains in a downtrend.
Communication Services: The signals are generally supportive, with several indicators pointing toward a positive outlook. The relative price moving average crossover, deviation from trend, and the overbought/oversold indicators (Set I) all suggest bullish tendencies, indicating a favorable trend and the potential for mean reversion. Additionally, macroeconomic and valuation indicators are positive, particularly the 10-year to 2-year yield curve and the relative earnings yield. There are no negative factors to note at this time. However, the overbought/oversold indicators (Set II) are neutral, which may indicate a bit of overexuberance. Overall, sector relative strength leans positively across trend, macroeconomic, and valuation factors, and we will continue to monitor for confirmation through earnings revisions and market breadth.
Commentary: Communication services in August focused on three main themes: platform safety and policy updates, advertising market product enhancements, and investors analyzing recent earnings reports. Meta implemented tighter safety measures for its AI assistants aimed at teens following reports of concerning chatbot behaviors. The company mentioned that additional long-term solutions are being developed to address these issues, while keeping regulatory scrutiny and engagement quality in mind. In terms of product offerings, Alphabet aimed to strengthen its advertising capabilities. Google introduced new targeting features for its Performance Max campaign, and YouTube added enhanced “Promote” calls-to-action. These changes indicate a concerted effort to direct advertising budgets toward Google’s platforms as the fall advertising cycle approaches. In August, Alphabet also released its widely reported Q2 results, showing 14% revenue growth to $96.4 billion. This growth reinforces demand across Search, YouTube, and Cloud services as marketers consider their spending for the second half of the year. Netflix’s coverage in August highlighted an optimistic outlook for 2025, driven by member growth and an expanding advertising business. Trade publications noted the traction of its ad-supported tier and advancements in in-house advertising technology across various markets. However, the macroeconomic signals for advertisers remained mixed. While the manufacturing sector continued to contract in August, Google’s late-month global spam update introduced some short-term fluctuations in search traffic that performance marketers needed to monitor. Overall, the key drivers in August were Meta’s safety modifications, Google’s enhancements to advertising products alongside strong Q2 performance, and Netflix’s growth narrative related to its ad-supported option, all occurring amid cautious macroeconomic conditions and ongoing regulatory scrutiny.
Figure 3: Perhaps surprisingly, the Communication Services sector is not at max overbought levels.
Energy: The composite model is negative. On the positive side, mean reversion and various supply metrics suggest supportive conditions; indicators such as overbought/oversold normalization, the relationship between crude prices and their simple moving averages (SMA) or Bollinger Bands, as well as relative strength compared to rig counts and crude days-of-supply, all point toward the potential for upside and tighter balances in the market. However, the negative signals from trend analysis and macroeconomic factors cannot be ignored. Key indicators, including the headline relative-strength gauge, five-month volatility, 150-day breadth, moving-average crossovers, free cash flow yield momentum, and the correlation to crude spot prices alongside the dollar trade-weighted index, indicate a bearish outlook. This suggests weak market participation and a potential drag from the dollar. Overall, while there are some supportive metrics, the prevailing tilt remains negative, signaling that improvements in market breadth and a re-acceleration of free cash flow are necessary for more bullish confirmation.
Commentary: Midway through August, the International Energy Agency (IEA) indicated a more supply-heavy outlook, as OPEC+ increased its output and non-OPEC supply grew. This development led to a reduction in demand growth forecasts, shifting the focus to supply-and-demand balances rather than price momentum. Later in the month, crude oil prices declined as traders anticipated softer U.S. demand following the driving season and projected additional barrels from OPEC+ in the autumn. The U.S. Energy Information Administration (EIA) reported that refinery runs were moderating as August came to a close, suggesting a cautious approach to product demand and margins. In terms of earnings, ExxonMobil’s August 1 release highlighted its second-quarter profits, strong operating cash flow, and continued distributions to shareholders, showcasing its efforts in both upstream and downstream operations. Chevron’s August 1 report also noted record production from the Permian Basin, the successful integration of Hess, and sustained cash returns, keeping the focus on U.S. shale operations. Among exploration and production companies, EOG Resources announced its second-quarter results on August 7, providing updated guidance for 2025 and emphasizing its commitment to capital discipline and returns. In the midstream sector, Williams Companies reported positive second-quarter results on August 4, raising its full-year guidance and highlighting strong gas demand and contracted cash flows. Additionally, pipeline developments garnered attention as Kinder Morgan’s SFPP unit announced an open season on August 18 to expand East Line capacity from El Paso to Tucson, indicating potential for increased refined product takeaway.
Figure 4: Profitability (cash flow trends) is still an issue for the Energy sector.
Financials: The current market setup presents a mixed-to-positive outlook, characterized by several supportive signals, including the normalization of overbought/oversold conditions and an encouraging trend in total returns. Factors such as lower sector volatility, favorable business credit conditions, tighter investment-grade option-adjusted spreads, and robust bank loan growth further bolster our optimistic stance. Additionally, the higher forward earnings yield and a supportive yield-curve profile contribute positively to the overall sentiment. However, trend-related issues and macroeconomic challenges impact our outlook, as evidenced by weak relative price trends, lackluster momentum, and concerning max drawdown metrics. Moreover, G10 economic surprises and a stronger trade-weighted dollar pose additional concerns that could impede progress. To solidify this mixed-to-positive setup, we anticipate the need for significant improvements in price trends and momentum before increasing exposure.
Commentary: The main focus for the month was on the potential for policy easing following the inflation data released in mid-August and the messaging from the Jackson Hole conference. These developments led to a shift in perspectives regarding net interest margins, deposit betas, and loan demand. Credit quality remained a concern, particularly as management highlighted trends in delinquency rates for credit cards and small businesses. The tone in the capital markets improved compared to early summer, which had a positive impact on advisory and underwriting fees. Major banks reported strong performances. JPMorgan showcased robust earnings across various segments, despite a normalization in revenue growth. Bank of America highlighted growth in net interest income, momentum in commercial loans, and investments in artificial intelligence. Meanwhile, Wells Fargo noted increased flexibility following developments with asset caps. Investment banks also indicated a strengthening in their pipelines. Goldman Sachs achieved solid revenues driven by mergers and acquisitions (M&A) activity and reached record levels in assets under supervision. Morgan Stanley emphasized the resilience of its wealth and investment management divisions. Payment networks continued to perform well, with Visa and Mastercard reporting double-digit revenue growth due to increased payment volumes and value-added services. American Express also recorded its highest revenues to date, supported by strong spending from cardmembers and anticipated product updates. Citi reported growth in revenue, maintained solid credit metrics, and had capacity for share buybacks. Overall, the key drivers for August included the trajectory of interest rates, stable yet monitored credit quality, gradually improving deal activity, and strong payment volume.
Figure 5: Business credit conditions pulled back over the first part of the year and have since been rebounding. Constructive for Financials.
Healthcare: The current market analysis of the healthcare sector indicates a neutral outlook. On the positive side, we see favorable relative price trends, momentum, and strong sector book yields, indicating potential improvement in relative strength. Conversely, the weak 100-day relative breadth, risks from maximum relative drawdown, and challenges linked to healthcare personal expenditures highlight demand risks that cannot be ignored. New construction data offers a neutral view, suggesting stability but lacking strong bullish support. While our overall bias is positive, confirming this outlook requires breadth repair and stabilization of spending metrics. We will closely monitor earnings revisions, utilization rates, and payer mix as key signals before considering a substantial increase in our active weight in the sector.
Commentary: The health care sector was influenced by the momentum of GLP-1 therapies, managed-care cost pressures, and regulatory signals. Eli Lilly raised its full-year sales and earnings per share guidance after reporting strong second-quarter demand for incretin therapies. Both Mounjaro and Zepbound exceeded expectations, keeping obesity and diabetes treatments at the center of the sector’s narrative and capital allocation. Amgen’s second-quarter results, released on August 5, showed a 9% revenue growth and demonstrated broad product strength, reinforcing a stable earnings base for large-cap biopharma as we head into the fall catalyst calendar. Additionally, AbbVie reported its second-quarter results on August 4 and raised its 2025 outlook. Growth in immunology and neuroscience products, such as Skyrizi and Rinvoq, as well as its migraine portfolio, has helped offset losses from older treatments, supporting the case for improving earnings revisions across select pharmaceutical companies. On the payer side, Medicare Advantage remains a challenge, as management noted higher care intensity and elevated medical loss ratios. This situation keeps investors focused on remediation plans and pricing strategies for 2026. Regulatory developments have also provided catalysts; the FDA approved additional oncology therapies in August, creating new opportunities for pipelines and near-term launches, which may influence deal activity and research and development priorities as we approach year-end. In summary, the key drivers for the sector in August were centered around the expansion of obesity and diabetes treatments, mixed yet stabilizing earnings for large-cap pharmaceuticals, challenges with cost normalization for Medicare Advantage insurers, and ongoing FDA approvals.
Figure 6: As discussed last month, the Health Care sector is oversold. We’re noting signs of a reversal.
Industrials: The composite model is modestly negative. Trend and quality metrics raise concerns, as relative price momentum has deteriorated, and both cash-flow yield and sales yield factors are lagging. Additionally, the linkage to oil futures presents a downside risk. Factors supporting the sector include lower sector volatility, improving relative strength index (RSI), a decrease in 210-day new lows, a supportive CRB linkage, rising consumer confidence, a softer trade-weighted dollar, and stronger industrial production. However, for longer-term leadership, we require trend repair alongside improved cash flow and revenue efficiency, complemented by confirmed breadth improvement.
Commentary: The aerospace sector provided a strong foundation: General Electric reported a 23% increase in revenue, primarily driven by the aerospace sector, and raised its full-year guidance. RTX achieved 9% organic sales growth due to robust orders in defense and commercial sectors but lowered its earnings per share (EPS) outlook to account for higher tariff costs. Boeing generated $22.7 billion in revenue and highlighted its progress in stabilizing the 737 and 787 programs, maintaining focus on delivery schedules and regulatory milestones. In the multi-industry arena, performance remained stable, with Honeywell reporting a 5% increase in organic sales and raising its guidance, driven by demand in automation, aerospace services, and building technologies. The transportation and logistics sectors indicated healthy volumes and capital returns: Uber reached new highs in audience and frequency, achieving 18% growth in trips and gross bookings, while also authorizing a $20 billion stock repurchase. Union Pacific reported record freight revenue and returned $4.3 billion to shareholders, reflecting resilient industrial flows despite external policy challenges. Heavy equipment commentary pointed to pricing and backlog support, with Caterpillar noting strong operations despite the ongoing impact of tariffs. Energy-related services and operational software also received attention, with ADP reporting an 8% increase in revenue and providing positive fiscal guidance for 2026.
Figure 7: Valuation based on cash flow yield is becoming more expensive (lower yield = more expensive).
Information Technology: The current market analysis shows a mildly positive tilt driven by relative momentum, longer-term overbought/oversold indicators, sales yield, inflation expectations linkage, and lower relative short interest. These factors support trend persistence, valuation carry, macro sensitivity, and enhanced positioning. However, caution is warranted due to the first set of overbought/oversold indicators and bearish earnings-revision breadth, suggesting a potential for near-term mean reversion and weaker fundamental follow-through. Overall, the market sentiment remains positive concerning price, carry, and positioning. To confirm this outlook, we need to see improved earnings revisions and broader market participation.
Commentary: Toward the end of the month, a noticeable shift away from large-cap technology stocks occurred as investors processed Chair Powell’s comments from the Jackson Hole event. This shift also favored small-cap stocks, highlighting the sector’s sensitivity to valuations in companies with long-duration software and semiconductor businesses. On the fundamental side, Nvidia announced a record quarter with $46.7 billion in revenue, driven by strong demand in the data center sector. Despite challenges related to exposure in China and ongoing supply chain and export policy risks, Nvidia indicated sustained demand for AI technologies. In the networking and AI sectors, Cisco’s results from August 13 and its FY26 outlook showcased stable demand for infrastructure upgrades related to AI and increased cloud traffic. Meanwhile, Marvell reported record revenue and a positive outlook, emphasizing the momentum for data centers and the demand for custom silicon and optics. Additionally, infrastructure spending on AI has translated into server upgrades, as demonstrated by Dell’s record quarterly revenue. The company reported significant growth in AI server shipments and backlog, indicating that enterprise AI deployments are still in the early stages.
Figure 8: The Information Technology sector is now relatively oversold.
Materials: The current market analysis indicates a negative outlook. On the positive side, 90-day sector volatility is relatively tame. Silver momentum appears constructive, while natural gas exhibits potential for mean reversion. Additionally, the sales yield remains supportive, and industrial production in materials is firm. Conversely, there are notable negatives, including a downward-trending moving average cross and relative momentum indicators, as well as overbought conditions, alongside negative deviations from trend measures. The equity momentum linkage between emerging and developed markets remains weak, with both copper and gold momentum showing softness, and the earnings yield is unfavorable. Overall, the bias leans negative despite some cyclical support. Confirmation of a more positive outlook will require trend repair, enhanced commodity momentum, and improved valuations.
Commentary: In the chemicals and coatings sector, Sherwin-Williams lowered its full-year earnings guidance due to weak demand and an accelerated cost-cutting initiative. Meanwhile, Ecolab achieved double-digit earnings growth driven by value pricing and strong momentum in its core markets. In the industrial gases sector, Air Products exceeded expectations, highlighting its effective cost reduction and digital initiatives. In metals and mining, Freeport-McMoRan reported robust results, attributing this success to significant copper sales and the commissioning of its new smelter in Indonesia, which represents a key milestone in supply and margins. Additionally, Newmont produced 1.5 million ounces of gold and generated $2.4 billion in cash flow, underscoring its ability to generate cash from gold as interest rate expectations changed throughout the month. The aggregates and heavy materials sector demonstrated resilient demand in infrastructure and non-residential projects. Martin Marietta achieved record results and raised its full-year EBITDA guidance despite facing challenging weather conditions. Similarly, Vulcan Materials reported improved EBITDA and cash flow while reaffirming its guidance. Overall, management commentary across these companies emphasized the importance of productivity, disciplined capital management, and selective pricing strategies to counterbalance input and logistics costs, which remain influenced by trade policies and fuel prices.
Figure 9: Historically, better equity performance in Emerging Markets has been bullish for the Materials sector. However, there are signs that DM is gaining ground and EM is rolling over.
Real Estate: The composite model is negative. On the positive side, both participation and macro sensitivity have shown improvement, evidenced by a higher percentage of positive days and a bullish trend in the 50-day relative breadth. Additionally, the linkage to unemployment and sensitivity to the 30-year yield support relative performance, while the economic surprise index remains favorable. However, the trend remains weak, as both relative price trends and deviations from the norm exhibit bearish signals. There is also underperformance relative to homebuilders, along with headwinds from construction supply (a segment of industrial production data), and NFIB small-business credit conditions. We are modestly underweight.
Commentary: The real estate sector responded to changes in interest rates, data center demand, and updates in retail leasing. The Jackson Hole meetings raised the odds of rate cuts and lowered Treasury yields toward the end of the month, which benefited duration-sensitive Real Estate Investment Trusts (REITs). In terms of demand for digital infrastructure, signs of strength remained. Equinix announced partnerships focused on clean energy to support AI-ready capacity and was later recognized as a leader in IDC’s global colocation assessment. Digital Realty also highlighting sustained needs for hyperscale and interconnection. Regarding earnings, retail real estate showed positive trends: Simon Property Group reported higher quarterly Funds From Operations (FFO) and raised its full-year guidance due to robust leasing activity, while also increasing its dividend. The performance of net lease properties remained steady, as detailed in Realty Income’s August report, which outlined operating results and rent recaptures, indicating ample liquidity to support ongoing activities. Diversified services displayed strong results, with JLL announcing its fifth consecutive quarter of double-digit revenue growth and improved earnings per share (EPS), reflecting better transaction and advisory trends. Additionally, broader property fundamentals improved, as CBRE highlighted significant net absorption gains in the multifamily sector during Q2, ahead of the late-summer leasing season.
Figure 10: Credit conditions for small businesses are still positive but becoming less so. A reversal indicating improving conditions would support additional exposure.
Utilities: The composite model is neutral. On the positive side, relative momentum improved, coupled with a potential for mean reversion. Supportive indicators, such as PMI manufacturing and capacity utilization, suggest a more favorable environment, and an attractive dividend yield enhances defensive characteristics and carry potential. However, there are notable bearish signals, including moving-average crosses and percent reversals. Overbought/oversold conditions (set II), along with negative metrics from 50-day breadth, crude oil linkages, earnings yield versus the 10-year spread, and the copper/gold ratio, indicate a weak trend and limited participation amidst macroeconomic headwinds. The overbought/oversold status (set I) remains inconclusive. Overall, the bias leans negative, and confirmation of a more bullish stance will require improvement in breadth and a stronger rate-adjusted yield profile.
Commentary: The release of softer U.S. CPI for July on August 12 sparked a wave of optimism, boosting expectations for a September Fed cut and driving down Treasury yields. This development is particularly beneficial for rate-sensitive regulated utilities. Chair Powell’s remarks at Jackson Hole later in the month reinforced this easing sentiment, leading to declines in 2- and 10-year yields that further support long-duration cash-flow profiles. Earnings updates throughout August added an encouraging tone. Dominion Energy kicked off the month by reaffirming its 2025 guidance alongside solid Q2 results, demonstrating its commitment to its capital plans and balance-sheet goals. Similarly, Duke Energy shared insights on its regulated growth and strategic execution during its Q2 report on August 5. Constellation’s strong results on August 7 showcased impressive operating earnings and momentum, notably with a landmark 20-year offtake agreement with Meta, emphasizing the vital role of nuclear energy in providing reliable, carbon-free power. Sempra also reported steady adjusted earnings and advancements in its regulated and LNG-linked infrastructure. Vistra Corp. rounded out the updates on August 7, delivering robust profits and cash flow while reiterating its 2025 EBITDA and free cash flow guidance, maintaining its focus on retail and generation integration, as well as planned renewable energy expansion.
Figure 11: The Utilities sector shows signs of reversing from longer-term overbought levels.
Catastrophic Stop Update
The Catastrophic Stop model combines time-tested, objective indicators designed to identify high-risk periods for the equity market. The model entered September recommending a fully invested equity allocation relative to the benchmark.
The DH Catastrophic Stop model level is 50%, indicating that investors should maintain their benchmark equity exposure.
Our perspective remained relatively unchanged over the month of August. The excessive optimism noted four weeks ago has slightly moderated, and we have been anticipating a consolidation phase as sentiment and technical indicators trended toward more normalized levels. We will closely monitor overbought and oversold conditions to identify potential reversals before issuing new buy signals.
Balancing modestly higher bond yields, ongoing political and Fed policy uncertainty (though leaning more dovish), tech and AI stock weakness, tariff-related volatility, seasonal September risk, potential Fed rate cuts, broad corporate earnings strength, solid consumer spending, still-good capital flows into ETFs (mostly by retail), and safe-haven inflows (like gold, signaling defense) ultimately leads to the same conclusion: Some excesses still need to be worked down, but given the better economic outlook, supported by corporate earnings forecasts, we currently don’t expect an extended decline. Should our models shift more negatively, we will quickly move to reduce risk.
The weight of the evidence suggests that any weakness is unlikely to extend into a significant downtrend at this time. Of course, if our model flips negative (below 40% for two consecutive days), signaling more substantial problems, we will raise cash immediately.
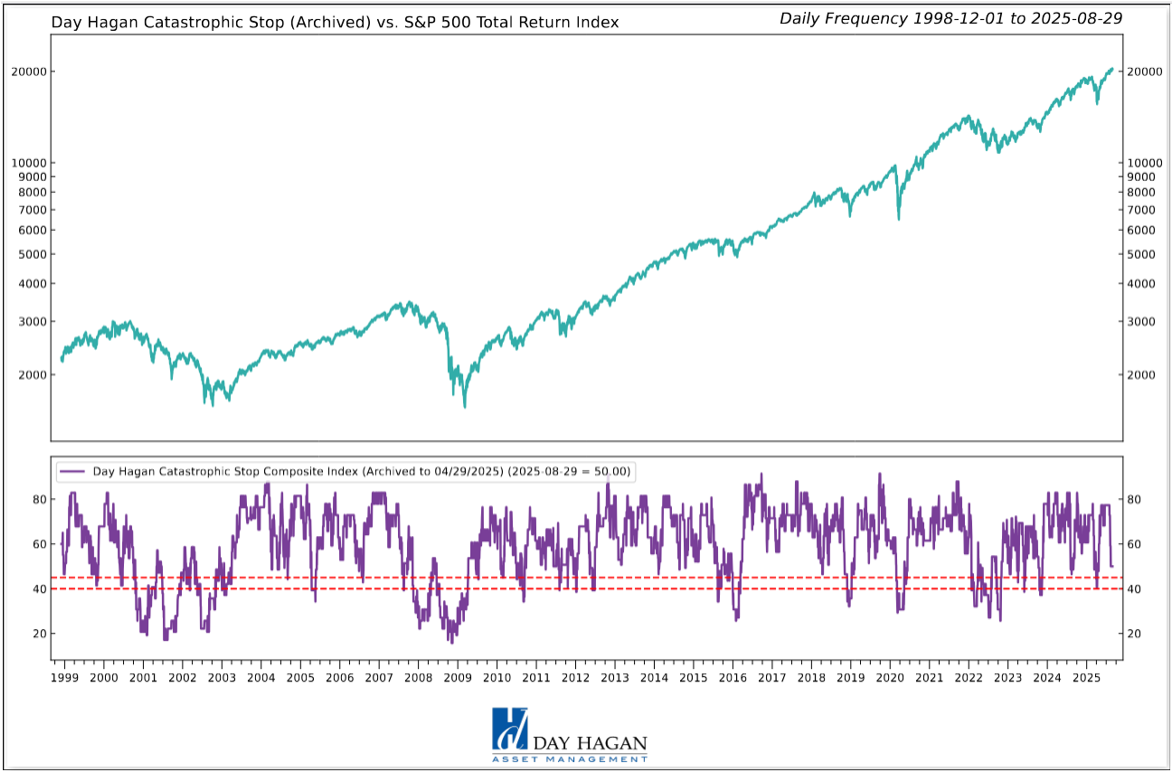
Figure 12: The Catastrophic Stop model recommends a fully invested equity position (relative to the benchmark). Due to the use of indices to extend model history, the model is considered hypothetical.
The Day Hagan Daily Market Sentiment Composite remains on a sell signal, reflecting a shift in investor sentiment from excessive optimism to a neutral stance. Historically, this transition acts as a headwind for equities until excessive optimism subsides, typically indicated by a drop below the 30 threshold, which signals the transition into excessive pessimism.
Figure 13: Investor sentiment is being reset as illustrated by the DH Daily Market Sentiment Composite declining below 70. A decline below 30 would be a nice setup for a year-end rally.
Our goal is to stay on the right side of the prevailing trend, introducing risk management when conditions deteriorate. Currently, the uptrend remains intact. The broader-based composite models calling U.S. economic growth, international economic growth, inflation trends, liquidity, and equity demand remain constructive. The Catastrophic Stop model is positive, and we are aligned with the message. If our models shift to bearish levels, we will raise cash.
This strategy utilizes measures of price, valuation, economic trends, monetary liquidity, and market sentiment to make objective, rational, and unemotional decisions about how much capital to allocate and where to invest that capital.For more information, please contact us at:
Day Hagan Asset Management
1000 S. Tamiami Trl
Sarasota, FL 34236
Toll Free: (800) 594-7930
Office Phone: (941) 330-1702
Website: https://dayhagan.com or https://dhfunds.com
This material is for educational purposes only. Further distribution is prohibited without prior permission. Please see the information on Disclosures and Fact Sheets here: https://dhfunds.com/literature. Charts with models and return information use indices for performance testing to extend the model histories, and they should be considered hypothetical. All Rights Reserved. (© Copyright 2025 Day Hagan Asset Management.)
Day HaganSmart Sector®
With Catastrophic Stop ETF
Symbol: SSUS
Disclosures
The data and analysis contained within are provided "as is" and without warranty of any kind, either express or implied. The information is based on data believed to be reliable, but it is not guaranteed. Day Hagan DISCLAIMS ANY AND ALL EXPRESS OR IMPLIED WARRANTIES, INCLUDING, BUT NOT LIMITED TO, ANY WARRANTIES OF MERCHANTABILITY, SUITABILITY, OR FITNESS FOR A PARTICULAR PURPOSE OR USE. All performance measures do not reflect tax consequences, execution, commissions, and other trading costs, and as such, investors should consult their tax advisors before making investment decisions, as well as realize that the past performance and results of the model are not a guarantee of future results. The Smart Sector® Strategy is not intended to be the primary basis for investment decisions and the usage of the model does not address the suitability of any particular in Fixed Income vestment for any particular investor.
Using any graph, chart, formula, model, or other device to assist in deciding which securities to trade or when to trade them presents many difficulties and their effectiveness has significant limitations, including that prior patterns may not repeat themselves continuously or on any particular occasion. In addition, market participants using such devices can impact the market in a way that changes the effectiveness of such devices. Day Hagan believes no individual graph, chart, formula, model, or other device should be used as the sole basis for any investment decision and suggests that all market participants consider differing viewpoints and use a weight-of-the-evidence approach that fits their investment needs.
Past performance does not guarantee future results. No current or prospective client should assume future performance of any specific investment or strategy will be profitable or equal to past performance levels. All investment strategies have the potential for profit or loss. Changes in investment strategies, contributions or withdrawals and economic conditions may materially alter the performance of your portfolio. Different types of investments involve varying degrees of risk, and there can be no assurance that any specific investment or strategy will be suitable or profitable for a client’s portfolio. Historical performance results for investment indexes and/or categories generally do not reflect the deduction of transaction and/or custodial charges or the deduction of an investment management fee, the incurrence of which would have the effect of decreasing historical performance results. There can be no assurances that a portfolio will match or outperform any particular benchmark.
Day Hagan Asset Management is registered as an investment adviser with the United States Securities and Exchange Commission. SEC registration does not constitute an endorsement of the firm by the Commission nor does it indicate that the adviser has attained a particular level of skill or ability.
There may be a potential tax implication with a rebalancing strategy. Re-balancing involves selling some positions and buying others, and this activity results in realized gains and losses for the positions that are sold. The performance calculations do not reflect the impact that paying taxes would have, and for taxable accounts, any taxable gains would reduce the performance on an after-tax basis. This reduction could be material to the overall performance of an actual trading account. Day Hagan does not provide legal, tax or accounting advice. Please consult your tax advisor in connection with this material, before implementing such a strategy, and prior to any withdrawals that you make from your portfolio.
There is no guarantee that any investment strategy will achieve its objectives, generate dividends or avoid losses.
© 2025 Day Hagan Asset Management
