
Day Hagan Smart Sector® Fixed Income Strategy Update September 2025
A downloadable PDF copy of the Article:
Day Hagan Smart Sector® Fixed Income Strategy Update September 2025 (pdf)
Executive Summary
In August, fixed-income assets were influenced by dovish monetary signals, tight credit spreads, and subdued auction results.
In the U.S., softer labor market data early in the month pushed yields lower as investors priced in increased odds of a Federal Reserve rate cut in September. Treasury auctions of 10- and 30-year maturities, however, revealed only modest demand, highlighting lingering concerns about heavy issuance and fiscal sustainability. The Fed’s Jackson Hole symposium crystallized the month’s narrative: Chair Powell announced a recalibrated framework, moving away from explicit “makeup” inflation strategies and restoring flexibility around its 2% target.
Globally, inflation trends remained sticky. U.S. core CPI hovered above 3%, while Euro-area inflation edged just above 2%. These levels constrained central banks, even as the ECB and Bank of Canada leaned further into rate cuts to support growth. Divergent policy paths have amplified currency volatility, adding complexity for international fixed-income investors.
Against this backdrop, corporate and high-yield spreads tightened to near historic lows, supported by strong earnings and solid refinancing activity. Emerging markets benefited from lower U.S. yields and renewed capital inflows, while TIPS gained modestly on stable inflation expectations.
The U.S. Treasury curve exhibited significant movements, starting with a weaker-than-expected labor report that triggered a bond rally, as markets anticipated Fed rate cuts beginning in September. Both short- and long-term yields fell, reflecting a post-quantitative easing era. The 10-year note auction on August 6 yielded 4.25%, with a median yield around 4.195%, and a modest allotment of 52.85%. The 30-year bond auction on August 7 yielded 4.75%, demonstrating similarly subdued demand with a bid-to-cover ratio of 2.27. These results highlight the cautious market appetite amid rising yields and increased issuance. Investment-grade corporate spreads tightened significantly, reaching their narrowest levels since 2002 at approximately 74 basis points, supported by strong earnings and easing recession fears.
In the high-yield space, the ICE BofA U.S. High Yield Constrained Index rose by about 1.22%, contributing to a year-to-date return of 6.25%. Spreads remained tight at approximately 284 basis points, bolstered by refinancing issuance and solid corporate fundamentals. Emerging market debt also showed positive returns, with hard-currency EM sovereign bonds up 1.53% and EM corporate bonds gaining roughly 1.29%, supported by inflows and declining U.S. Treasury yields. Inflation in the U.S. persisted above the Fed’s target at 2.86%, while euro-area inflation ticked up to about 2.1%.
Overall, the month illustrated robust cross-asset performance, underscoring the sensitivity of fixed income sectors to rate-cut expectations and credit valuation dynamics.
Holdings
Fixed Income Sector
US 1-3 Month T-bill
US 3-7 Year Treasury
US 10-20 Year Treasury
TIPS (short-term)
US Mortgage-Backed
US Floating Rate
US Corporate
US High Yield
International Corporate Bond
Emerging Market Bond
Outlook (relative to benchmark)
Overweight
Neutral
Neutral
Neutral
Neutral
Underweight
Neutral
Neutral
Underweight
Modestly Overweight
Position Details
U.S. Treasuries: Shorter-duration Treasuries are favored. U.S. long-term Treasuries are exhibiting improving relative strength compared to the equity market, while credit risk proxies (CDS) are improving, indicating risk-off demand and a quality bid. Negative signals include relative strength, technical cross-measures, and inflation expectations, indicating potential headwinds. Neutral: momentum-based technicals are flat. Overall, the model confirms a mixed regime—defensive appeal improving against risk assets and credit, while inflation dynamics and trend overlays constrain upside. We remain overweight in shorter-duration assets and are neutral in longer-duration assets.
Commentary: Economic, monetary, and technical factors pulled markets in different directions. The month opened with softer labor data, sparking a rally as investors priced in a higher probability of a September Federal Reserve rate cut. Yields along the curve fell initially, reflecting renewed confidence in a dovish pivot. Yet, Treasury auctions underscored investor caution. The 10-year note cleared at 4.25% with a bid-to-cover ratio below historical averages, while the 30-year bond auction at 4.75% also saw muted demand. Elevated issuance and fiscal concerns weighed on auction performance, reminding investors that supply dynamics remain a structural headwind. Central bank developments added further nuance. At Jackson Hole, Chair Powell announced a recalibration of the Fed’s policy framework, emphasizing flexibility around the 2% inflation target and moving away from prior “makeup” strategies. While this bolstered the case for eventual easing, persistent core inflation near 3% kept longer-term yields sticky. Globally, rate cuts from the European Central Bank and Bank of Canada highlighted diverging monetary stances, complicating cross-border flows into Treasuries. Combined with fiscal debates at home, these forces left Treasuries caught between easing expectations and supply-driven yield pressures—a defining tension throughout 2025.
Figure 1: CDS rates picked up earlier in the year and appear to be reversing lower. This is constructive for bonds overall.
U.S. TIPS: The TIPS composite model is neutral. Technical measures are mixed with the RSI bearish, momentum mean reversions neutral, and moving averages generally bullish. Commodity price trends and higher inflation expectations are also constructive for TIPS. Option-adjusted spreads are narrow but are showing signs of potential widening. The net result is a neutral exposure.
Commentary: Treasury Inflation-Protected Securities (TIPS) balanced between moderating inflation data and shifting monetary policy signals. Headline and core CPI prints remained elevated relative to the Fed’s target, with core near 3%. However, month-over-month momentum showed signs of easing, prompting investors to reassess the inflation risk premium embedded in breakevens. Market behavior reflected this recalibration. TIPS breakevens narrowed modestly at the front end as energy disinflation persisted, while intermediate maturities held firm, underscoring investor belief in sticky service-sector inflation. Demand dynamics were also shaped by auction activity: new TIPS issuance met steady but not exuberant participation, with foreign central banks remaining net buyers as a hedge against dollar volatility.
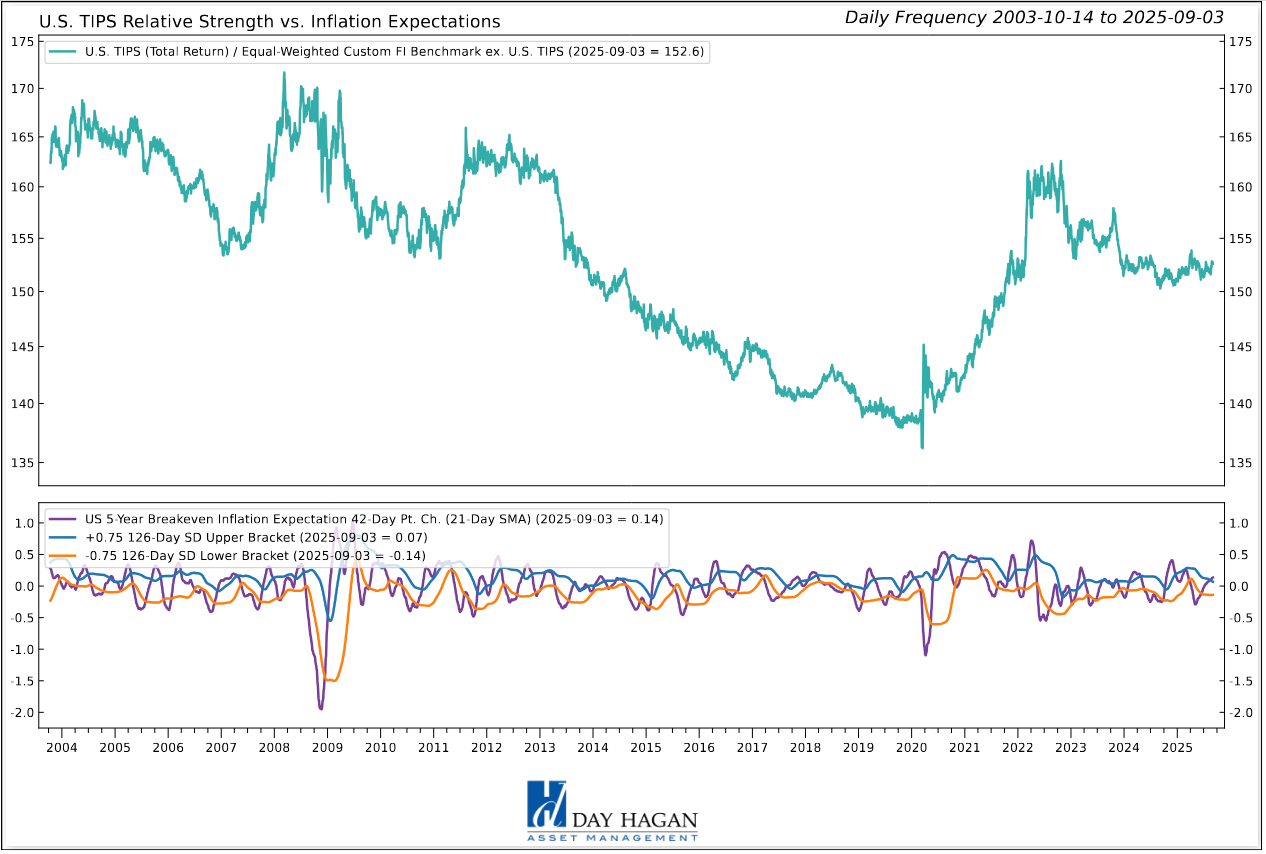
Figure 2: Inflation expectations have picked up. A reversal in inflation expectations below the upper SD bracket would be negative for TIPS and positive for other fixed income sectors.
U.S. Mortgage-Backed Securities: The composite model improved with the September update. Moving average, RSI, yield trends, and relative strength slope measures are bullish. Rising inflation expectations and narrow option-adjusted spreads (indicating a low risk premium) are a headwind. We remain neutral.
Commentary: Rate volatility, housing market data, and shifting central bank policy ultimately led to positive returns for the month. Early in the month, weaker employment data pulled Treasury yields lower, but for MBS investors, the move was less straightforward. Declining rates revived concerns about faster prepayments, while elevated mortgage rates near 6.5% kept origination volumes depressed, limiting new supply. From a carry perspective, MBS spreads traded in a relatively tight band, supported by strong demand from domestic banks and money managers seeking incremental yield over Treasuries. However, convexity hedging pressures re-emerged mid-month as volatility in the long end of the Treasury curve increased. This contributed to the underperformance of higher-coupon pools versus lower-coupon pools. Monetary policy also played a direct role. The Federal Reserve, continuing its balance sheet drawdown, further reduced its MBS holdings, shifting supply risk to private investors. At the same time, Powell’s Jackson Hole comments on flexible inflation targeting reinforced expectations of eventual easing, which buoyed sentiment but kept hedging costs elevated. Housing fundamentals were mixed but leaned negative: softer home sales and stabilizing prices reduced fears of credit deterioration, allowing MBS to generate modest positive excess returns over Treasuries in August.
Figure 3: MBS is approaching overbought levels but still has upside potential before reaching the signal threshold.
U.S. Floating Rate Notes: The composite model remains in negative territory. Trend indicators are negative, confirmed by the lower OIS swap rate (indicating expectations for Fed easing). A higher VIX often indicates risk-off sentiment, which historically favors Treasuries over FRNs. We remain underweight.
Commentary: With coupons tied to recent Treasury bill yields, FRNs remained attractive as the Fed maintained policy rates at restrictive levels, even as markets priced a September rate cut. This created a unique dynamic: investors benefited from still-elevated carry while facing uncertainty about how quickly those coupons might reset to lower levels. Auction activity was a key driver. Mid-August FRN issuance was met with steady demand from money market funds and bank portfolios seeking low-duration instruments with yield pickup over bills. However, bid-to-cover ratios suggested a modest cooling of demand, consistent with broader concerns about the heavy supply of Treasuries. Economic factors also shaped sentiment. Softer employment data and moderating inflation raised confidence in easing ahead, compressing expectations for forward FRN accrual. Yet, this was balanced by global central bank divergence: while the ECB and the Bank of Canada accelerated rate cuts, the Fed signaled optionality, keeping U.S. short-rate instruments relatively well bid. For August overall, FRNs delivered stable returns—driven by income accrual rather than price appreciation—reinforcing their role as a defensive allocation during late-cycle uncertainty.
Figure 4: Relative momentum for Floating Rate Notes is negative.
U.S. IG Corporates: Last month, we increased exposure to neutral, and the position is unchanged with the September update. Trends in the U.S. dollar and several technical indicators are supportive, but implied bond volatility, option-adjusted spreads, credit default swap trends, and mean reversion indicators are negative.
Commentary: U.S. investment-grade corporate bonds delivered strong performance. Spreads compressed to roughly 74 basis points—the tightest since 2002—underscoring investor appetite for high-quality credit even amid elevated Treasury volatility. Economic data provided a constructive backdrop. Corporate earnings in Q2 exceeded expectations across key sectors, with balance sheets showing healthy leverage ratios and ample liquidity buffers. Slowing but still positive GDP growth further reduced immediate recession risks, supporting the spread tightening despite questions about the sustainability of longer-term growth. Monetary factors also played a role. While markets priced in rate cuts later in the year, absolute yields across IG corporates remained compelling at 5%–6%, offering attractive carry relative to historical norms. This yield environment encouraged inflows into credit funds, sustaining demand through heavy new issuance. Issuers capitalized on favorable conditions with robust supply, yet absorption remained strong given the global search for yield. Central bank divergence globally reinforced the case for U.S. credit. As foreign investors faced shrinking yields in Europe and Canada, dollar-denominated IG bonds benefited from cross-border flows. In sum, August highlighted how stable fundamentals, technical strength, and international demand combined to drive investment-grade spreads to historic tights.
Figure 5: Rising bond volatility is a headwind for U.S. IG Corporates.
U.S. High Yield: The composite model is neutral, with technical measures generally positive, supported by small-cap equity trends and a reversal lower in the VIX. A deterioration in High-Yield Bond Breadth and a potential reversal in credit spreads are cautionary signals. We remain neutral.
Commentary: U.S. high yield bonds extended their rally in August, with the ICE BofA High Yield Constrained Index gaining over 1%, bringing year-to-date returns above 6%. Performance was anchored in carry, as spreads tightened modestly to near 284 basis points, reflecting investor confidence in corporate credit quality. Economic factors supported the sector. Despite evidence of a cooling labor market, earnings among sub-investment-grade issuers remained stable, with default rates holding near cycle lows. Refinancing activity accelerated as companies opportunistically termed out debt, reducing near-term maturity risk—a key driver of investor comfort with tighter spreads. From a monetary perspective, expectations of forthcoming Fed rate cuts enhanced sentiment, as lower financing costs would provide relief to leveraged borrowers. Importantly, however, high-yield’s sensitivity to equity market dynamics also contributed: a robust equity rally in August reinforced confidence in cyclical sectors, boosting lower-rated credits. Global capital flows further aided demand. With central banks abroad cutting rates and global yields compressing, international investors sought incremental returns in U.S. speculative-grade markets. The result was strong fund inflows, particularly into exchange-traded products offering broad HY exposure.
Figure 6: We’re closely monitoring a potential reversal in High-Yield bond breadth.
International IG Bonds: The composite model improved slightly but remains in negative territory. Measures of relative strength, moving averages, option-adjusted spreads, and credit default swaps are negative. Indicators calling equity risk and VIX trends are positive. We remain underweight.
Commentary: The European Central Bank continued its easing trajectory, implementing another rate cut to counter slowing growth and subdued inflation, while the Bank of Canada also delivered policy relief. These moves compressed local sovereign yields, creating a supportive technical backdrop for euro- and Canadian-dollar-denominated IG corporates. Economic fundamentals in developed markets showed mixed signals. Euro-area inflation edged slightly above 2%, but persistent industrial weakness weighed on growth. Corporate issuers in Europe and Asia maintained conservative balance sheets, enabling spreads to grind tighter as investors sought incremental yield over government bonds. Strong earnings from multinational corporates reinforced confidence, particularly in defensive sectors such as utilities and consumer staples. Foreign capital flows also played a role. With U.S. investment grade spreads already at historic tights, global investors looked abroad for diversification, supporting issuance in Europe and Asia. Meanwhile, the stronger U.S. dollar added complexity for dollar-based investors, but hedged yields on select euro IG issues remained compelling.
Figure 7: International IG Corporate CDS rates are trending higher.
Emerging Market Bonds: The EM bond model remains bullish but moved lower with the September update. Measures of Emerging Market Equity Momentum, absolute MA crosses, and relative strength MA slope are bullish. Indicators calling the EM Currency Index and Commodity market strength remain on sell signals. Overall, we remain modestly overweight.
Commentary: Emerging market (EM) bonds delivered solid gains in August, with hard-currency sovereign indices returning over 1.5% and corporate benchmarks advancing around 1.3%. The sector benefited from a combination of moderating U.S. yields, supportive global liquidity, and resilient local fundamentals. Economic conditions across key EM regions proved relatively stable. Latin America saw inflation readings continue to ease, enabling central banks in Brazil and Chile to maintain accommodative stances. In Asia, stronger export data from Korea and India reinforced growth momentum, while China’s targeted fiscal support programs helped steady credit markets after a weak property sector print. Monetary policy divergence in developed markets also supported EM flows. With the ECB and Bank of Canada cutting rates, and the Fed signaling eventual easing, global investors rotated into higher-yielding EM debt. Hard-currency sovereign spreads narrowed modestly, while corporate issuance was met with robust demand, reflecting improved refinancing conditions for EM borrowers. Currency dynamics added another layer: although the U.S. dollar strengthened slightly, many EM central banks actively intervened to stabilize FX volatility, reducing one of the sector’s key risk premia. By month-end, EM bonds had outperformed most developed market peers, underscoring their role as beneficiaries of the late-cycle global policy shift.
Figure 8: Emerging Market equity momentum has supported EM bond prices. A decline below the 0 line would lead us to reduce exposure. Getting closer.
Catastrophic Stop Model
The Catastrophic Stop model combines time-tested, objective indicators designed to identify high-risk periods for equities and assets with high correlations to the equity market. The model entered September recommending a fully invested allocation relative to the benchmark for credit sectors with high correlations to equities.
The DH Catastrophic Stop model level is 50%, indicating that investors should maintain their benchmark equity exposure.
Our perspective remained relatively unchanged over the month of August. The excessive optimism noted four weeks ago has slightly moderated, and we have been anticipating a consolidation phase as sentiment and technical indicators trended toward more normalized levels. We will closely monitor overbought and oversold conditions to identify potential reversals before issuing new buy signals.
Balancing modestly higher bond yields, ongoing political and Fed policy uncertainty (though leaning more dovish), tech and AI stock weakness, tariff-related volatility, seasonal September risk, potential Fed rate cuts, broad corporate earnings strength, solid consumer spending, still-good capital flows into ETFs (mostly by retail), and safe-haven inflows (like gold, signaling defense) ultimately leads to the same conclusion: Some excesses still need to be worked down, but given the better economic outlook, supported by corporate earnings forecasts, we currently don’t expect an extended decline. Should our models shift more negatively, we will quickly move to reduce risk.
The weight of the evidence suggests that any weakness is unlikely to extend into a significant downtrend at this time. Of course, if our model flips negative (below 40% for two consecutive days), signaling more substantial problems, we will raise cash immediately.
Figure 9: The Catastrophic Stop model recommends a fully invested position (relative to the benchmark). Note: Due to the use of indices to extend model history, the model is considered hypothetical.
The Day Hagan Daily Market Sentiment Composite remains on a sell signal, reflecting a shift in investor sentiment from excessive optimism to a neutral stance. Historically, this transition acts as a headwind for equities until excessive optimism subsides, typically indicated by a drop below the 30 threshold, which signals the transition into excessive pessimism.
Figure 10: Investor sentiment is being reset as illustrated by the DH Daily Market Sentiment Composite declining below 70. A decline below 30 would be a nice setup for a year-end rally.
Our goal is to stay on the right side of the prevailing trend, introducing risk management when conditions deteriorate. Currently, the uptrend remains intact. The broader-based composite models calling U.S. economic growth, international economic growth, inflation trends, liquidity, and equity demand remain constructive. The Catastrophic Stop model is positive, and we are aligned with the message. If our models shift to bearish levels, we will raise cash.
This strategy utilizes measures of price, valuation, economic trends, monetary liquidity, and market sentiment to make objective, rational, and unemotional decisions about how much capital to place at risk and where to allocate that capital.
For more information, please contact us at:
Day Hagan Asset Management
1000 S. Tamiami Trl
Sarasota, FL 34236
Toll Free: (800) 594-7930
Office Phone: (941) 330-1702
Website: https://dayhagan.com or https://dhfunds.com
© 2025 Day Hagan Asset Management
This material is for educational purposes only. Further distribution is prohibited without prior permission. Please see the information on Disclosures and Fact Sheets here: https://dhfunds.com/literature. Charts with models and return information use indices for performance testing to extend the model histories, and they should be considered hypothetical. All Rights Reserved. (© Copyright 2025 Day Hagan Asset Management.)
Day Hagan Smart Sector® Fixed Income ETF
Symbol: SSFI
Disclosures
The data and analysis contained within are provided "as is" and without warranty of any kind, either express or implied. The information is based on data believed to be reliable, but it is not guaranteed. Day Hagan DISCLAIMS ANY AND ALL EXPRESS OR IMPLIED WARRANTIES, INCLUDING, BUT NOT LIMITED TO, ANY WARRANTIES OF MERCHANTABILITY, SUITABILITY, OR FITNESS FOR A PARTICULAR PURPOSE OR USE. All performance measures do not reflect tax consequences, execution, commissions, and other trading costs, and as such, investors should consult their tax advisors before making investment decisions, as well as realize that the past performance and results of the model are not a guarantee of future results. The Smart Sector® Strategy is not intended to be the primary basis for investment decisions and the usage of the model does not address the suitability of any particular in Fixed Income vestment for any particular investor.
Using any graph, chart, formula, model, or other device to assist in deciding which securities to trade or when to trade them presents many difficulties and their effectiveness has significant limitations, including that prior patterns may not repeat themselves continuously or on any particular occasion. In addition, market participants using such devices can impact the market in a way that changes the effectiveness of such devices. Day Hagan believes no individual graph, chart, formula, model, or other device should be used as the sole basis for any investment decision and suggests that all market participants consider differing viewpoints and use a weight-of-the-evidence approach that fits their investment needs.
Past performance does not guarantee future results. No current or prospective client should assume future performance of any specific investment or strategy will be profitable or equal to past performance levels. All investment strategies have the potential for profit or loss. Changes in investment strategies, contributions or withdrawals and economic conditions may materially alter the performance of your portfolio. Different types of investments involve varying degrees of risk, and there can be no assurance that any specific investment or strategy will be suitable or profitable for a client’s portfolio. Historical performance results for investment indexes and/or categories generally do not reflect the deduction of transaction and/or custodial charges or the deduction of an investment management fee, the incurrence of which would have the effect of decreasing historical performance results. There can be no assurances that a portfolio will match or outperform any particular benchmark.
Day Hagan Asset Management is registered as an investment adviser with the United States Securities and Exchange Commission. SEC registration does not constitute an endorsement of the firm by the Commission nor does it indicate that the adviser has attained a particular level of skill or ability.
There may be a potential tax implication with a rebalancing strategy. Re-balancing involves selling some positions and buying others, and this activity results in realized gains and losses for the positions that are sold. The performance calculations do not reflect the impact that paying taxes would have, and for taxable accounts, any taxable gains would reduce the performance on an after-tax basis. This reduction could be material to the overall performance of an actual trading account. Day Hagan does not provide legal, tax or accounting advice. Please consult your tax advisor in connection with this material, before implementing such a strategy, and prior to any withdrawals that you make from your portfolio.
There is no guarantee that any investment strategy will achieve its objectives, generate dividends or avoid losses.
© 2024 Day Hagan Asset Management
