
Day Hagan Smart Sector® International Strategy Update October 2025
A downloadable PDF copy of the Article:
Day Hagan Smart Sector® International Strategy Update October 2025 (pdf)
Executive Summary
Global Equity Performance: A Regional Snapshot
During September, global equity markets advanced on the back of dovish central bank shifts, resilient corporate earnings, and a rotation into regions beyond the U.S. In the U.S., the S&P 500 and Nasdaq recorded their strongest September gains in 15 years propelled by a fully priced-in 25 bp Fed cut and optimism for further easing. The S&P Global Composite PMI eased from 54.6 in August to 53.6, indicating slowing but still above-trend economic growth.
In Europe, equities held up despite renewed weakness in manufacturing. The eurozone manufacturing PMI fell to 49.8 from 50.7, signaling renewed weakness in exports and business orders. However, the composite PMI remained robust at 51.2, largely driven by the strength of the services sector. The ECB’s projections showed global real GDP at 3.3% in 2025, with a slight downward revision to foreign demand, lending support to expectations that the ECB would remain accommodative.
Emerging markets lagged overall. China’s official manufacturing PMI improved slightly to 49.8 (from 49.4) but remained in contraction territory for a sixth straight month. India saw a slowdown in the PMI index, as it slipped to 57.7 from 59.3, although it remains well above 50, while inflation pressures reached multi-year highs. Capital flows in India turned negative, weighed down by tariff concerns and valuation risks.
In Japan, manufacturing downturn deepened: the PMI dropped to 48.5 from 49.7, recording the sharpest contraction in six months. Exports weakened, new orders fell, and employment growth cooled. Nevertheless, equities were supported by expectations of structural reform and domestic policy initiatives.
Pacific ex-Japan markets benefited from a rotation into the Asian region. South Korea’s manufacturing PMI rebounded to 50.7, registering expansion for the first time in eight months. Taiwan and Singapore equities also gained on demand for tech and favorable valuations, offsetting the softness in China.
In Canada, the manufacturing sector remained in contraction, with the PMI sliding to 47.7 (down from 48.3). Declines in new orders and output deepened, though inflationary pressures eased—a factor that supported the Bank of Canada’s decision to cut its key rate by 25 bp to 2.50%. Across all markets, investors shifted their focus from U.S.-centric concentration to regions with stronger earnings upside, lower relative valuations, and supportive monetary policy settings. The momentum favored equities over fixed income as risk assets absorbed dovish cues and asymmetric upside potential.
Conclusion
During September, several common themes emerged across global equity markets. Central bank policy expectations played a dominant role, with the U.S. Federal Reserve, the ECB, and the Bank of Canada all leaning dovish, reinforcing investor preference for equities over bonds. Inflation pressures were generally moderating, allowing policymakers room to ease monetary policy. PMI data revealed a consistent divergence between services resilience and manufacturing weakness, evident in the U.S., Europe, Japan, and Canada. Investor rotation toward regions with more attractive valuations, such as Japan, Pacific ex-Japan, and parts of Europe, was another shared trend.
However, regional differences were significant. The U.S. outperformed with strong index gains, while Europe faced contraction in manufacturing despite stable services. Emerging markets diverged: China remained in contraction, weighing on sentiment, while India maintained expansion but suffered capital outflows. South Korea rebounded into expansion, contrasting with Taiwan’s tech-driven strength. Japan’s equities were supported by reform momentum despite worsening factory data. Canada’s equities followed U.S. trends but were constrained by domestic manufacturing weakness. In summary, global equities exhibited common themes of policy support, services-led growth, and a rotation away from bonds; however, regional disparities in capital flows, industrial momentum, and policy drivers led to variations in performance. We expect these trends to continue.
Holdings
Core: Developed Market Positions (approximately 65% of equity holdings)
Country
Australia
Canada
China
France
Germany
Japan
Switzerland
United Kingdom
Outlook
Underweight
Underweight
Overweight
Underweight
Underweight
Overweight
Neutral
Underweight
Explore: Emerging Market Positions (approximately 35% of equity holdings)
India
Poland
Philippines
Thailand
Chile
Position Details
Core: Developed Market Commentary
Approximately 65% of the strategy is allocated across eight of the largest markets in the ACWI ex-U.S. Index. The fund overweights and underweights the largest non-U.S. equity markets based on macro, fundamental, behavioral, and technical indicators.
Australia: Positive indicators for Australia include a rising interest rate differential, an uptrending absolute moving average cross, gold continuing to gain, and lower relative beta, indicating supportive technical and macro conditions. Negative indicators include short-term adaptive moving averages, our global technical scorecard, and its relative earnings yield, reflecting structural and valuation headwinds. Bear market bounces were neutral. Overall, Australia demonstrated selective support from rates, commodities, and technicals, but faced constraints from weaker global positioning and earnings-based metrics. We remain underweight.
Commentary: In September, Australian equities were shaped by moderating growth, inflation concerns, and a cautious central bank stance. The manufacturing PMI slipped to 51.6 (from 53.0 in August), indicating slower expansion, while the services PMI declined to 52.0 (from 55.8), reflecting weakening demand. The Reserve Bank of Australia held the cash rate steady at 3.60%, citing upside risks to inflation and uncertain momentum. Inflation remained a concern, with consumer prices staying near the upper bound of the target band, which constrained further easing. On the equity front, financials, healthcare, and mining broadly supported the ASX, offsetting softness in cyclicals sensitive to capital conditions. Real estate and consumer-discretionary names underperformed as sentiment cooled, and consumer sentiment dropped 3.1%. The Australian dollar strengthened modestly, reflecting global risk flows and carry interest in a stable rate regime. Overall, Australian equities in September navigated a transition from robust mid-year momentum to a more cautious environment, with valuation strength and sector rotation helping to maintain market tone despite slowing activity.
Figure 1: Gold continues to rise, which is bullish for Australia’s stock market.
Canada: Positive indicators for Canada include our triple moving average diffusion index, absolute moving average cross, and the global technical scorecard, reflecting constructive technical alignment. Negative indicators included mean reversion (short-term overbought), the OECD leading indicators indicating economic deceleration, the CAD-USD exchange rate, and the relative earnings yield, all signaling macroeconomic and valuation pressures. Overall, Canada showed broad technical support but remained constrained by weaker fundamentals, currency dynamics, and leading economic signals. We remain underweight.
Commentary: Canadian equities responded to contracting manufacturing activity, supportive central bank policy, and external trade pressures. The S&P Global Canada Manufacturing PMI fell to 47.7, down from 48.3, signaling an intensified downturn in output, new orders, and employment. In response, the Bank of Canada trimmed its policy rate by 25 basis points to 2.50%, marking its first cut since March. The cut was justified by weakening growth, softening inflation expectations, and fading upward price risks. Meanwhile, Q2 GDP showed a sharp contraction (-1.6% annualized), driven by a steep 27% decline in exports, adding pressure to the equity outlook. U.S. tariff uncertainties and weak external demand further weighed on Canada’s trade-sensitive sectors. Equities in the financial and domestic consumer sectors benefited modestly from the rate easing, but exporters and industrials lagged behind. The muted demand backdrop and contingent policy support made equity gains fragile.
Figure 2: Canada’s relative strength mean reversion indicator is oversold. A reversal would support a continuation of the recent rally. We require more technical confirmation before adding significant exposure.
China: Positive indicators for China relative strength include price momentum, mean reversion, absolute moving average cross, and high-yield credit spreads, signaling constructive technical and credit conditions. Negative indicators include the PMI (Purchasing Managers’ Index) and our emerging markets currency basket, which reflect macroeconomic and currency headwinds. The Bear Market Bounce indicator is neutral. Overall, China showed supportive technical signals and credit dynamics but remained constrained by weaker economic activity and currency pressures, both of which appear to be forming a trough. We are overweight.
Commentary: China’s equity markets were weighed down by ongoing weakness in the manufacturing sector, tempered growth expectations, and restrained policy response. The official manufacturing PMI remained in contraction (at 49.8), marking the sixth consecutive month below 50, even as it ticked up slightly from 49.4 in August. Non-manufacturing and services activity also decelerated, with the non-manufacturing PMI slipping to 50.0 from 50.3. Industrial output growth softened—rising just 5.2% year on year in August, down from 5.7% in July—while retail sales grew by only 3.4%. Credit data remained muted: new bank loans recovered modestly in August but fell short of expectations, and total social financing growth slowed. The People’s Bank of China held policy rates steady, refraining from broad stimulus measures, although the central bank adjusted its daily yuan-fixing rate downward to curb depreciation pressure. Amid trade tensions and weak domestic demand, investor sentiment was fragile, and outflows from equity and credit markets increased. The backdrop of persistent industrial contraction, soft consumer demand, and cautious policy support constrained gains in Chinese equities.
Figure 3: Narrow high-yield credit spreads are supportive of risk-on assets like China equities.
France: Positive indicators for France include relative dividend yield and our global valuation scorecard, suggesting some support from income and valuation metrics. Negative indicators were concentrated in moving average crosses, breadth, technical scorecards, momentum, and OECD leading indicators, reflecting weak technical positioning and macro headwinds. ETF fund flows were neutral. Overall, France showed limited support from valuation and yield while broader technical and economic signals remained unfavorable. We remain underweight.
Commentary: French equities faced headwinds as weakening domestic activity, political volatility, and margin pressures dominated investor sentiment. The composite PMI fell to 48.4 from 49.8, marking the deepest contraction in five months. The manufacturing PMI declined sharply to 48.1 (from 50.4 in August), while the services PMI slipped to 48.9, both indicating broad-based downward pressure across sectors. New orders declined, particularly investment demand, and firms lowered selling prices to maintain volumes, thereby squeezing margins amid persistent cost pressures. During the month, political uncertainty surged following the fall of the Bayrou government and transitions in leadership, eroding confidence among households and businesses. Inflation edged higher regionally, with French consumer inflation reaching ~1.1%, increasing pressure on borrowing costs and complicating monetary assumptions. Credit spreads widened modestly, and risk premia on French sovereign bonds expanded. In this environment, equities—especially cyclical and export-oriented names—underperformed, with resilience limited largely to high-dividend defensive sectors and names insulated from domestic demand swings.
Figure 4: Has momentum troughed? Stay tuned. (If our models improve, we’ll increase exposure.)
Germany: Germany’s composite model is supported by the DAX’s relatively high dividend yield, providing some valuation support. Negative indicators included the global technical scorecard, moving average crosses, manufacturing confidence, and the EUR-USD exchange rate, reflecting weak technical alignment and macro pressures. Breadth, Bear Market Bounces, and ETF flows were neutral. Overall, Germany showed limited strength from yield metrics but remained constrained by unfavorable technicals, soft economic confidence, and currency headwinds. We are modestly underweight.
Commentary: German equities are struggling with a mixed macro backdrop of slowing manufacturing, resilient services growth, and shifting sentiment. The HCOB/S&P Global manufacturing PMI slipped to 48.5 (or a revised 49.5 in some readings), down from 49.8 in August, indicating renewed contraction in new orders and exports. Meanwhile, the composite PMI rose to 52.4, lifted by strong momentum in the services sector, which reached 52.5. This divergence flagged a structural shift: services drove growth even as the industry cooled down. Unemployment added a drag, rising more than expected by approximately 14,000 additional jobless individuals, bringing the total unemployed to around 2.98 million (rate: approximately 6.3%) and signaling weakening labor market conditions. Inflation pressures intensified: German headline inflation rose to 2.4%, the highest level since February, and core inflation increased to 2.8%. Elevated costs squeezed margins and complicated expectations for ECB policy. Growth forecasts remained tepid—IFW projected GDP growth for 2025 at just 0.1% after two years of contraction. Meanwhile, hopes for political and fiscal stimulus provided mild support. The government’s intention to increase infrastructure and defense spending provided context for investor expectations of future fiscal stimulus. Germany’s equity market balanced the contraction in its industrial base against the strength in services, rising inflationary pressures, labor market weakness, and cautious optimism about stimulus measures. These mixed forces introduced volatility and uncertainty, even as selective opportunities emerged in less cyclical, domestically oriented sectors.
Figure 5: Fund outflows appear to be slowing. If the indicator improves, showing renewed investor interest, we are likely to increase exposure as the models move higher.
Japan: Positive indicators for Japan include absolute and relative moving average crosses, China’s PMI, our valuation scorecard, improving forward earnings growth, a positive sentiment reversal, and the USD/JPY exchange rate, indicating strong technical and macro support. The only negative indicator was the global technical scorecard, reflecting weaker alignment with broader market signals. Overall, Japan showed broad-based strength across technical, valuation, and economic measures with limited external headwinds. We remain overweight.
Commentary: Japanese equities navigated a mixed macro environment. The S&P Global manufacturing PMI sank further to 48.4, indicating the sharpest contraction in six months, with declines in new orders, output, and exports weighing on industrial names. Meanwhile, the composite PMI remained in expansion territory at 51.1, supported by resilient services activity, though it slipped from 52.0 in August. On the inflation front, core consumer prices in Tokyo held at about 2.5% year-on-year, exceeding the BOJ’s 2% target. The Bank of Japan kept its policy rate at 0.5%, as expected, but dissenting board votes signaled growing internal pressure for tightening. The BOJ’s policy statement also noted that inflation expectations had risen moderately and reaffirmed its commitment to maintain accommodative conditions. Equity performance was further shaped by global trade pressures, especially soft external demand from China and the U.S., which dampened export prospects. Structural expectations, including continued corporate reforms, shareholder returns, and hopes for fiscal stimulus, provided ballast, particularly in the tech, real estate, and domestically oriented sectors. The broader market thus traded with caution: industrial and export-linked stocks lagged, while services and domestically focused names buoyed overall sentiment.
Figure 6: Forward earnings growth expectations are increasing.
Switzerland: Switzerland’s composite model is supported by positive breadth readings, a higher relative dividend yield, the sovereign 10-year yield, and ETF fund flows, reflecting support from participation, valuation, and flows. Negative indicators were concentrated in moving average crosses, short-term momentum, and slope measures, signaling a series of weaker technical supports. Overall, Switzerland demonstrated selective strength in terms of income and flows but remained pressured by unfavorable technical signals. We are neutral.
Commentary: Swiss equities were pressured by weakening industrial activity, trade headwinds, and tight monetary policy posture. Switzerland’s procure.ch manufacturing PMI declined sharply to 46.3 from 49.0 in August, marking a significant contraction in output, new orders, and employment. The Swiss National Bank maintained its policy rate at 0%, adopting a neutral stance while signaling its readiness to intervene in foreign exchange markets as needed. Inflation was modest, with August CPI around 0.2 % year-on-year—within the SNB’s target band. U.S. tariff pressures on Swiss machinery and watch exports added a downside risk to trade-sensitive sectors, weakening investor sentiment. On the equity front, defensive sectors—particularly healthcare, pharmaceuticals, and consumer staples—outperformed, while industrial, machinery, and export-oriented firms underperformed. The strong Swiss franc further compressed margins for exporters. Although the SNB adjusted its threshold for negative-rate treatment of deposits (effective November) to preserve policy transmission, that change had limited immediate market impact. Overall, Switzerland’s equity performance in September was restrained by industrial contraction, external pressures, and cautious central bank policy, which favored quality and non-cyclical names.
Figure 7: Outflows starting to turn into inflows.
United Kingdom: Positive indicators for the U.K. were limited to sentiment (too much pessimism), providing some support. Negative indicators included moving average crosses, price momentum, currency dynamics, our valuation scorecard, and option-adjusted spreads, reflecting weak technical, macro, and credit conditions. Overall, the U.K. showed minimal support with broader headwinds from technical weakness, valuation pressures, and currency risk. We remain underweight, but we are looking for signs that confirm a trough is forming.
Commentary: U.K. equity markets were pressured by weakening manufacturing, softening demand, and cautious monetary policy. The S&P Global flash PMI survey indicated a sharp slowdown in business activity, with trade, confidence, and hiring all declining. UK manufacturing contracted at its fastest rate in five months, with the PMI falling to 46.2, driven by declining output and weak new orders. Meanwhile, the Bank of England held its Bank Rate at 4.0%, opting not to cut despite a slowdown in growth, and announced plans to reduce its gilt holdings over the next 12 months. Inflation remained sticky (~3.3%), keeping pressure on real incomes and dampening consumer confidence. On the corporate front, energy and large-cap defensive sectors outperformed, while industrials, exporters, and domestically cyclical names lagged. Political uncertainty ahead of the November budget, combined with rising labor and energy costs, added to investor caution. In summary, U.K. equities faced a more challenging backdrop than many of their peers, balancing the drag from weak manufacturing and structural headwinds against relative strength in defensive, high-quality segments.
Figure 8: Relative momentum continues to wane in the U.K.
Emerging Market Positions
Approximately 30% of the strategy is allocated across five markets from a pool of more than 20 smaller markets. Selection is based on a multifactor technical ranking system using trend and mean reversion indicators. The process seeks to identify oversold opportunities within the global equity markets that are likely to mean-revert from lower levels and exhibit mild pullbacks from long-term uptrends.
Current Holdings:
India
Poland
Philippines
Thailand
Chile
Explore: Emerging Market Commentary
India: India’s manufacturing PMI slowed to 58.5 (from 59.3), while services eased to 61.6, pushing the composite PMI to 61.9—still strong but cooling. Foreign investors withdrew from equities, reflecting concerns about tariffs and valuation pressures. GDP growth had been revised upward by Fitch to 6.9% on resilient domestic demand. Inflationary pressures intensified, with strong price hikes in manufacturing. The Reserve Bank held its policy rate steady at 5.5%, striking a balance between growth risks and inflation concerns. Equity markets were pressured by capital outflows and tariff uncertainty, despite solid underlying growth.
Poland: Poland’s manufacturing PMI rose to 48.0 in September (from 46.6), signaling slower contraction and tentative stabilization in activity. The National Bank of Poland cut its policy rate by 25 bps to 4.75% early in September as inflation cooled to ~2.8%—near the midpoint of its 1.5–3.5% target band. Easing credit conditions and firmer real rates provided support. While equity momentum remained weak, reduced downside pressure and improved leading indicators offered a stabilizing backdrop. Poland is one of the top gainers YTD.
Philippines: The central bank continued easing its policy, having already reduced rates by 25 basis points earlier, bringing the reverse repo rate to 5.0%. Equity markets faced pressure from external demand weakness and regional industrial softness. Manufacturing activity in Asia was broadly soft in September, including declines in factory output in surrounding markets. Domestically, sensitivities to currency fluctuations and global investor risk aversion undercut gains, leaving equities underperforming. Short-term oversold conditions are in place for a potential mean reversion trade.
Thailand: Thailand’s manufacturing sector expanded strongly in September, with the PMI jumping to 54.6 from 52.7, marking one of its best readings in years. The positive surprise in industrial activity bolstered investor confidence in export-led growth. Lower global rates and broad easing rhetoric also encouraged risk-taking in Southeast Asia. However, equity gains were tempered by regional trade headwinds and lingering concerns over foreign investor flows, given sensitivities to currency shifts and external demand. As flows return, we view Thailand’s improving economic activity as an attractive opportunity.
Chile: Chile’s central bank held its benchmark rate at 4.75% in September, citing persistent core inflation and solid second-quarter economic performance. Global interest rates fell, which helped reduce local bond yields and improved the relative valuation of equity assets. U.S. tariff policy and external demand dynamics injected volatility into export sectors. The currency’s performance and commodity price swings—especially copper—also weighed on equity returns. Overall, equities saw restrained gains, supported by stable rates but constrained by external uncertainty.
Catastrophic Stop Model
The Catastrophic Stop model combines time-tested, objective indicators designed to identify high-risk periods for the equity market. The model entered October recommending a fully invested equity allocation relative to the benchmark.
The DH Catastrophic Stop model level is 50%, indicating that investors should maintain their benchmark equity exposure.
Our perspective remained relatively unchanged over the month of September. The excessive optimism noted last month moderated slightly. We have been anticipating a consolidation phase as sentiment and technical indicators mean-reverted toward more normalized levels. We will closely monitor overbought and oversold conditions to identify potential reversals before issuing new buy signals.
Balancing modestly ongoing political and Fed policy uncertainty (though leaning more dovish), tech and AI stock capital expenditures versus return on capital, tariff-related volatility, the potential for additional Fed rate cuts, broad corporate earnings strength, solid consumer spending, still-good capital flows into ETFs (mostly by retail), and safe-haven inflows (like gold, signaling defense) ultimately leads to the same conclusion: Some excesses still need to be worked down, but given the better economic outlook, supported by corporate earnings forecasts, we currently don’t expect an extended decline. Should our models shift more negative, we will quickly move to reduce risk.
The weight of the evidence suggests that any weakness is unlikely to extend into a significant downtrend at this time. Of course, if our model triggers a sell signal (below 40% for two consecutive days), indicating more substantial problems, we will raise cash immediately.
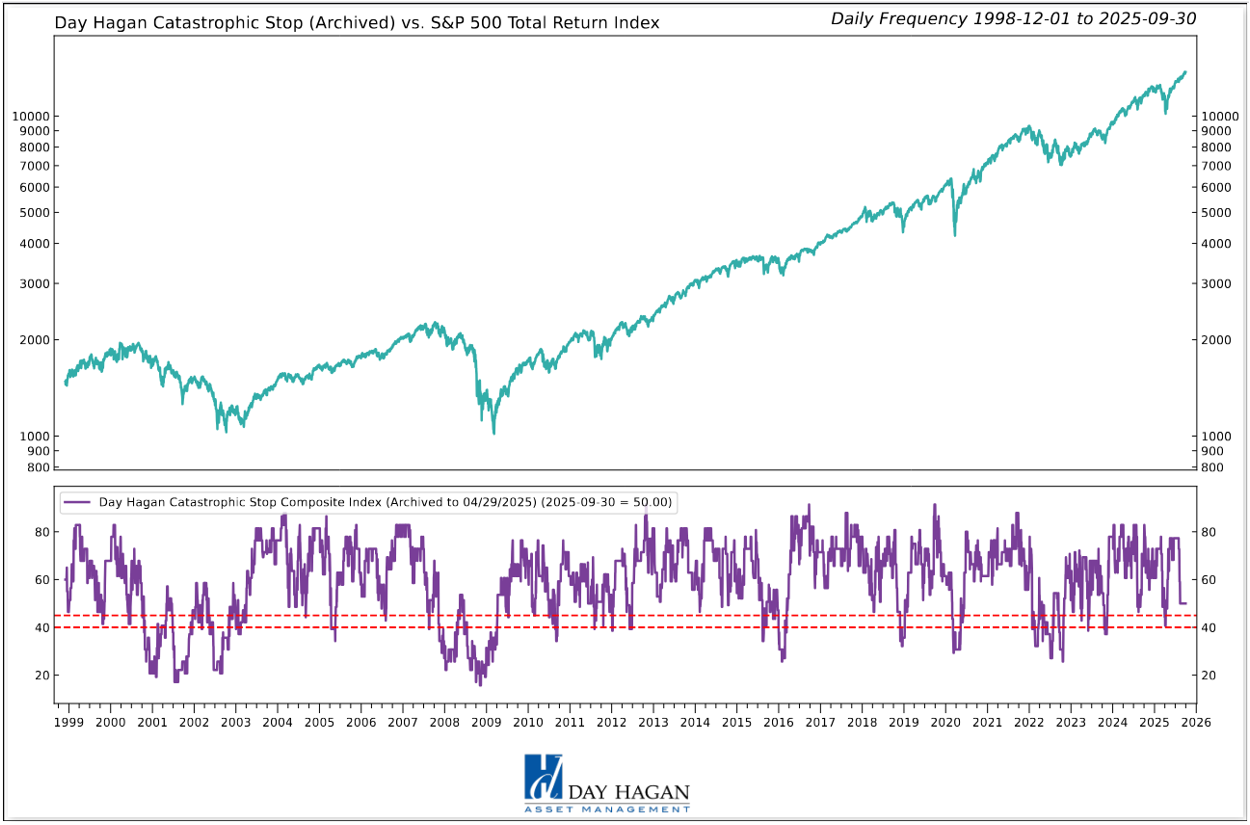
Figure 12: The Catastrophic Stop model recommends a fully invested equity position (relative to the benchmark). Due to the use of indices to extend model history, the model is considered hypothetical.
The Day Hagan Daily Market Sentiment Composite remains on a sell signal, reflecting a shift in investor sentiment from excessive optimism to a neutral stance. Historically, this transition acts as a headwind for equities until excessive optimism subsides, typically indicated by a drop below the 30 threshold, which signals the transition into excessive pessimism.
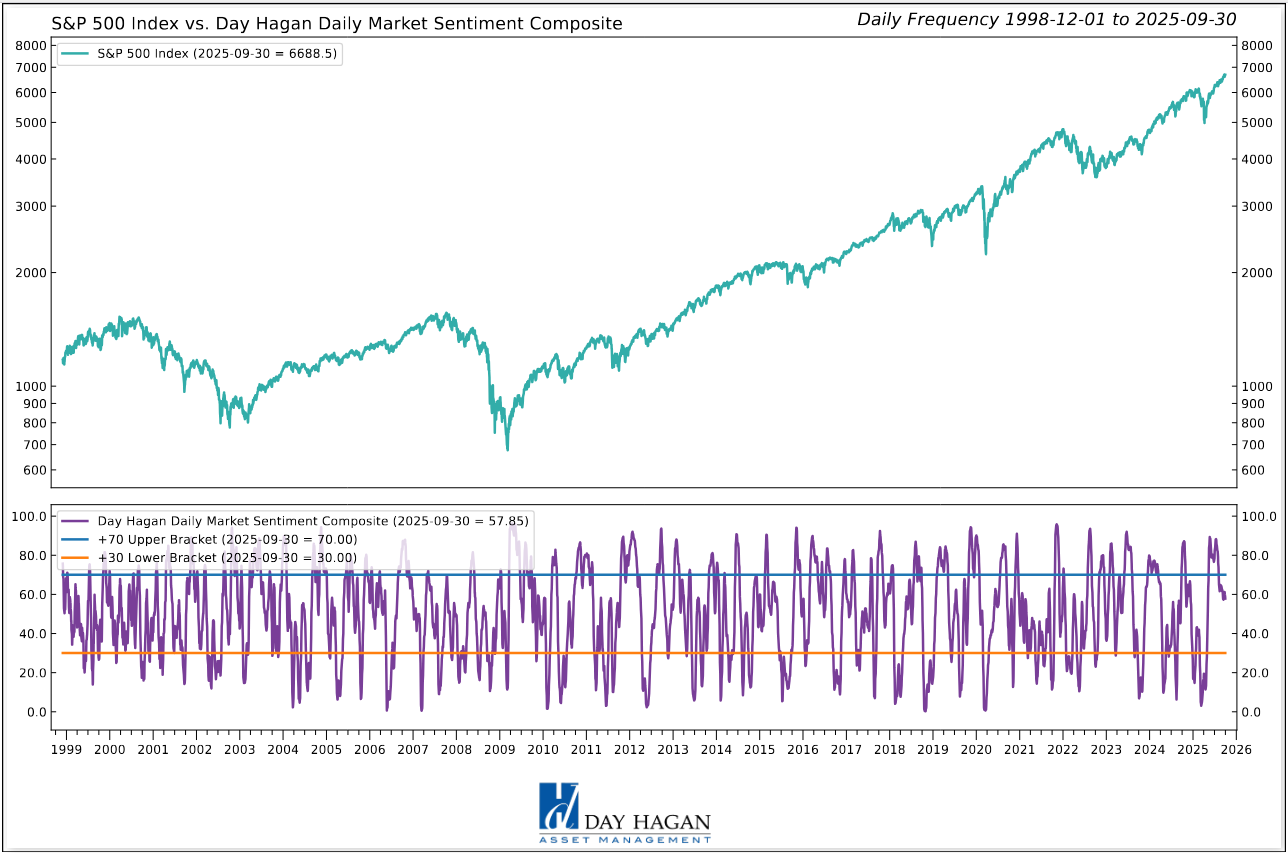
Figure 13: Investor sentiment is being reset, as illustrated by the DH Daily Market Sentiment Composite declining below 70. A decline below 30 would be a nice setup for a year-end rally.
This strategy utilizes measures of price, valuation, economic trends, monetary liquidity, and market sentiment to make objective, rational, and unemotional decisions about how much capital to place at risk and where to allocate that capital.
For more information, please contact us at:
Day Hagan Asset Management
1000 S. Tamiami Trl
Sarasota, FL 34236
Toll Free: (800) 594-7930
Office Phone: (941) 330-1702
Website: https://dayhagan.com or https://dhfunds.com
© 2025 Day Hagan Asset Management
This material is for educational purposes only. Further distribution is prohibited without prior permission. Please see the information on Disclosures and Fact Sheets here: https://dhfunds.com/literature. Charts with models and return information use indices for performance testing to extend the model histories, and they should be considered hypothetical. All Rights Reserved. (© Copyright 2025 Day Hagan Asset Management.)
Day Hagan Smart Sector® International ETF
Symbol: SSXU
Strategy Description
The Smart Sector® International strategy combines three quantitative investment strategies: Core International, Explore International, and Catastrophic Stop.
The Process Is Based On The Weight Of The Evidence
Core Allocation
The fund begins by overweighting and underweighting the largest non-U.S. equity markets based on proprietary models.
Each of the models utilizes market-specific, weight-of-the-evidence composites of fundamental, economic, technical, and behavioral indicators to determine each area’s probability of outperforming the ACWI, for example. U.S. Markets are weighted accordingly relative to benchmark weightings.
Explore Allocation
To select smaller markets, the fund uses a multi-factor technical ranking system to choose the top markets. The markets with the highest rankings split the non-core model allocation equally.
When Market Risks Become Extraordinarily High — Reduce Your Portfolio Risk
The model remains fully invested unless the Catastrophic model is triggered, whereupon the equity-invested position may be trimmed by up to 50%.
The Catastrophic Stop model combines time-tested, objective indicators designed to identify periods of high risk for the broad U.S. equity market. The model uses price-based, breadth, deviation from trend, fundamental, economic, interest rate, behavioral, and volatility-based indicator composites.
When Market Risks Return To Normal — Put Your Money Back To Work
When the Catastrophic Stop model moves back to bullish levels, indicating lower risk, the strategy will reverse toward being fully invested.
Disclosures
The data and analysis contained within are provided "as is" and without warranty of any kind, either express or implied. The information is based on data believed to be reliable, but it is not guaranteed. Day Hagan DISCLAIMS ANY AND ALL EXPRESS OR IMPLIED WARRANTIES, INCLUDING, BUT NOT LIMITED TO, ANY WARRANTIES OF MERCHANTABILITY, SUITABILITY, OR FITNESS FOR A PARTICULAR PURPOSE OR USE. All performance measures do not reflect tax consequences, execution, commissions, and other trading costs, and as such, investors should consult their tax advisors before making investment decisions, as well as realize that the past performance and results of the model are not a guarantee of future results. The Smart Sector® Strategy is not intended to be the primary basis for investment decisions and the usage of the model does not address the suitability of any particular in Fixed Income vestment for any particular investor.
Using any graph, chart, formula, model, or other device to assist in deciding which securities to trade or when to trade them presents many difficulties and their effectiveness has significant limitations, including that prior patterns may not repeat themselves continuously or on any particular occasion. In addition, market participants using such devices can impact the market in a way that changes the effectiveness of such devices. Day Hagan believes no individual graph, chart, formula, model, or other device should be used as the sole basis for any investment decision and suggests that all market participants consider differing viewpoints and use a weight-of-the-evidence approach that fits their investment needs.
Past performance does not guarantee future results. No current or prospective client should assume future performance of any specific investment or strategy will be profitable or equal to past performance levels. All investment strategies have the potential for profit or loss. Changes in investment strategies, contributions or withdrawals and economic conditions may materially alter the performance of your portfolio. Different types of investments involve varying degrees of risk, and there can be no assurance that any specific investment or strategy will be suitable or profitable for a client’s portfolio. Historical performance results for investment indexes and/or categories generally do not reflect the deduction of transaction and/or custodial charges or the deduction of an investment management fee, the incurrence of which would have the effect of decreasing historical performance results. There can be no assurances that a portfolio will match or outperform any particular benchmark.
Day Hagan Asset Management is registered as an investment adviser with the United States Securities and Exchange Commission. SEC registration does not constitute an endorsement of the firm by the Commission nor does it indicate that the adviser has attained a particular level of skill or ability.
There may be a potential tax implication with a rebalancing strategy. Re-balancing involves selling some positions and buying others, and this activity results in realized gains and losses for the positions that are sold. The performance calculations do not reflect the impact that paying taxes would have, and for taxable accounts, any taxable gains would reduce the performance on an after-tax basis. This reduction could be material to the overall performance of an actual trading account. Day Hagan does not provide legal, tax or accounting advice. Please consult your tax advisor in connection with this material, before implementing such a strategy, and prior to any withdrawals that you make from your portfolio.
There is no guarantee that any investment strategy will achieve its objectives, generate dividends or avoid losses.
© 2025 Day Hagan Asset Management
