
Day Hagan Smart Sector® with Catastrophic Stop Strategy Update October 2025
A downloadable PDF copy of the Article:
Day Hagan Smart Sector® with Catastrophic Stop Strategy Update October 2025 (pdf)
Executive Summary
September was an interesting month. Whether you were bullish or bearish, there was data to support your stance. For example, expectations of eventual Fed rate cuts, steadier corporate earnings, and resilient demand supported upside momentum. On the other hand, weakening consumer sentiment and softening labor dynamics clouded the outlook. The Conference Board’s consumer confidence measure declined, reflecting growing concerns about job availability and inflationary pressures. The U.S. labor market was no longer delivering broad upside surprises: August payrolls data was revised lower, and new job creation remained muted. Inflation remained sticky, with core PCE holding near 2.9 percent, reinforcing the Fed’s caution. Moreover, the possibility of a U.S. government shutdown introduced volatility and anxiety over data flow and fiscal exposures.
Global pressures also mattered. Oil prices spiked early in the month due to supply constraints and later receded, fueling uncertainty in input costs for energy, materials, and industrials. Meanwhile, trade and tariff dynamics remained key undercurrents. U.S. reciprocal tariffs and broad trade tensions continued to influence global supply chains, especially affecting export-sensitive and industrial sectors. Japan and China data (e.g., PMIs and policy direction) were reflected in investor positioning, influencing sectors exposed to global cyclical demand.
At the index level, breadth and technical momentum held up reasonably well for much of the month, but late-month reversals and rotation pressures crept in as some macro indicators cooled. The market was broadly resilient, but the contrast between relatively strong sectors and cyclically vulnerable ones became more pronounced.
Sector Dynamics & Drivers:
The Technology and Communication Services sectors benefited from strong secular themes and AI investment momentum, resulting in relative outperformance compared to broader cyclicals. Within these sectors, earnings expectations versus growth multiples remained central. The sensitivity of tech to interest rates (discounting) meant they were vulnerable when rate cut expectations cooled, but they held up better than many cyclicals because of their growth tilt.
The Consumer Discretionary sector held up on sustained consumer spending and strength in some digital and retail names. However, discretionary margins were pressured by rising input costs, wage growth, and soft sentiment, making the premium and luxury sectors more volatile.
Consumer Staples typically act as a defensive anchor as economic concerns mount. Its lower beta and stable demand characteristics made it more resilient amid weaker confidence. That said, input inflation and margin squeeze were visible pressures, and the sector underperformed during the month.
Healthcare showed relative stability. In a mixed macro environment, its lower sensitivity to economic cycles and some improved regulatory visibility helped, but pricing pressures and regulatory risk (especially around drug pricing) remain key watchpoints.
Financials drew strength from steeper yield curves, which support net interest income, and from expectations that rate cuts would support credit demand. However, concerns about loan losses or macroeconomic stress also tempered the rally potential, especially in the banking sector.
Industrials and Materials had a bifurcated month. They initially benefited from commodity strength and reopening themes, but later faced challenges from weaker global growth signals, supply chain disruptions, and tariff risks. Companies linked to infrastructure, transportation, or heavy capital goods saw more dispersion based on order flow visibility. Defense continued to show relative strength.
Energy was driven largely by fluctuations in commodity prices. Early in the month, tight supply and OPEC cuts provided tailwinds, but as global demand concerns grew, energy names felt headwinds. OPEC also decided to raise production quotas. Capex discipline and balance sheet strength separated winners from laggards.
Utilities underperformed relative to the broader market. Rising rates, declining odds of rate cuts, and risk-on shifts diminished the appeal of yield in that sector, while regulatory or fuel cost pressures added to the headwinds.
Real Estate/REITs were pressured by rate sensitivity and the impact of the discount rate. However, strong pockets (e.g., industrial/logistics) with strong lease growth or secular demand could outperform weaker or rate-sensitive property subsegments.
Materials & Mining/Metals & Mining saw mixed outcomes. Base and precious metals benefited from commodity strength, supply constraints, and inflation hedging demand. But weaker demand from industrial end markets and cost pressures diluted gains in some materials names.
In sum, September was characterized by a backdrop where growth and secular themes (especially in tech, communication, and selective discretionary) held up despite macro caution. More cyclically exposed sectors, such as industrials, materials, and energy, showed greater dispersion, while defensive and yield-sensitive sectors contended with rate headwinds. The interplay between macro surprises, global demand cues, commodity strength, rate expectations, and rotation dynamics shaped relative returns across the 11 S&P 500 sectors.
Holdings
Sector
Consumer Discretionary
Consumer Staples
Communication Services
Energy
Financials
Health Care
Industrials
Information Technology
Materials
Real Estate
Utilities
Outlook (relative to benchmark weighting)
Neutral
Overweight
Overweight
Underweight
Neutral
Neutral
Underweight
Overweight
Underweight
Neutral
Underweight
Sector Review
Consumer Discretionary: Positive indicators for the Consumer Discretionary sector include short- and intermediate-term moving average crosses, relative price momentum, overbought/oversold positioning, net new highs, consumer credit trends, and housing starts. These highlight constructive technical and macro underpinnings. Negative indicators were tied to price deviation from trend (indicating an extended upmove), relative forward valuations, and the sticky 30-year Treasury yield, signaling pressure from valuation and rate sensitivity. Discretionary spending registered neutral. Overall, the mix demonstrated strong technical support, albeit tempered by valuation and macroeconomic headwinds. We remain neutral.
Commentary: The Conference Board’s consumer confidence index dropped 3.6 points to 94.2, reaching its weakest reading since April, as consumers grew more concerned about inflation and labor markets. Meanwhile, the University of Michigan sentiment reading slipped to 55.4, pressured by elevated price expectations and increased focus on macro risks. Tariff announcements in September—such as new duties on lumber, cabinets, and related imports—added uncertainty for import-exposed consumer goods and supply chains. In media and advertising, the IAB lowered its 2025 ad growth forecast, flagging concerns about spending cuts in tariff-sensitive sectors. Among top names, Amazon’s scale in e-commerce and AWS provided some ballast, though margin pressure from logistics and input costs weighed internally. Tesla’s narrative remained tied to EV demand, but negative signals surfaced as its Full Self-Driving feature drew criticism from buyers. Cautious consumer budgets challenged Home Depot’s exposure to home improvement spending, while McDonald’s had steadier demand but continued to contend with wage and commodity cost pressures. Booking’s (BKNG) sensitivity to travel trends meant that weaker global growth and inflation fears dampened forward visibility. Overall, discretionary names bore the brunt of fading sentiment, tariff risk, and rising cost structures. The sector’s September performance reflected a tug between resilient core spending and weakening consumer confidence, with the former dominating the narrative.
Figure 1: Housing starts data have been showing a slight improvement and are now a positive underpinning for the sector. A reversal back below the lower bracket would return the indicator to its neutral position.
Consumer Staples: The Consumer Staples sector continues to provide stability in an otherwise uncertain market backdrop. Our composite model has improved, with positive signals coming from short-term momentum, decelerating financial conditions, and steady food sales growth. These factors point to a supportive foundation for the sector. While some technical indicators remain mixed—such as longer-term moving averages and valuations—staples’ role as a defensive anchor remains clear, particularly as households navigate persistent inflation and shifting spending patterns. For these reasons, we are overweight.
Commentary: In September, the sector lagged the broader market as investors favored more cyclical industries. However, underlying demand for everyday essentials remained firm. Retail sales surprised to the upside, highlighting that consumers continue to prioritize core goods even as confidence measures softened. Importantly, staples tend to hold up best in periods when households are cautious, as steady demand provides greater visibility into revenues and earnings. Cost pressures from commodities, tariffs, and currency swings continue to challenge margins, but large, diversified companies have proven resilient by leveraging scale, pricing power, and strong brand recognition. This adaptability allows staples to absorb volatility more effectively than many other sectors. In addition, rising short interest signals that investors are actively hedging risk, which can set the stage for relative outperformance if broader market volatility increases. Looking ahead, while valuations remain elevated compared to historical norms, the sector’s combination of stable demand, defensive positioning, and pricing flexibility makes it an attractive holding in a period of heightened uncertainty. As economic data continues to point to mixed growth, staples are positioned to provide consistency and downside protection within diversified portfolios.
Figure 2: The relative breadth of Consumer Staples has reached “so bad its good” levels.
Communication Services: The sector remains a market leader, supported by bullish moving average crosses, deviation from trend, the yield curve, and relative earnings yield indicators, reflecting a supportive technical positioning and valuation. Negative signals emerged from one overbought/oversold measure, indicating short-term resistance pressure, while another overbought/oversold reading remained neutral. This may lead to a period of short-term consolidation. Overall, the sector showed broad technical and macro support with only limited near-term caution from momentum conditions. We remain modestly overweight.
Commentary: The Communication Services sector contended with weakening consumer sentiment, advertising retraction, and macro uncertainty. The Conference Board reported that consumer confidence declined by 3.6 points to 94.2, indicating heightened concern about job prospects and business conditions. In the ad market, the IAB revised its 2025 U.S. ad-spend growth forecast downward from 7.3% to 5.7%, citing tariff pressure and macroeconomic headwinds. Major names reflected sector-level stress points and differentiated exposures. Alphabet and Meta faced margin and revenue sensitivity due to softening ad budgets and a decline in macroeconomic sentiment, as advertisers tightened their spending, especially in tariff-sensitive verticals. Netflix faced headwinds to subscriber growth as consumers weighed discretionary media spending amid inflationary pressures. Warner Bros. Discovery faced content cost inflation and distribution challenges in a compressed advertising environment. Electronic Arts’ growth outlook was sensitive to fluctuations in gaming demand, and its exposure to global supply chains and currency volatility increased volatility. From a quantitative lens, the sector’s beta to consumer sentiment and ad budgets increased noticeably. Its correlation to discretionary consumption and digital ad spends made it vulnerable to cuts in marketing and media from advertisers responding to weaker consumer data. However, components with stronger recurring revenue or platform lock-in had some insulation. Overall, September indicated that Communication Services is becoming more cyclically sensitive in the current backdrop, where macroeconomic softness and advertising pressure are key drags, and only differentiated digital and platform efficiency can offset downside risks.
Figure 3: The Communication Services sector is now overbought on a short-term basis.
Energy: The composite model improved slightly last month, but recent pronouncements by OPEC+ regarding production increases have created a headwind. Positive indicators for energy include overbought/oversold positioning, volatility trends, crude spot prices, a declining rig count, and lower oil supply measures, indicating constructive technical and macro underpinnings. Negative indicators were found in sector breadth, moving average crossovers, and free cash flow yield momentum, signaling pressure from participation, fundamentals, and commodity pricing. The dollar relationship was neutral. Overall, the sector reflected broad support with select valuation and participation headwinds. We are slightly underweight.
Commentary: Early in the month, the EIA reported that U.S. commercial crude inventories rose by 3.9 million barrels (to 424.6 million barrels) in the week ending September 5, reflecting a build ahead of seasonal demand. Later in September, inventories declined: the week ending September 25 saw a 2.0-million-barrel draw, alongside a 3.2-million-barrel draw in distillates, signaling a tightening in the supply chain. On the global front, the EIA’s Short-Term Energy Outlook projected that production would exceed consumption in 2025 by about 2 to 3 million barrels per day, exerting downward pressure on prices. Meanwhile, oil prices spiked mid-month after surprise inventory draws, with futures jumping 3 % to a seven-week high. However, concerns over rising supply—especially from OPEC+ lifting output—tempered upside expectations. Tensions in Russia-Ukraine also affected market sentiment: drone attacks on refineries and disruptions in pipeline flows raised the risk premium for energy names. Major energy companies faced differentiated exposures. For integrated majors such as ExxonMobil and Chevron, refining margins and crude throughput were key drivers. Exxon announced around 2,000 job cuts tied to restructuring in September, underscoring the pressure to reduce costs. Midstream and gas names, such as Williams Companies (WMB), remained sensitive to natural gas and pipeline flow assumptions, while independent producers, like EOG and ConocoPhillips, had more leverage to margin and break-even price shifts. For refiners and processors like MPC, the distillate and gasoline inventories and spreads became a central concern. Across the sector, exchange rate fluctuations, capital expenditure discipline, and hedging strategies helped mitigate some volatility. In summary, September saw a tug-of-war between supply draws and surplus risk, with inventory surprises and geopolitical shocks intermittently boosting relative sector support, while forward supply forecasts and margin pressures kept the narrative in check.
Figure 4: Profitability (cash flow trends) is still an issue for the Energy sector.
Financials: The composite model turned negative, and we are reducing exposure in response. Bullish indicators included longer-term trend measures, improving business credit conditions, stronger loan growth, a forward earnings yield, and a favorable yield curve, highlighting constructive fundamentals and macroeconomic drivers. Negative indicators spanned shorter-term price trends and momentum, overbought/oversold measures, increasing volatility, relatively higher drawdowns on pullbacks, slowing global economic surprises (outside of the U.S.), a weaker U.S. dollar, and too-tight credit spreads, reflecting pressure from technical weakness, macroeconomic uncertainty, and funding costs.
Commentary: The U.S. Financials sector was driven by changing interest rate expectations, regulatory developments, liquidity pressures, and credit sensitivity. In mid-September, the Federal Reserve cut the federal funds rate by 25 basis points to a new range of 4.00%–4.25%, marking its first rate reduction of the year. The effective federal funds rate reached ~4.09% in late September. This move recalibrated expectations around net interest margins, funding costs, and lending demand. Regulatory and policy shifts—including updates to banking oversight regimes and reduced enforcement pressures—also factored into investor sentiment. Within the sector, diversified names such as Berkshire Hathaway (BRK.B) benefited from broad portfolio exposure and insurance cash flows under lower rates. Large banks, such as JPMorgan Chase (JPM), Bank of America, and Wells Fargo (WFC), faced tradeoffs between pressure on margin compression and improved credit delinquency rates due to easing rates and moderated macroeconomic growth. Payment networks, such as Visa (V) and Mastercard (MA), remained sensitive to transaction volume and consumer spending trends, with downside risk tied to weakening consumption. Goldman Sachs (GS) and boutique financial firms were influenced by capital markets activity, underwriting pipelines, and wealth management flows, particularly in light of volatility and credit market spreads. Across the group, loan growth expectations, funding cost curves, and credit loss assumptions were re-examined in light of shifting macroeconomic and policy dynamics. In summary, September was a month in which rate easing, liquidity rebalancing, and regulatory signals influenced the relative performance of financial subsectors, with winners determined by their ability to adapt to compressed margins, changing funding dynamics, and recalibrated credit risk.
Figure 5: Business credit conditions pulled back over the first part of the year and have since been rebounding. Constructive for Financials.
Healthcare: Positive indicators for health care include a bullish short-term momentum reversal indicator, increasing medical care pricing opportunities, and valuations based on book yield, signaling supportive fundamentals and technical recovery potential. Negative indicators include relative price trends, longer-term momentum, weak breadth, increasingly volatile drawdowns, and lower healthcare personal expenditures, pointing to weak participation and macroeconomic pressure. New health care facility construction activity was neutral. Overall, the sector showed selective support from pricing dynamics and sector trend but remained constrained by broader technical weakness and consumer-related spending headwinds. We remain neutral.
Commentary: The U.S. Healthcare sector absorbed a mix of policy, regulatory, and structural pressures. In late September, the White House struck a deal with Pfizer to institute most-favored-nation drug pricing for Medicaid in exchange for tariff relief, a move that had a ripple effect on investor sentiment in the pharmaceutical and biotech sectors. Separately, a Commerce Department import probe targeting medical devices rattled medtech names, triggering uncertainty around cross-border supply chains and cost pass-throughs. At the regulatory front, Congress held hearings in early September on the role of AI in health care advancement, signaling oversight interest in novel technologies. The GAO also released a report mid-month on consolidation trends in physician practices, drawing attention to the concentration dynamics within Medicare and Medicaid markets. Large healthcare names responded in a differentiated fashion. Eli Lilly and Merck were buoyed by the potential tariff relief environment and avoided more aggressive pricing penalties. The device and diagnostics units of Abbott felt direct pressure from the import probe. UnitedHealth and insurers faced renewed scrutiny as the drug pricing deal raised questions about utilization, reimbursement, and margin compression. Across the sector, risk models and valuations were re-weighted to account for policy risk, tariff exposure, and regulatory reset. In aggregate, healthcare in September was dominated by shifts around pricing policy and trade enforcement, with earnings and revenue trajectories taking a back seat to structural and regulatory realignment.
Figure 6: Health Care shows signs of being oversold but hasn’t yet put in a decisive reversal.
Industrials: The composite model improved with the October update. Bullish indicators include lower relative sector volatility, an oversold RSI, fewer new lows, positive commodity sensitivity, a weaker U.S. dollar, and improved industrial production segments, highlighting constructive technical and macroeconomic factors. Negative indicators include weak momentum measures, deteriorating cash flow and sales yields, and weakness in oil futures, indicating a potential economic hiccup that points to pressure from fundamentals and select commodity exposures. Consumer confidence was neutral. Overall, the sector showed broad technical and macro support but remained constrained by weaker fundamentals and specific cyclical sensitivities. We remain underweight.
Commentary: The sector faced a mix of weakening demand, cost pressure from tariffs, and supply chain friction that constrained upside. The S&P Global “flash” PMI showed business activity potentially slowing, with the composite output index dropping to 53.6 from 54.6 in August, reflecting softer new orders growth and cooling momentum. Tariff-driven input costs weighed down new orders in manufacturing, while firms reported elevated inventory levels of unsold goods. The logistics and transport sector faced tighter conditions: the Logistics Managers’ Index registered 58.9, although transportation utilization decreased by 3.4 points, and transportation prices rose to 61.5, indicating heightened cost pressure in freight and shipping. For blue-chip industrial names, performance was driven by exposure to capital goods, defense, aerospace, and mobility. GE and Caterpillar were sensitive to global capital expenditure cycles; subdued order flow and tariff uncertainty constrained visibility of backlog. Boeing faced ongoing supply disruptions, regulatory pressure, and cautious commercial airline demand forecasts. RTX (formerly defense/aviation) benefited from defense spending expectations, though procurement timelines and geopolitical risk remained headwinds. Uber and other mobility-oriented companies faced cost inflation, fuel price headwinds, and uncertainty in discretionary travel behavior. Eaton and related electrical/infrastructure firms were influenced by utility and grid investment pacing, with regulatory uncertainty and commodity input volatility acting as constraints. Across the sector, sensitivity to interest rates, capital intensity, and visibility into the order pipeline drove investor scrutiny. In aggregate, September’s performance in Industrials was shaped by moderation in demand, input cost escalation, supply chain strain, and selective exposure to defense or infrastructure themes that offered a partial offset to cyclical pressure.
Figure 7: Higher commodity prices imply stronger demand, ostensibly from better economic activity. As the chart shows, commodity prices are generally trending higher.
Information Technology: All of the indicators for the Information Technology sector are bullish, including momentum, overbought/oversold measures, sales yield, inflation expectations, short interest, and earnings revision breadth. Together, these define a backdrop of constructive technical signals, favorable valuation dynamics, and supportive earnings trends. The absence of negative or neutral signals underscores broad alignment across technical, fundamental, and macro dimensions. Overall, the sector demonstrated comprehensive strength, with strong participation and supportive forward expectations. We are slightly overweight.
Commentary: The U.S. Information Technology sector was driven by accelerating investment in AI infrastructure, export control pressures, and talent dynamics. Nvidia and Intel announced a strategic partnership to deploy 10 gigawatts of computing infrastructure, reinforcing demand for high-performance hardware. At the same time, China’s regulators banned the sale of some RTX-Pro chips, reducing regional demand for U.S. GPU exports. Tech hiring projections remained strong: the U.S. tech sector’s Net Employment Outlook for Q4 was 46%, down slightly but still well above global averages, reflecting continued demand for digital skills. Leading names responded unevenly to these pressures. Apple’s fall product event in early September reinforced expectations for premium device upgrades, helping offset some weakness in consumer electronics. Microsoft and Oracle leaned on cloud and enterprise income to absorb regional hardware softening. Semiconductor and chip names saw volatility tied to export controls and geopolitical risk. Stock selection depended heavily on exposure to AI, cloud scale, semiconductor sensitivity, and regulatory dependencies. From a quantitative perspective, the sector’s beta to global technology policy and trade risk rose during the month. Correlations with semiconductors and data center capital expenditures expanded, while sensitivity to interest rates and discount multiples remained a drag as optimism for rate cuts cooled. In aggregate, September’s IT sector performance was shaped by the interplay between secular AI and cloud investments, as well as cross-border trade headwinds. The winners were firms that could combine scale, innovation, and regulatory resilience.
Figure 8: Last month, this indicator was oversold. As of the October 1 update, it has entered overbought territory.
Materials: After peaking earlier in 2025, the Materials sector composite model remains in negative territory. Positive indicators include lower relative volatility, copper and silver showing upside momentum, natural gas returning to higher levels, a relatively high sales yield, and improving industrial production data, all indicating constructive signals from commodities and macroeconomic output. Negative indicators were concentrated in moving average crosses, short-term momentum, overbought/oversold measures, deviation from trend, equity momentum linkages, gold futures, and earnings yield, reflecting weak technicals and valuation pressure. Price trends are neutral. Overall, the sector demonstrated selective commodity and macro support but exhibited broader technical weakness. We are underweight.
Commentary: The U.S. Materials sector encountered headwinds from soft global demand, supply shocks, and commodity volatility. Copper supply was disrupted by a mudslide at the Grasberg mine in Indonesia, triggering force majeure and tightening global fundamentals. Base metals broadly rallied in response, despite long-term forecasts remaining cautious regarding oversupply narratives. Meanwhile, metal prices overall slipped 0.3% during the period, according to World Bank data, while precious metals gained 0.9%. Commodity markets faced conflicting signals as industrial metals struggled with weak demand expectations, while safe-haven flows pushed up the prices of gold and silver. Earnings for the Materials sector underperformed consensus by about 1% relative to forecasts—reflecting margin compression amid rising input costs and weaker end-market demand. Key names, such as Linde, Sherwin-Williams, and Nutrien, among others, were sensitive to price swings in inputs like copper, chemicals, and specialty materials. Tariff pressures—including copper import tariffs instituted in August—added cost uncertainty for firms with global sourcing exposure. Volatility and correlation with industrial production increased for materials stocks, but many were re-rated based on earnings revisions and sensitivity to commodity cycles. September’s performance in Materials was shaped by the clash between supply disruption-driven metal rallies and weakening industrial demand expectations, with margin pressure and policy risks amplifying dispersion across stocks.
Figure 9: Historically, better equity performance in Emerging Markets has been bullish for the Materials sector. However, there are signs that DM is gaining ground and EM is rolling over.
Real Estate: The composite model improved this month. Indicators supporting an increase in exposure include better breadth, the homebuilding sub-industry showing relative strength, unemployment data holding steady, the 30-year Treasury yield moving slightly lower, and positive U.S. economic surprises, suggesting constructive macro and sector drivers. Negative indicators include some longer-term trend measures, a lower relative percentage of positive days, deviation from trend indicators that have not yet decisively reversed from oversold lows, and a decline in construction supply production (albeit following an inventory build in anticipation of tariffs), reflecting technical weakness and cyclical headwinds. Overall, the sector demonstrated meaningful macro support but remained constrained by a weak price structure and selective industrial exposure. We increased exposure and are now neutral.
Commentary: The U.S. Real Estate sector was driven by shifts in interest rate expectations, housing market cooling, and REIT sensitivity to capital costs. The Federal Reserve’s mid-month rate cut reset yield curves and prompted a reevaluation of discount rates for property cash flows. Commercial REITs underperformed broader equities, signaling weaker relative momentum. On the residential side, home price growth had already lost traction, with year-over-year growth decelerating to ~1.4% by July, according to home price indices released ahead of September. Elevated inventory and slowing absorption were also cited in September housing market updates. These dynamics pressured leasing markets and valuation assumptions for REITs. Institutional investors and analysts adjusted their assumptions, incorporating cap rate expansion and higher financing spreads. Tax developments were also in focus as the September REIT Tax News bulletin covered evolving regulatory and structural changes impacting REITs. Top names in the sector—such as Prologis, Equinix, Welltower, Realty Income, and SPG—reacted to lease rollover risk, funding spreads, leverage flexibility, and property sector exposure (including industrial, office, healthcare, and retail). Given rate sensitivity, REITs with more stable cash flows and lower leverage were positioned defensively. September’s sector performance centered on rate repricing, weaker housing fundamentals, and yield compression pressure, with dispersion emerging between high-quality, low-leverage REITs and more cyclical property exposures.
Figure 10: Historically, when the percentage of positive days reaches a low and reverses, the Real Estate sector has done well on a relative basis. At this point, the indicator hasn’t turned. When it does, we’ll look to add exposure.
Utilities: The composite model remains negative but has recently shown moderate improvement from extremely bearish levels. Positive indicators include short-term price reversal measures, momentum, short-term overbought/oversold signals, improved manufacturing data, and a still-competitive relative dividend yield, indicating selective technical and macro support. Negative indicators spanned moving average crosses, another longer-term overbought/oversold reading, deviation from trend, breadth, crude oil sensitivity, earnings yield relative to Treasuries, the copper/gold ratio, and capacity utilization, reflecting broad structural and macro headwinds. Overall, the sector showed pockets of technical and income-based support but remained challenged by weak trends and rate-sensitive dynamics. We remain slightly underweight.
Commentary: The U.S. Utilities sector reacted to a revaluation of rate-sensitive cash flows, elevated grid demand, and regulatory risk. The Fed’s mid-month rate cut lowered yield curve expectations and forced investors to reassess discount rates applied to utility dividends and regulated earnings. In parallel, data center expansion put stress on regional grids; utilities announced multi-billion‐dollar capital plans to upgrade transmission and distribution infrastructure, anticipating technology-driven demand growth. One utility unveiled a $65 billion plan spanning 2035 to support the rising load needs associated with electrification trends. Meanwhile, amid rising electricity prices, analysts have flagged the sector as “attractively valued” due to its defensive character and stable cash flows. Utilities with flexible capital structures and regulated rate base footing were better insulated from rising input and permit costs. Where grid or generation bottlenecks existed, outages or capacity constraints added premium risk. In modeling, leveraging rate curve moves, allowing for return on equity (ROE) assumptions, and load growth sensitivity were key differentiators. In summary, September’s utilities narrative centered on recalibrating discount rates, accelerating infrastructure demands, and regulatory path risk, with investors focusing on firms that could deliver stable, regulated growth amid shifting demand dynamics.
Figure 11: The Utilities sector shows signs of reversing from longer-term overbought levels.
Catastrophic Stop Update
The Catastrophic Stop model combines time-tested, objective indicators designed to identify high-risk periods for the equity market. The model entered October recommending a fully invested equity allocation relative to the benchmark.
The DH Catastrophic Stop model level is 50%, indicating that investors should maintain their benchmark equity exposure.
Our perspective remained relatively unchanged over the month of September. The excessive optimism noted last month moderated slightly. We have been anticipating a consolidation phase as sentiment and technical indicators mean-reverted toward more normalized levels. We will closely monitor overbought and oversold conditions to identify potential reversals before issuing new buy signals.
Balancing modestly ongoing political and Fed policy uncertainty (though leaning more dovish), tech and AI stock capital expenditures versus return on capital, tariff-related volatility, the potential for additional Fed rate cuts, broad corporate earnings strength, solid consumer spending, still-good capital flows into ETFs (mostly by retail), and safe-haven inflows (like gold, signaling defense) ultimately leads to the same conclusion: Some excesses still need to be worked down, but given the better economic outlook, supported by corporate earnings forecasts, we currently don’t expect an extended decline. Should our models shift more negative, we will quickly move to reduce risk.
The weight of the evidence suggests that any weakness is unlikely to extend into a significant downtrend at this time. Of course, if our model triggers a sell signal (below 40% for two consecutive days), indicating more substantial problems, we will raise cash immediately.
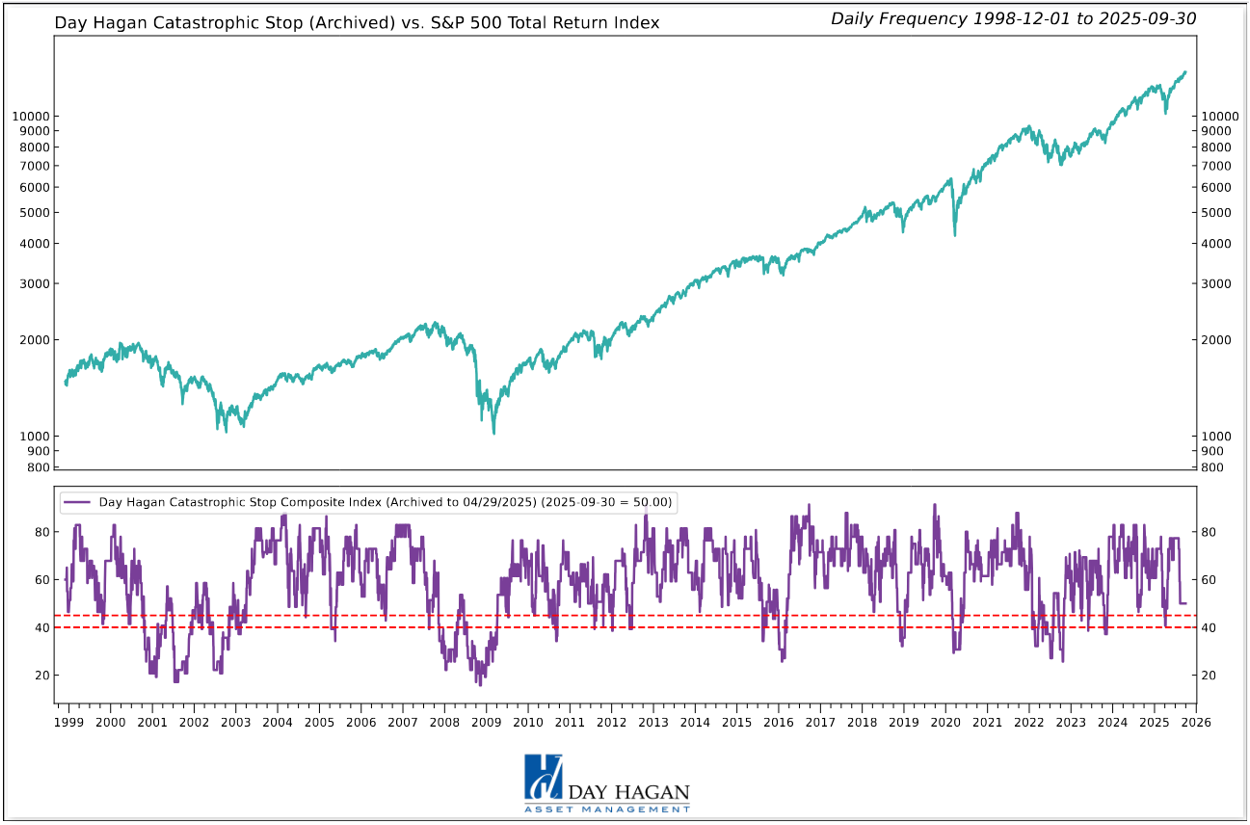
Figure 12: The Catastrophic Stop model recommends a fully invested equity position (relative to the benchmark). Due to the use of indices to extend model history, the model is considered hypothetical.
The Day Hagan Daily Market Sentiment Composite remains on a sell signal, reflecting a shift in investor sentiment from excessive optimism to a neutral stance. Historically, this transition acts as a headwind for equities until excessive optimism subsides, typically indicated by a drop below the 30 threshold, which signals the transition into excessive pessimism.
Figure 13: Investor sentiment is being reset, as illustrated by the DH Daily Market Sentiment Composite declining below 70. A decline below 30 would be a nice setup for a year-end rally.
Our goal is to stay on the right side of the prevailing trend, introducing risk management when conditions deteriorate. Currently, the uptrend remains intact. The broader-based composite models calling U.S. economic growth, international economic growth, inflation trends, liquidity, and equity demand remain constructive. The Catastrophic Stop model is positive, and we are aligned with the message. If our models shift to bearish levels, we will raise cash.
This strategy utilizes measures of price, valuation, economic trends, monetary liquidity, and market sentiment to make objective, rational, and unemotional decisions about how much capital to allocate and where to invest that capital.
Day Hagan Asset Management
1000 S. Tamiami Trl
Sarasota, FL 34236
Toll Free: (800) 594-7930
Office Phone: (941) 330-1702
Website: https://dayhagan.com or https://dhfunds.com
This material is for educational purposes only. Further distribution is prohibited without prior permission. Please see the information on Disclosures and Fact Sheets here: https://dhfunds.com/literature. Charts with models and return information use indices for performance testing to extend the model histories, and they should be considered hypothetical. All Rights Reserved. (© Copyright 2025 Day Hagan Asset Management.)
Day HaganSmart Sector®
With Catastrophic Stop ETF
Symbol: SSUS
Disclosures
The data and analysis contained within are provided "as is" and without warranty of any kind, either express or implied. The information is based on data believed to be reliable, but it is not guaranteed. Day Hagan DISCLAIMS ANY AND ALL EXPRESS OR IMPLIED WARRANTIES, INCLUDING, BUT NOT LIMITED TO, ANY WARRANTIES OF MERCHANTABILITY, SUITABILITY, OR FITNESS FOR A PARTICULAR PURPOSE OR USE. All performance measures do not reflect tax consequences, execution, commissions, and other trading costs, and as such, investors should consult their tax advisors before making investment decisions, as well as realize that the past performance and results of the model are not a guarantee of future results. The Smart Sector® Strategy is not intended to be the primary basis for investment decisions and the usage of the model does not address the suitability of any particular in Fixed Income vestment for any particular investor.
Using any graph, chart, formula, model, or other device to assist in deciding which securities to trade or when to trade them presents many difficulties and their effectiveness has significant limitations, including that prior patterns may not repeat themselves continuously or on any particular occasion. In addition, market participants using such devices can impact the market in a way that changes the effectiveness of such devices. Day Hagan believes no individual graph, chart, formula, model, or other device should be used as the sole basis for any investment decision and suggests that all market participants consider differing viewpoints and use a weight-of-the-evidence approach that fits their investment needs.
Past performance does not guarantee future results. No current or prospective client should assume future performance of any specific investment or strategy will be profitable or equal to past performance levels. All investment strategies have the potential for profit or loss. Changes in investment strategies, contributions or withdrawals and economic conditions may materially alter the performance of your portfolio. Different types of investments involve varying degrees of risk, and there can be no assurance that any specific investment or strategy will be suitable or profitable for a client’s portfolio. Historical performance results for investment indexes and/or categories generally do not reflect the deduction of transaction and/or custodial charges or the deduction of an investment management fee, the incurrence of which would have the effect of decreasing historical performance results. There can be no assurances that a portfolio will match or outperform any particular benchmark.
Day Hagan Asset Management is registered as an investment adviser with the United States Securities and Exchange Commission. SEC registration does not constitute an endorsement of the firm by the Commission nor does it indicate that the adviser has attained a particular level of skill or ability.
There may be a potential tax implication with a rebalancing strategy. Re-balancing involves selling some positions and buying others, and this activity results in realized gains and losses for the positions that are sold. The performance calculations do not reflect the impact that paying taxes would have, and for taxable accounts, any taxable gains would reduce the performance on an after-tax basis. This reduction could be material to the overall performance of an actual trading account. Day Hagan does not provide legal, tax or accounting advice. Please consult your tax advisor in connection with this material, before implementing such a strategy, and prior to any withdrawals that you make from your portfolio.
There is no guarantee that any investment strategy will achieve its objectives, generate dividends or avoid losses.
© 2025 Day Hagan Asset Management
