
Day Hagan Smart Sector® Fixed Income Strategy Update October 2025
A downloadable PDF copy of the Article:
Day Hagan Smart Sector® Fixed Income Strategy Update October 2025 (pdf)
Executive Summary
Fixed income returns in September were driven by a potent intersection of monetary policy shifts, abundant supply, and evolving risk premiums across sectors. The net result was generally lower yields worldwide.
Treasuries were initially under pressure from heavy issuance and shifting demand dynamics. The Treasury scheduled auctions across key tenors; for example, the 30-year bond auction on September 11 cleared at 4.651%, down from the prior benchmark of 4.813%, signaling strong investor demand for long-duration paper. The $39 billion reopening of 10-year notes also drew above-average foreign demand: the bid-to-cover ratio rose to 2.65, and indirect bidders claimed 83.1%, pushing yields below prior levels. Meanwhile, the 7-year note auction faced weaker demand, with a bid-to-cover ratio of 2.40. On the supply front, the Treasury announced plans to auction $69 billion in 2-year, $70 billion in 5-year, and $44 billion in 7-year notes. The Treasury’s heavier borrowing needs (with Q3 issuance estimated at over $1 trillion in net marketable debt) added pressure on yields. Monetary policy significantly influenced the Treasury’s behavior. At the September FOMC meeting, the Fed delivered a 25-basis-point cut, bringing the federal funds rate to 4.00–4.25%. The dovish pivot reinforced expectations of further cuts by year-end, compressing short-end yields. Globally, central banks diverged: the Bank of Canada cut its policy rate to 2.5 % in mid-September. The ECB, pressured by softer growth, remained more measured in its pace, creating cross-border flow differentials.
Corporate credit remained a focal point. The corporate primary market roared back to life: in the first week of September, issuers tapped nearly $70 billion in IG bonds, exceeding forecasts and reflecting confidence in credit flows. Tight spreads persisted, aided by low-risk investor demand seeking yield over Treasury equivalents.
High Yield continued to benefit from carry, as default expectations remained stable and refinancing activity stayed robust. With the Fed easing tone, leveraged issuers gained breathing room, reinforcing demand for lower-rated credits.
Emerging Market debt responded positively to the global easing narrative. Lower U.S. rates, improved appetite for yield, and relatively stable local macro conditions fueled spread compression in both sovereign and corporate EM segments.
TIPS, in this shifting regime, saw nuanced dynamics: breakevens held steady as inflation expectations remained anchored, while real yields adjusted downward in sympathy with nominal yields. Demand for linkers remained supported by the Fed’s renewed tolerance for inflation variability.
Overall, fixed income markets reflected the interplay of issuance dynamics, monetary policy recalibration, and cross-border capital flows. Treasury auctions were mixed: long-duration paper saw robust foreign participation, while intermediate tenors revealed weaker bid-to-cover ratios, underscoring persistent concerns about the scale of U.S. borrowing. The Federal Reserve’s 25 bps policy rate cut recalibrated the short end of the curve, but structural supply pressures kept term premia elevated.
Investment-grade corporates benefited from resilient fundamentals and heavy primary issuance that was readily absorbed, while high-yield spreads remained near historic tight amid subdued defaults and strong refinancing activity. Emerging market debt rallied on improved global liquidity and supportive policy divergence, as ECB and Bank of Canada easing enhanced relative yield appeal. Inflation-linked securities (TIPS) saw breakevens stabilize, suggesting inflation expectations were well-anchored despite headline volatility.
Holdings
Fixed Income Sector
US 1-3 Month T-bill
US 3-7 Year Treasury
US 10-20 Year Treasury
TIPS (short-term)
US Mortgage-Backed
US Floating Rate
US Corporate
US High Yield
International Corporate Bond
Emerging Market Bond
Outlook (relative to benchmark)
Overweight
Neutral
Neutral
Neutral
Neutral
Underweight
Neutral
Neutral
Underweight
Modestly Overweight
Position Details
U.S. Treasuries: U.S. long-term Treasuries exhibited improving relative strength across most technical indicators, including momentum and relative equity market comparisons, signaling supportive conditions and a tilt toward quality. However, negative readings remained in place based on inflation expectations and credit default swaps (a too-low risk premium), reflecting macro headwinds (economic activity perking up slightly). The balance of signals suggests that long-duration assets continue to gain traction relative to risk assets, but inflation pressures remain a concern. We are currently overweight at the shorter end of the curve.
Commentary: September was a pivotal month for U.S. Treasuries, marked by the intersection of heavy issuance, central bank recalibration, and shifting global flows. The Treasury’s borrowing needs surged, with auctions across the 2-, 5-, 7-, 10-, and 30-year maturities drawing mixed demand. Long bonds performed well, with the 30-year auction clearing at lower yields than the prior reopening, reflecting strong foreign sponsorship. By contrast, the 7-year auction met weaker demand, highlighting investor caution around intermediate maturities. Monetary policy was equally influential. The Federal Reserve reduced the funds rate by 25 basis points to a 4.00–4.25% range, citing cooling labor markets and gradually moderating inflation. This cut anchored the front end of the curve, while heavy supply and fiscal concerns kept longer-term yields sticky. The move reinforced expectations for additional easing into year-end, but term premia remained elevated as investors assessed the sustainability of debt. Globally, the Bank of Canada and ECB leaned dovish, adding to the demand for U.S. duration as investors sought both yield and liquidity.
Figure 1: CDS rates are increasing, potentially due to U.S. government shutdown concerns.
U.S. TIPS: U.S. TIPS are supported by RSI indicators near oversold levels, rising commodity price trends, and moving average crosses, reflecting supportive positioning in risk-adjusted terms. Neutral momentum mean reversion points to a temporary pause in trend confirmation. Negative signals include narrow high-yield spreads and flattening inflation expectations, highlighting the limits to further upside from credit risk and pricing dynamics. Overall, the signal set indicates that TIPS maintains constructive technical support, but the potential for decelerating inflation remains a headwind.
Commentary: Treasury Inflation-Protected Securities (TIPS) posted slightly positive returns in September, balancing softer inflation data with evolving monetary and currency dynamics. The headline CPI moderated slightly, although core inflation remained near 3%, keeping inflation expectations anchored but not accelerating. Breakeven inflation rates across 5- and 10-year maturities held broadly stable, signaling market conviction that price pressures were contained despite supply-side volatility. The Federal Reserve’s 25 bps rate cut lowered nominal yields, and real yields adjusted downward in parallel, providing technical support for TIPS. Importantly, Powell’s post-meeting remarks emphasized policy flexibility, which widened the distribution of possible inflation outcomes—a dynamic supportive of inflation-linked assets. Currency movements also influenced global demand. The U.S. dollar’s firming against the euro and yen made dollar-denominated assets relatively more expensive for foreign investors. However, for unhedged buyers, TIPS continued to offer a compelling combination of positive real yields and embedded inflation protection. International central banks reinforced this appeal. The Bank of Canada’s September cut and the ECB’s cautious dovishness created a backdrop of falling developed-market real rates, enhancing relative value for U.S. linkers. By month-end, TIPS had delivered modestly positive returns, driven by real yield compression rather than expanding breakevens.
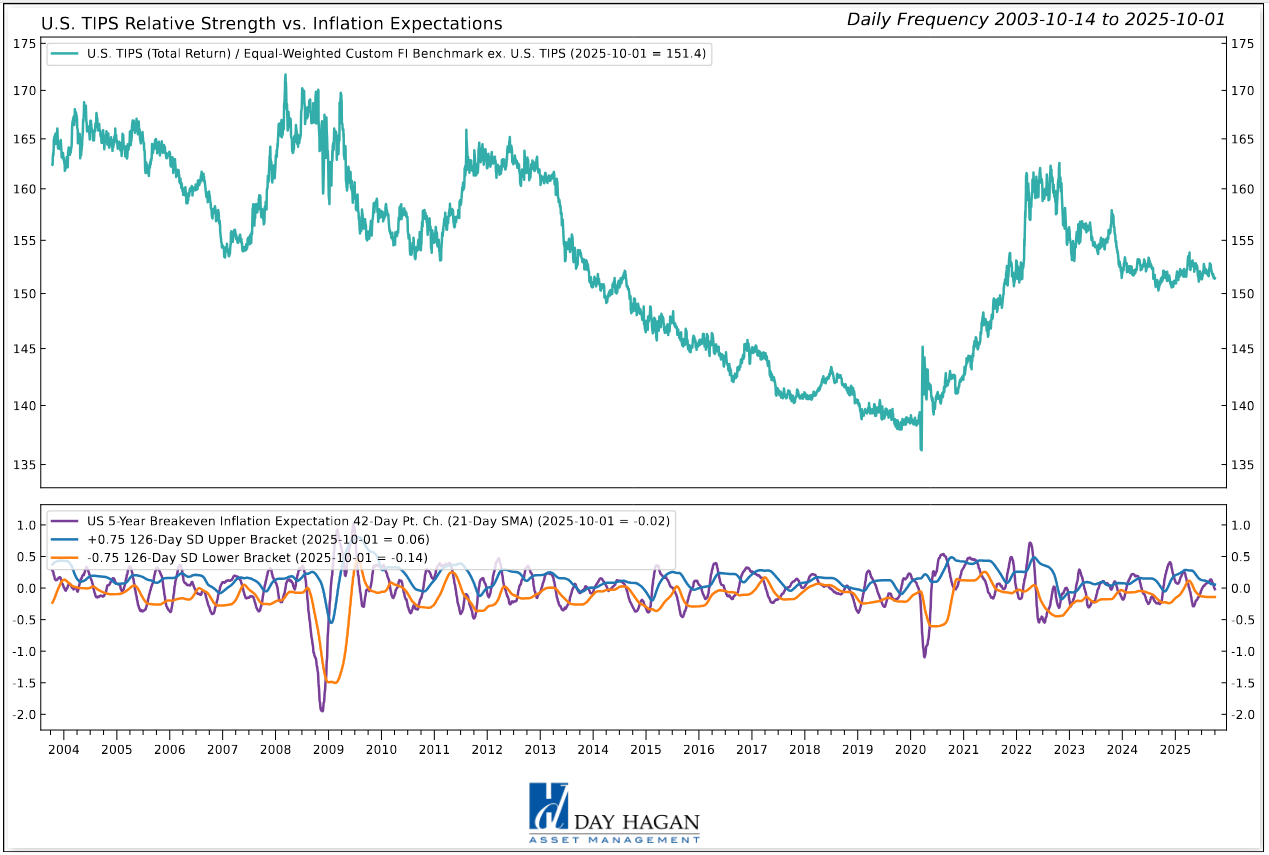
Figure 2: Inflation expectations are rolling over longer term. Negative for TIPS.
U.S. Mortgage-Backed Securities: U.S. MBS demonstrated positive relative strength, supported by technical indicators such as a moving average cross, RSI, 10-year yield comparisons, and RS slope. However, there are some negative signals, including narrow high-yield spreads and still-sticky inflation expectations, which suggest sensitivity to credit risk and potential macroeconomic reacceleration. Overall, the indicator profile suggests that MBS is holding up. Given the mix of indicator readings, we remain neutral.
Commentary: Agency mortgage-backed securities (MBS) reacted to Treasury issuance, evolving monetary policy, and shifting housing dynamics. As Treasury supply surged, spreads on MBS widened modestly, reflecting relative value adjustments as investors weighed duration exposure across government-related sectors. Mortgage rates held near 6.5%, keeping refinancing volumes low and reducing prepayment risk. For MBS investors, this stability in cash flows supported higher-coupon pools, though overall origination remained subdued. Housing market data showed softer sales but resilient prices, which reduced credit concerns and helped anchor investor confidence. Monetary policy shifts also mattered. The Federal Reserve’s 25 bps cut signaled a pivot toward accommodation, but its ongoing balance sheet runoff kept downward pressure on agency MBS valuations. With the Fed no longer a dominant buyer, private investors absorbed the bulk of issuance, requiring higher risk premia. Currency movements played an indirect role. The firm’s U.S. dollar-denominated hedging limited foreign hedged returns, although relative spreads versus global alternatives kept MBS attractive to unhedged buyers. By month-end, MBS delivered modest excess returns over Treasuries, largely through carry and stable prepayment dynamics, while spread volatility underscores sensitivity to both supply and liquidity conditions.
Figure 3: MBS reached overbought levels and reversed. A move below the lower bracket would provide a better setup for increasing exposure.
U.S. Floating Rate Notes: The U.S. Floating Rate Notes composite model is negative based on bearish readings from short-term momentum, directional slope indicators, and narrow OIS swap rates, signaling persistent underperformance and limited technical support. A neutral signal versus VIX extremes indicates no clear volatility-driven catalyst. Overall, the composite highlights weak positioning for FRNs in relative terms, with technical and rate-based measures aligned against the asset class and few offsetting positives to suggest near-term improvement.
Commentary: Because their coupons reset with short-term Treasury bill yields, FRNs continued to deliver elevated income early in the month. However, the Federal Reserve’s 25 bps policy rate cut to 4.00–4.25% immediately lowered the trajectory of future resets, moderating forward carry expectations. Economic signals reinforced this repricing. Cooling labor markets and moderating core inflation strengthened the Fed’s case for easing, leading investors to adjust expectations for additional rate cuts into year-end. As a result, secondary-market demand for newly issued FRNs softened slightly, with bid-to-cover ratios at September auctions coming in below long-term averages. Unlike longer-duration Treasuries, FRNs were insulated from supply-driven volatility tied to heavy issuance. Their short duration and predictable cash flows provided ballast in portfolios navigating curve steepening and rate uncertainty. By month-end, FRN returns were modest but steady, reflecting their role as a carry vehicle rather than a source of capital gains.
Figure 4: Relative momentum for Floating Rate Notes is negative.
U.S. IG Corporates: Positive indicators of support for corporates include credit default swaps and the U.S. dollar, suggesting relative resilience to credit risk and supportive currency dynamics. However, the majority of indicators are negative, including implied bond volatility, option-adjusted spreads, technical cross, and price mean reversion. These readings point to unfavorable technical momentum and potential spread pressures. Taken together, the signal set reflects a defensive but constrained backdrop for aggregate bonds, with limited technical support.
Commentary: U.S. investment-grade (IG) corporate bond spreads remained compressed around multi-decade lows as investors continued to prize high-quality credit over volatile government securities. The heavy wave of new issuance—nearly $70 billion in the first week alone—was absorbed with ease, underscoring robust demand for corporate paper despite elevated Treasury supply. Economic fundamentals lent support. Corporate earnings trends showed stable leverage ratios and healthy interest coverage, easing concerns about credit deterioration. Monetary policy contributed a further tailwind. The Federal Reserve’s 25 bps rate cut reinforced expectations of lower funding costs, improving the refinancing outlook for issuers. At the same time, a slightly firmer U.S. dollar enhanced relative appeal for foreign investors, particularly unhedged buyers seeking yield pickup versus euro and yen credit alternatives. Global central bank divergence amplified cross-border flows, with the ECB and Bank of Canada easing at a faster clip. In that context, U.S. IG credit offered both liquidity and yield, making September another month where strong technicals offset broader concerns around Treasury issuance and fiscal sustainability.
Figure 5: Bond volatility levels are neutral for U.S. IG Corporates.
U.S. High Yield: Positive U.S. high-yield bond indicators include the small-cap equity uptrend and moving average crosses, indicating selective relative strength in equity-correlation-linked and return-based comparisons. However, most indicators are negative, including the longer-term relative trend, weakening high-yield bond breadth, the VIX moving average crossing, and the option-adjusted spread potentially reversing from very low levels. These reflect weaker internal credit participation, volatility sensitivity, and spread pressure. Overall, the balance of signals suggests limited upside in the relative strength of high-yield bonds, despite some supportive measures.
Commentary: High-yield bonds extended their positive momentum in September, supported by steady fundamentals and a favorable policy backdrop. Spreads tightened marginally, remaining near historically low levels, as investors continued to prioritize carry over concerns about late-cycle risk. Economic conditions underpinned this resilience. Job growth appears balanced, and there are signs of a pickup in GDP momentum. Corporate earnings in sub-investment-grade issuers were broadly stable. Importantly, defaults remained well below long-term averages, with refinancing activity brisk as companies took advantage of the Federal Reserve’s rate cut to extend maturities and reduce funding costs. This refinancing wave eased near-term credit stress, bolstering confidence in the sector. With the ECB and Bank of Canada easing more aggressively, U.S. high yield benefited from global portfolio reallocation into higher-yielding assets. Combined with a firm equity market, sentiment toward risk assets remained constructive, allowing high-yield to deliver another month of incremental spread compression and steady carry returns.
Figure 6: We’re closely monitoring the negative reversal in High-Yield bond breadth.
International IG Bonds: Global IG Corporate bonds remain under pressure. The composite’s broader signal set is negative, with bearish readings from measures of relative strength slope, moving average crosses, option-adjusted spreads, and credit default swaps. These point to unfavorable technical momentum, widening spread pressures, and heightened credit sensitivity. Overall, the balance suggests that global aggregates hold some risk-off appeal, but technical weaknesses and credit dynamics are likely to constrain the upside potential.
Commentary: In Europe, the ECB maintained a dovish bias, cutting rates earlier in the quarter, which pushed euro-denominated sovereign yields lower and kept corporate spreads anchored. As a result, euro IG bonds delivered modestly positive total returns, with carry as the primary driver. In Canada, the Bank of Canada reduced its policy rate to 2.5% in mid-September, responding to slowing consumer demand and easing inflation. This further compressed Canadian credit yields and supported inflows into local IG debt. In contrast, Asia displayed more heterogeneity: while Japan’s policy remained ultra-accommodative, several emerging Asian markets saw central banks hold steady, preserving relative yield premiums. Overall, September underscored how international IG performance was driven less by credit fundamentals—which remained stable—and more by global rate differentials, currency shifts, and central bank policy divergence across developed markets.
Figure 7: International IG Corporate CDS rates are trending higher.
Emerging Market Bonds: The EM composite model is uniformly positive. Strength is evident based on the relative EM currency basket, emerging equity momentum, commodity market performance, and the absolute moving average cross, with additional confirmation from the relative strength slope indicator. This alignment indicates broad technical support, favorable macroeconomic support, and resilience across asset class comparisons. With no offsetting negatives, the signal set underscores strong relative positioning for EM USD debt, reflecting synchronized support from currency, equity, and commodity dynamics. We remain modestly overweight.
Commentary: The Federal Reserve’s 25 bps rate cut reduced U.S. front-end yields, easing external financing conditions for EM sovereigns and corporates. This allowed several high-beta issuers to extend maturities at manageable costs, keeping default risks contained. Economic signals across EM regions were mixed but broadly constructive. In Latin America, inflation continued to decelerate, enabling central banks in Brazil and Chile to maintain accommodative stances. Asia demonstrated resilience in trade-driven economies, such as India and Korea, while targeted fiscal measures in China helped steady sentiment despite lingering weakness in the property sector. The modestly stronger U.S. dollar created headwinds for local-currency EM debt, particularly in frontier markets, yet hard-currency bonds benefited as spreads compressed modestly. Investor appetite was supported by attractive carry relative to developed markets, with inflows concentrated in sovereign hard-currency benchmarks. Global central bank divergence also buoyed EM. The ECB and Bank of Canada’s easing moves reinforced the global search for yield, and portfolio reallocations favored higher-yielding EM assets.
Figure 8: Emerging Market equity momentum has supported EM bond prices. A decline below the 0 line would lead us to reduce exposure. Getting closer.
Catastrophic Stop Model
The Catastrophic Stop model combines time-tested, objective indicators designed to identify high-risk periods for equities and assets with high correlations to the equity market. The model entered October recommending a fully invested allocation relative to the benchmark for credit sectors with high correlations to equities.
The DH Catastrophic Stop model level is 50%, indicating that investors should maintain their benchmark equity exposure.
Our perspective remained relatively unchanged over the month of September. The excessive optimism noted last month moderated slightly. We have been anticipating a consolidation phase as sentiment and technical indicators mean-reverted toward more normalized levels. We will closely monitor overbought and oversold conditions to identify potential reversals before issuing new buy signals.
Balancing modestly ongoing political and Fed policy uncertainty (though leaning more dovish), tech and AI stock capital expenditures versus return on capital, tariff-related volatility, the potential for additional Fed rate cuts, broad corporate earnings strength, solid consumer spending, still-good capital flows into ETFs (mostly by retail), and safe-haven inflows (like gold, signaling defense) ultimately leads to the same conclusion: Some excesses still need to be worked down, but given the better economic outlook, supported by corporate earnings forecasts, we currently don’t expect an extended decline. Should our models shift more negative, we will quickly move to reduce risk.
The weight of the evidence suggests that any weakness is unlikely to extend into a significant downtrend at this time. Of course, if our model flips negative (below 40% for two consecutive days), signaling more substantial problems, we will raise cash immediately.
Figure 9: The Catastrophic Stop model recommends a fully invested position (relative to the benchmark). Note: Due to the use of indices to extend model history, the model is considered hypothetical.
The Day Hagan Daily Market Sentiment Composite remains on a sell signal, reflecting a shift in investor sentiment from excessive optimism to a neutral stance. Historically, this transition acts as a headwind for equities until excessive optimism subsides, typically indicated by a drop below the 30 threshold, which signals the transition into excessive pessimism.
Figure 10: Investor sentiment is being reset as illustrated by the DH Daily Market Sentiment Composite declining below 70. A decline below 30 would be a nice setup for a year-end rally.
Our goal is to stay on the right side of the prevailing trend, introducing risk management when conditions deteriorate. Currently, the uptrend remains intact. The broader-based composite models calling U.S. economic growth, international economic growth, inflation trends, liquidity, and equity demand remain constructive. The Catastrophic Stop model is positive, and we are aligned with the message. If our models shift to bearish levels, we will raise cash.
This strategy utilizes measures of price, valuation, economic trends, monetary liquidity, and market sentiment to make objective, rational, and unemotional decisions about how much capital to place at risk and where to allocate that capital.
For more information, please contact us at:
Day Hagan Asset Management
1000 S. Tamiami Trl
Sarasota, FL 34236
Toll Free: (800) 594-7930
Office Phone: (941) 330-1702
Website: https://dayhagan.com or https://dhfunds.com
© 2025 Day Hagan Asset Management
This material is for educational purposes only. Further distribution is prohibited without prior permission. Please see the information on Disclosures and Fact Sheets here: https://dhfunds.com/literature. Charts with models and return information use indices for performance testing to extend the model histories, and they should be considered hypothetical. All Rights Reserved. (© Copyright 2025 Day Hagan Asset Management.)
Day Hagan Smart Sector® Fixed Income ETF
Symbol: SSFI
Disclosures
The data and analysis contained within are provided "as is" and without warranty of any kind, either express or implied. The information is based on data believed to be reliable, but it is not guaranteed. Day Hagan DISCLAIMS ANY AND ALL EXPRESS OR IMPLIED WARRANTIES, INCLUDING, BUT NOT LIMITED TO, ANY WARRANTIES OF MERCHANTABILITY, SUITABILITY, OR FITNESS FOR A PARTICULAR PURPOSE OR USE. All performance measures do not reflect tax consequences, execution, commissions, and other trading costs, and as such, investors should consult their tax advisors before making investment decisions, as well as realize that the past performance and results of the model are not a guarantee of future results. The Smart Sector® Strategy is not intended to be the primary basis for investment decisions and the usage of the model does not address the suitability of any particular in Fixed Income vestment for any particular investor.
Using any graph, chart, formula, model, or other device to assist in deciding which securities to trade or when to trade them presents many difficulties and their effectiveness has significant limitations, including that prior patterns may not repeat themselves continuously or on any particular occasion. In addition, market participants using such devices can impact the market in a way that changes the effectiveness of such devices. Day Hagan believes no individual graph, chart, formula, model, or other device should be used as the sole basis for any investment decision and suggests that all market participants consider differing viewpoints and use a weight-of-the-evidence approach that fits their investment needs.
Past performance does not guarantee future results. No current or prospective client should assume future performance of any specific investment or strategy will be profitable or equal to past performance levels. All investment strategies have the potential for profit or loss. Changes in investment strategies, contributions or withdrawals and economic conditions may materially alter the performance of your portfolio. Different types of investments involve varying degrees of risk, and there can be no assurance that any specific investment or strategy will be suitable or profitable for a client’s portfolio. Historical performance results for investment indexes and/or categories generally do not reflect the deduction of transaction and/or custodial charges or the deduction of an investment management fee, the incurrence of which would have the effect of decreasing historical performance results. There can be no assurances that a portfolio will match or outperform any particular benchmark.
Day Hagan Asset Management is registered as an investment adviser with the United States Securities and Exchange Commission. SEC registration does not constitute an endorsement of the firm by the Commission nor does it indicate that the adviser has attained a particular level of skill or ability.
There may be a potential tax implication with a rebalancing strategy. Re-balancing involves selling some positions and buying others, and this activity results in realized gains and losses for the positions that are sold. The performance calculations do not reflect the impact that paying taxes would have, and for taxable accounts, any taxable gains would reduce the performance on an after-tax basis. This reduction could be material to the overall performance of an actual trading account. Day Hagan does not provide legal, tax or accounting advice. Please consult your tax advisor in connection with this material, before implementing such a strategy, and prior to any withdrawals that you make from your portfolio.
There is no guarantee that any investment strategy will achieve its objectives, generate dividends or avoid losses.
© 2024 Day Hagan Asset Management
