
Day Hagan Smart Sector® International Strategy Update November 2025
A downloadable PDF copy of the Article:
Day Hagan Smart Sector® International Strategy Update November 2025 (pdf)
Executive Summary
Global Equity Performance: A Regional Snapshot
Global equity markets in October reflected a mix of optimism and caution. Strong corporate earnings, particularly in the technology sector, and expectations of monetary easing improved investor sentiment. Equity funds experienced significant inflows in early October, the highest in nearly a year, as weaker U.S. inflation and a disappointing jobs report raised hopes for Federal Reserve rate cuts.
However, macroeconomic and structural risks tempered enthusiasm: the International Monetary Fund lowered growth projections, while concerns about trade tensions, geopolitical crises, and high valuations—especially in AI-linked tech stocks—heightened risk perceptions. Overall, equity gains across developed markets remained modest, as mild inflation and resilient earnings balanced a backdrop of uncertainty.
Emerging markets posted notable gains, driven by stimulus discussions in China and a weaker U.S. dollar. Emerging-market sovereign debt also delivered positive returns, supported by higher real yields and favorable rate differentials.
Several key factors currently support global equities. Corporate earnings are solid across regions, providing a strong foundation for markets. Investor confidence is also fueled by expectations that the Federal Reserve will ease policy as inflation moderates. Additionally, long-term growth trends, especially in technology and productivity linked to AI investment, offer structural advantages. Fiscal policies and government support in key economies are helping counteract growth challenges. Lastly, with significant cash reserves and low-interest rates, there is motivation for investors to allocate to equities.
However, bearish risks are also present. Elevated valuations may make markets susceptible to disappointments in growth or earnings. Major economies are experiencing softening growth, with downside risks from trade disruptions and labor-market issues. Policy uncertainty remains a factor, as persistent inflation or central bank missteps could unsettle markets. High debt levels and strained fiscal conditions in many countries add systemic risk. Furthermore, market participation is narrow, concentrated in a few large tech companies, raising concerns about volatility if market leadership weakens.
Lastly, the U.S. government shutdown is injecting uncertainty into global equity markets, prompting slight drawdowns and increased safe-haven positioning. International trade flows are also vulnerable as regulatory delays and risk-off sentiment disrupt business activity. While past shutdowns have rarely derailed long-term trends, this episode’s confluence with weakening data and fragile growth environments elevates the risk of broader economic spill-over.
Conclusion
Global equities are benefiting from strong earnings, expected rate cuts, secular growth themes, policy support, and abundant liquidity. However, elevated valuations, slowing growth, policy ambiguity, heavy debt burdens, and concentrated market leadership pose meaningful risks—leaving markets optimistic yet vulnerable.
Holdings
Core: Developed Market Positions (approximately 65% of equity holdings)
Country
Australia
Canada
China
France
Germany
Japan
Switzerland
United Kingdom
Outlook
Underweight
Neutral
Overweight
Underweight
Overweight
Overweight
Underweight
Underweight
Explore: Emerging Market Positions (approximately 35% of equity holdings)
Poland
Sweden
Philippines
Italy
Mexico
Position Details
Core: Developed Market Commentary
Approximately 65% of the strategy is allocated across eight of the largest markets in the ACWI ex-U.S. Index. The fund overweights and underweights the largest non-U.S. equity markets based on macro, fundamental, behavioral, and technical indicators.
Australia: MSCI Australia’s relative-strength signals are broadly weak across most measures. Adaptive and absolute moving averages, the AU/US interest-rate differential, gold, and the ACWI technical scorecard are all bearish, suggesting underperformance and limited momentum support. Relative valuation also screens poorly, with the earnings yield signal flagging a disadvantage relative to global peers. Taken together, these indicators imply that Australia remains a laggard in both trend and cross-asset comparisons, with few signs of improving leadership. On the positive side, relative beta to ACWI screens as bullish, indicating that when global markets advance, Australia may participate more fully than recent performance suggests. Meanwhile, the bear-market-bounce indicator is neutral, implying no material tailwinds or headwinds from mean-reversion dynamics. Overall, the indicators' balance is negative, with only isolated supportive factors.
Commentary: The RBA kept the cash rate at 3.60% on November 4, signaling a steady stance while assessing recent price momentum. October PMIs showed a split: manufacturing slipped into contraction at 49.7, services stayed in expansion at 52.5, and the composite eased to 52.1. Inflation context was mixed: the quarterly CPI accelerated to 3.2% y/y in Q3, and the Monthly CPI Indicator was 3.5% y/y in September, with the October “complete” monthly CPI scheduled for late November. With growth steady but uneven across sectors, markets weighed whether the RBA’s pause persists into December as PMIs hover near 50 and disinflation progress remains gradual.
Figure 1: Gold has stalled, which is negative for Australia’s stock market.
Canada: MSCI Canada’s relative-strength profile skews negative, but there is one notable positive. On the bullish side, the Triple Moving Average Diffusion Index is supportive, signaling improving trend breadth and the potential for sustained relative momentum if global risk appetite holds. Offsetting this, several readings are bearish: mean reversion argues against further outperformance after recent moves; the absolute moving-average cross points to a weak primary trend; the ACWI technical scorecard signals deteriorating global-relative setup; linkage to OECD leading indicators suggests macro headwinds; sensitivity to the CAD-USD exchange rate is unfavorable; and the relative earnings-yield metric indicates a valuation handicap versus global peers. Net-net, Canada has a narrow trend-based tailwind overshadowed by other negative technical, macro, currency, and valuation signals. We are neutral.
Commentary: After the October 25 bp cut, the overnight rate entered November at 2.25%. Activity gauges improved: manufacturing rose to 49.6 (nine-month high), services returned to expansion at 50.5, and the composite reached 50.3—suggesting stabilization at the start of Q4. The Ivey PMI cooled to 52.4, pointing to slower—but still positive—broad business conditions. Inflation remained contained heading into November: headline CPI was 2.4% y/y in September, with core measures around the high-2s. Long yields hovered a little above 3% in early November, reflecting the softer growth backdrop and the BoC’s step-down in policy rates.
Figure 2: Canada’s relative strength mean reversion indicator is showing signs of reversing from oversold conditions.
China: China’s relative-strength signals are mixed, with several constructive readings but important headwinds. On the bullish side, mean-reversion dynamics and the absolute moving-average cross suggest improving trend support. Relative strength versus the emerging-markets currency basket is also favorable, indicating China may benefit when EM FX is stable or appreciating. Conversely, multiple indicators remain bearish. Relative price momentum continues to lag, signaling weak follow-through despite recent stabilization. PMI-linked signals point to soft macro conditions, while widening high-yield credit spreads imply funding stress and lingering balance-sheet concerns. Bear-market-bounce indicators are neutral, offering no clear tactical tailwind. Overall, China shows early signs of technical improvement, supported by currency-related factors, but weak growth signals, poor momentum, and credit-market pressure leave the broader backdrop challenged. We remain modestly overweight.
Commentary: Benchmark lending rates stayed mostly unchanged: the 1-year LPR at 3.00% and the 5-year at 3.50% into November. October PMIs were mixed. The official NBS manufacturing PMI fell to 49.0 (contraction), while the private-sector (Rating Dog/S&P Global) manufacturing PMI moderated to 50.6 (still expansion). Services eased to 52.6 and the composite to 51.8, signaling slower—but ongoing—growth. Policy attention turned to credit transmission (MLF/LPR channels) and external demand, as firms reported softer new orders and cautious hiring.
Figure 3: China’s PMIs have stalled. In response, monetary and fiscal authorities are in stimulus mode. Now we need to see the stimulus translate into economic growth.
France: MSCI France’s relative-strength profile is broadly weak. Most indicators are bearish, including moving-average crosses, 200-day breadth, and cross-sectional 50-day momentum, all of which point to deteriorating trend quality. The ACWI technical scorecard and valuation scorecard also flag underperformance versus global peers, while signals tied to OECD leading indicators point to a softer macro backdrop weighing on relative returns. On the positive side, France benefits from a supportive relative dividend yield signal, suggesting some income-based appeal, and from favorable relative ETF fund flows, implying selective investor interest despite weaker trend conditions. Overall, however, the balance of evidence remains negative, with only yield and flows providing modest offsets to otherwise broad technical and macro headwinds. We remain underweight.
Commentary: With ECB policy steady, France’s October readings (published end-Oct/early-Nov) showed subdued activity and softer inflation. Manufacturing improved to 48.8 (still below 50), and the composite was revised up to 47.7, extending a contraction streak. Inflation cooled: national CPI slowed to 1.0% y/y and harmonized HICP to 0.9% y/y, with a 0.1% m/m uptick. The combination of weak private-sector demand and easing price pressures keeps the focus on margins and cost pass-through, while firms await clearer signals on euro-area demand into year-end.
Figure 4: We’re noting some breadth improvement, but not enough to significantly increase exposure. We require more indicators to turn positive.
Germany: MSCI Germany’s relative-strength picture is mixed, with several supportive factors but notable headwinds. On the bullish side, Germany screens favorably on relative dividend yield, offering an income advantage versus global peers. Relative ETF fund flows are also positive, indicating continued investor interest despite uneven performance. In addition, the EUR-USD FX relationship is supportive, suggesting currency dynamics may help underpin relative returns. However, several indicators remain bearish. The ACWI technical scorecard and the relative moving-average cross both signal a weak trend structure relative to global equities, while the manufacturing-confidence factor points to deteriorating industrial sentiment —a key macro driver for Germany. Breadth relative to the 200-day moving average and bear-market-bounce measures are neutral, offering neither confirmation nor reversal signals. Overall, Germany shows some valuation and flow-based support, aided by FX conditions, yet still struggles against soft macro signals and weak relative trend structure, keeping its broader outlook only partially constructive. We are modestly overweight in anticipation of a mean-reversion shift.
Commentary: Survey data pointed to momentum led by services. The HCOB services PMI jumped to 54.6 in October, lifting the composite to 53.9 (revised) even as manufacturing remained just under 50 at 49.6. Inflation cooled further: HICP slowed to 2.3% y/y in October (from 2.4%), consistent with a gradual disinflation path. The near-term watchpoint is whether resilient services demand can broaden into industry as new orders stabilize, while lower headline inflation reduces real-income pressure.
Figure 5: Fund flow trends started to improve and then stalled. Concerns around the political and economic environment continue to act as headwinds. Due to the oversold conditions, we added slightly.
Japan: MSCI Japan’s relative-strength backdrop is broadly constructive. Bullish signals include both absolute and relative moving-average crosses pointing to strong trend support, as well as the ACWI technical scorecard reinforcing Japan’s leadership versus global equities. Valuation measures look attractive, while forward earnings growth provides fundamental support. Sentiment indicators, including DSI reversal measures, are also favorable, and the USD/JPY relationship remains supportive, with currency dynamics helping sustain relative performance. The only notable headwind is Japan’s linkage to China’s PMI, which remains bearish and highlights sensitivity to softer regional manufacturing conditions. Overall, however, Japan’s positive trend, valuation, earnings, sentiment, and FX signals outweigh limited macro spillover risk from China, leaving its outlook firmly skewed to the upside. We remain overweight.
Commentary: Japan’s policy rate remained at 0.50% in the most recent meeting, reflecting the Bank of Japan’s cautious approach amid mixed signals. The manufacturing PMI fell to 48.2 in October, indicating contraction, while the services PMI slipped to 52.4, and the composite index stood at 51.5. Inflation remains above the 2% target in some measures, and the BoJ flagged that overall CPI (excluding fresh food) may decelerate to below 2% through early fiscal 2026. With manufacturing weaknesses and services still expanding but losing momentum, the central bank is weighing whether higher inflation will persist alongside soft demand. The BoJ continues to emphasize data dependency and is ready to adjust policy if activity strengthens and inflation becomes more firmly entrenched.
Figure 6: Forward earnings growth expectations are still positive but potentially leveling off.
Switzerland: MSCI Switzerland’s relative-strength profile leans negative, with most indicators pointing to a weak trend and limited investor sponsorship. Bearish signals include the moving-average cross, cross-sectional 50-day momentum, and relative moving-average slope, all suggesting deteriorating trend quality. Relative-value signals tied to nominal 10-year yields are also unfavorable, and ETF fund flows remain weak, suggesting reduced demand relative to global peers. Only a few indicators screen positively. Breadth relative to the 200-day average is supportive, hinting that participation beneath the surface is healthier than headline trend measures imply. In addition, Switzerland’s relative dividend yield screens favorably, providing some income appeal. Overall, the balance of evidence is bearish, with narrow yield- and breadth-based support insufficient to offset broader technical and flow-based headwinds. We are neutral.
Commentary: The SNB’s policy rate remained at 0% in November following earlier 2025 cuts, against a backdrop of very low inflation. Headline CPI eased to 0.1% y/y in October and core to 0.5% y/y. PMIs improved but stayed sub-50: manufacturing rose to 48.2 and services slipped to 47.8, indicating ongoing softness in private activity. The franc held firm versus the dollar near 0.81 per USD in early November, reinforcing tight imported-price discipline.
Figure 7: Breadth is rated neutral.
United Kingdom: MSCI U.K. relative-strength signals are mixed but tilt negative. Bearish indicators include the moving-average cross, which signals a weak underlying trend, while the GBP-USD relationship is unfavorable, suggesting that currency dynamics may constrain relative returns. The ACWI valuation scorecard also screens negatively, implying limited comparative valuation support, and linkage to U.K. OAS is bearish, reflecting credit-market conditions that may weigh on performance. On the positive side, cross-sectional price momentum is supportive, indicating selective leadership within the market. Sentiment, as measured by DSI, is also bullish, suggesting positioning and investor psychology could provide tactical upside. Overall, however, the balance of signals leans bearish, with trend, valuation, currency, and credit factors outweighing more constructive momentum and sentiment readings.
Commentary: On November 5, the BoE voted 5–4 to hold Bank Rate at 4%. October PMIs signaled modest expansion: manufacturing rose to 49.6, services to 52.3, and the composite to 51.1. Inflation context into the meeting was cooler on a 3-month view (September CPI 3.8% y/y), with October CPI due mid-November. Gilt markets watched the policy split and incoming Budget signals as investors gauged the timing of the first cut.
Figure 8: U.K. option-adjusted spreads are widening slightly. We’re monitoring this closely.
Emerging Market Positions
Approximately 30% of the strategy is allocated across five markets from a pool of more than 20 smaller markets. Selection is based on a multifactor technical ranking system using trend and mean reversion indicators. The process seeks to identify oversold opportunities within the global equity markets that are likely to mean-revert from lower levels and exhibit mild pullbacks from long-term uptrends.
Current Holdings:
Poland
Sweden
Philippines
Italy
Mexico
Explore: Emerging Market Commentary
Poland: At its recent meeting, the Narodowy Bank Polski cut the reference rate by 25 basis points to 4.25%, the lowest in roughly three-and-a-half years, reflecting weaker inflation and easing wage growth. October inflation came in at 2.8% y/y, well within the bank’s 2.5% ±1 pp target range. With inflation under control and activity showing signs of softness, policy appears to be shifting toward a modest easing cycle. The investment-activity commentary noted that while conditions are improving, external risks—especially around election outcomes and trade protectionism—are being closely monitored.
Sweden: The Sveriges Riksbank is reported to have its benchmark policy rate at 1.75 %. October PMIs revealed a services PMI of 55.4, down from September’s revised 57.9, though still comfortably in expansion territory, supported by new orders (59.9) and business output plans (64.7). Manufacturing PMI fell slightly to 55.1 from 55.6 in September but remains a relative strength. With strong service-sector data and inflation remaining below target, the Riksbank can support growth through future policy moves.
Philippines: The Bangko Sentral ng Pilipinas has held the benchmark interest rate at 5.00 % following earlier cuts in 2025. October core inflation eased to 2.5% y/y—a three-month low—down from 2.6% y/y in September. Meanwhile, annual headline inflation rose to 1.7% in September from 1.5% in August, though still comfortably below BSP’s target range. With inflation subdued and the economy showing signs of softness, monetary policy remains accommodative, while risks from higher electricity tariffs or rice tariff adjustments are flagged.
Italy: The Banca d’Italia continues in a stable interest-rate context with Italy’s implied policy rate near 2.15% in October. Data for October show the HCOB manufacturing PMI rose to 49.9 from 49.0 in September, marking a near-stabilization of the manufacturing sector. The composite PMI increased to 53.1 in October from 51.7 in September, indicating improved overall momentum. With inflation moderate and output recovering, Italian policy watchers are monitoring whether this behavioral shift extends into investment and employment.
Mexico. According to the Banco de México, the benchmark interest rate is expected to be around 7.25 % by the end of the quarter. October inflation slowed to 3.57% y/y from 3.76% in September—marking the first deceleration in three months and remaining within the central bank’s 2%-4% target. October manufacturing PMI slipped to 49.5 from 49.6 in September, showing a slight contraction. With inflation easing but industrial activity softening, the central bank appears poised to maintain a cautiously supportive stance.
Catastrophic Stop Model
The Catastrophic Stop model combines time-tested, objective indicators designed to identify high-risk periods for the equity market. The model entered November recommending a fully invested equity allocation relative to the benchmark.
The DH Catastrophic Stop model level is 50%, indicating that investors should maintain their benchmark equity exposure.
Several factors continue to underpin a constructive equity outlook. Q3 earnings have broadly exceeded expectations, pushing S&P 500 growth to ~10.7% y/y, with guidance holding up. Notably, earnings expectations for the “493” are poised to narrow the gap with the “7” over the coming quarters. Mega-cap tech remains a powerful tailwind, signaling sustained AI-driven capex through 2026 and supporting demand across semiconductors, cloud, and networking. Inflation has eased only gradually (Sept CPI +0.3% m/m, +3.0% y/y), yet markets increasingly view the Fed as less restrictive as balance-sheet runoff slows—even as Powell downplayed near-term cuts. We still see December as in play.
Resilient earnings, sustained AI investment, a less-restrictive policy backdrop, and renewed buybacks should outweigh near-term headwinds. Positioning and flows remain supportive, but a cluster of upcoming data releases could introduce episodic volatility.
The weight of the evidence suggests that any weakness is unlikely to extend into a significant downtrend at this time. Of course, if our model triggers a sell signal (below 40% for two consecutive days), indicating more substantial problems, we will raise cash immediately.
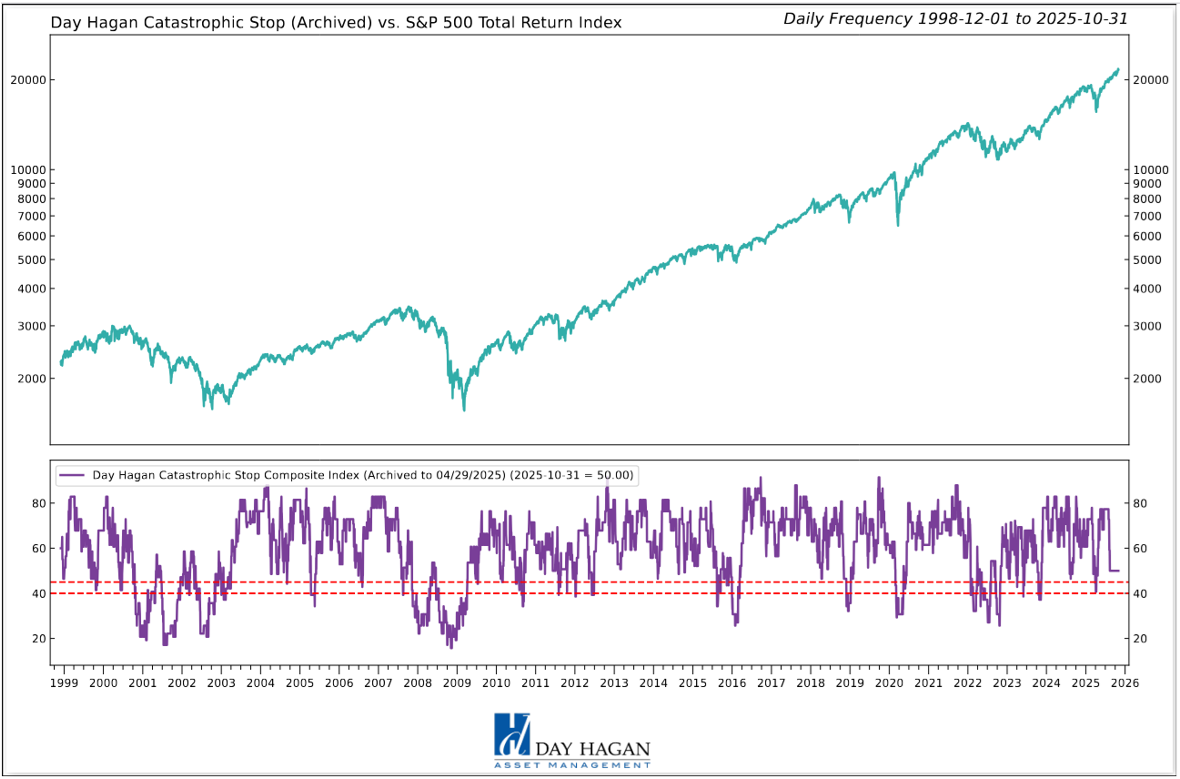
Figure 12: The Catastrophic Stop model recommends a fully invested equity position (relative to the benchmark). Due to the use of indices to extend model history, the model is considered hypothetical.
The Day Hagan Daily Market Sentiment Composite (part of the Catastrophic Stop Model) remains in the “Excessive Pessimism” zone, reflecting a notable rise in investor caution. Historically, such rapid buildups in pessimism have often preceded rebounds, suggesting a greater likelihood of a year-end rally.
As of the end of October, U.S. equity sentiment remained cautious despite new market highs. The weekly American Association of Individual Investors (AAII) Bull-Bear spread stood around 7.17, up from -5.80% the previous week, indicating more bulls than bears, but not yet extended. Fund flows showed only $1.81 billion into U.S. equities for the week ending Oct 29, pulling back sharply from ~$9.65 billion the prior week, but understandable as investors awaited the FOMC decision and presser.
Meanwhile, we’re keeping an eye on technical breadth (e.g., the percentage of S&P 500 stocks above their 50— and 200-day averages), as both measures declined into last Friday, now at 22% and 33%, respectively. (Last Monday was odd, with the worst day of market breadth ever; the market closed at an all-time high, but 80% of the stocks declined. Some divergences reversed later in the week, but this is worth remembering.)
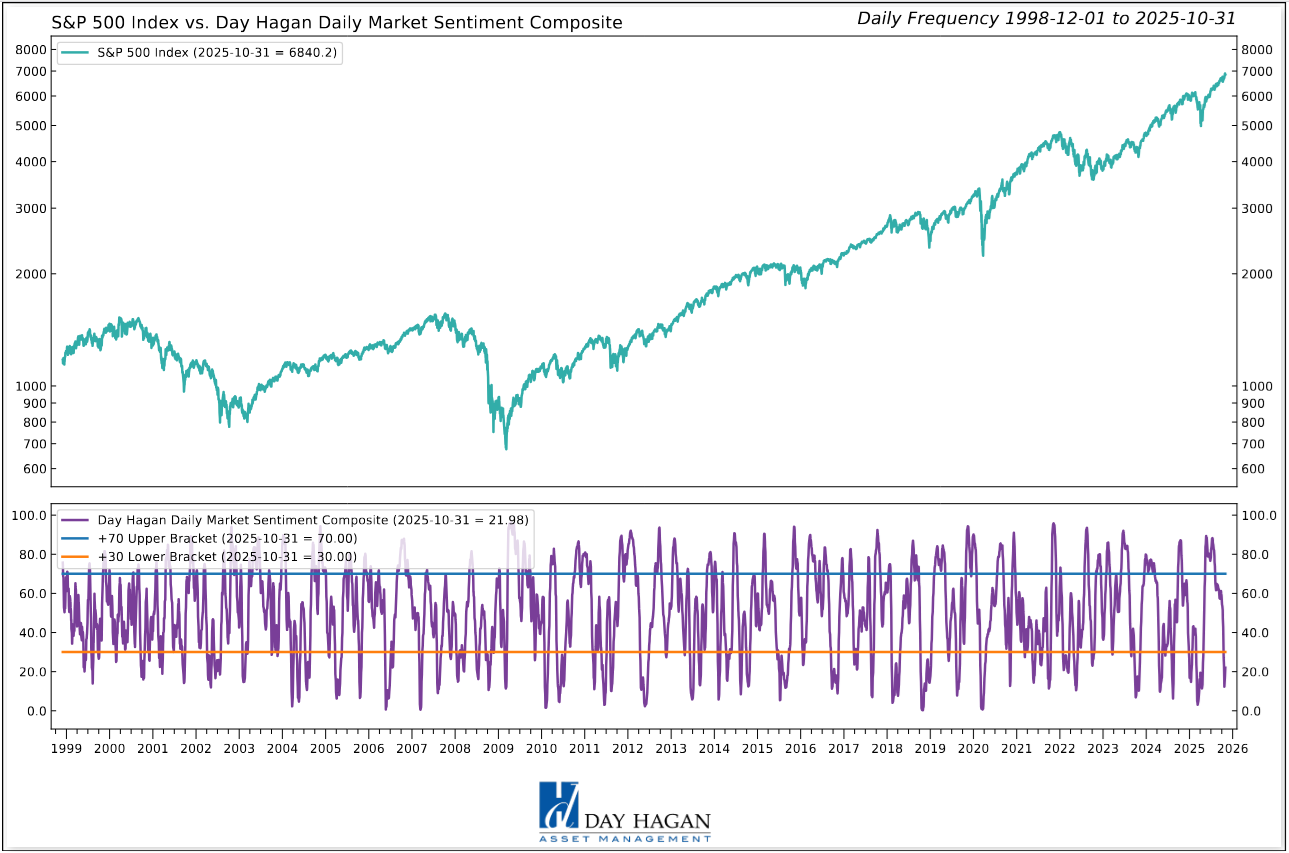
Figure 13: Investor sentiment is being reset, as illustrated by the DH Daily Market Sentiment Composite declining below 70. A decline below 30 would be a nice setup for a year-end rally.
This strategy utilizes measures of price, valuation, economic trends, monetary liquidity, and market sentiment to make objective, rational, and unemotional decisions about how much capital to place at risk and where to allocate that capital.
For more information, please contact us at:
Day Hagan Asset Management
1000 S. Tamiami Trl
Sarasota, FL 34236
Toll Free: (800) 594-7930
Office Phone: (941) 330-1702
Website: https://dayhagan.com or https://dhfunds.com
© 2025 Day Hagan Asset Management
This material is for educational purposes only. Further distribution is prohibited without prior permission. Please see the information on Disclosures and Fact Sheets here: https://dhfunds.com/literature. Charts with models and return information use indices for performance testing to extend the model histories, and they should be considered hypothetical. All Rights Reserved. (© Copyright 2025 Day Hagan Asset Management.)
Day Hagan Smart Sector® International ETF
Symbol: SSXU
Strategy Description
The Smart Sector® International strategy combines three quantitative investment strategies: Core International, Explore International, and Catastrophic Stop.
The Process Is Based On The Weight Of The Evidence
Core Allocation
The fund begins by overweighting and underweighting the largest non-U.S. equity markets based on proprietary models.
Each of the models utilizes market-specific, weight-of-the-evidence composites of fundamental, economic, technical, and behavioral indicators to determine each area’s probability of outperforming the ACWI, for example. U.S. Markets are weighted accordingly relative to benchmark weightings.
Explore Allocation
To select smaller markets, the fund uses a multi-factor technical ranking system to choose the top markets. The markets with the highest rankings split the non-core model allocation equally.
When Market Risks Become Extraordinarily High — Reduce Your Portfolio Risk
The model remains fully invested unless the Catastrophic model is triggered, whereupon the equity-invested position may be trimmed by up to 50%.
The Catastrophic Stop model combines time-tested, objective indicators designed to identify periods of high risk for the broad U.S. equity market. The model uses price-based, breadth, deviation from trend, fundamental, economic, interest rate, behavioral, and volatility-based indicator composites.
When Market Risks Return To Normal — Put Your Money Back To Work
When the Catastrophic Stop model moves back to bullish levels, indicating lower risk, the strategy will reverse toward being fully invested.
Disclosures
The data and analysis contained within are provided “as is” and without warranty of any kind, either express or implied. The information is based on data believed to be reliable, but it is not guaranteed. Day Hagan DISCLAIMS ANY AND ALL EXPRESS OR IMPLIED WARRANTIES, INCLUDING, BUT NOT LIMITED TO, ANY WARRANTIES OF MERCHANTABILITY, SUITABILITY, OR FITNESS FOR A PARTICULAR PURPOSE OR USE. All performance measures do not reflect tax consequences, execution, commissions, and other trading costs, and as such, investors should consult their tax advisors before making investment decisions, as well as realize that the past performance and results of the model are not a guarantee of future results. The Smart Sector® Strategy is not intended to be the primary basis for investment decisions, and the usage of the model does not address the suitability of any particular investment for any particular investor.
Using any graph, chart, formula, model, or other device to assist in deciding which securities to trade or when to trade them presents many difficulties, and their effectiveness has significant limitations, including that prior patterns may not repeat themselves continuously or on any particular occasion. In addition, market participants using such devices can impact the market in a way that changes the effectiveness of such devices. Day Hagan believes no individual graph, chart, formula, model, or other device should be used as the sole basis for any investment decision and suggests that all market participants consider differing viewpoints and use a weight-of-the-evidence approach that fits their investment needs.
Past performance does not guarantee future results. No current or prospective client should assume future performance of any specific investment or strategy will be profitable or equal to past performance levels. All investment strategies have the potential for profit or loss. Changes in investment strategies, contributions or withdrawals, and economic conditions may materially alter the performance of your portfolio. Different types of investments involve varying degrees of risk, and there can be no assurance that any specific investment or strategy will be suitable or profitable for a client’s portfolio. Historical performance results for investment indexes and/or categories generally do not reflect the deduction of transaction and/or custodial charges or the deduction of an investment management fee, the incurrence of which would have the effect of decreasing historical performance results. There can be no assurances that a portfolio will match or outperform any particular benchmark.
The information contained herein is provided for informational purposes only and should not be construed as investment advice or a recommendation to buy or sell any security. The securities, instruments, or strategies described may not be suitable for all investors, and their value and income may fluctuate. Past performance is not indicative of future results, and there is no guarantee that any investment strategy will achieve its objectives, generate profits, or avoid losses.
This material is intended to provide general market commentary and should not be relied upon as individualized investment advice. Investors should consult with their financial professional before making any investment decisions based on this information.
Data and analysis are provided “as is” without warranty of any kind, either express or implied. Day Hagan Asset Management, its affiliates, employees, or third-party data providers shall not be liable for any loss sustained by any person relying on this information. All opinions and views expressed are subject to change without notice and may differ from those of other investment professionals within Day Hagan Asset Management or Ashton Thomas Private Wealth, LLC.
Accounts managed by Day Hagan Asset Management or its affiliates may hold positions in the securities discussed and may trade such securities without notice.
Day Hagan Asset Management is a division of and doing business as (DBA) Ashton Thomas Private Wealth, LLC, an SEC-registered investment adviser. Registration with the SEC does not imply a certain level of skill or training.
There is no guarantee that any investment strategy will achieve its objectives, generate dividends, or avoid losses.
This material is for educational purposes only. Further distribution is prohibited without prior permission. Please see the information on Disclosures and Fact Sheets here: https://dhfunds.com/literature. Charts with models and return information use indices for performance testing to extend the model histories, and they should be considered hypothetical. All Rights Reserved. (© Copyright 2025 Day Hagan Asset Management.)
© 2025 Day Hagan Asset Management