
Day Hagan Smart Sector® Fixed Income Strategy Update November 2025
A downloadable PDF copy of the Article:
Day Hagan Smart Sector® Fixed Income Strategy Update November 2025 (pdf)
Executive Summary
Global Bond Markets – October 2025
In October, global bond markets experienced modest yield declines, though total returns were uneven across regions. The Bloomberg Global Aggregate Bond Index fell roughly 0.3% as elevated global issuance and stretched valuations weighed on returns. Monetary policy was a central driver: the Federal Reserve reduced its target range by 25 bps and lowered the interest paid on reserves to 3.90% effective October 30, but retained cautious forward guidance. Inflation data showing moderation in major economies supported yield declines, especially in long-dated maturities across the U.K., Germany, and Japan, where yield falls exceeded 30 bps. The International Monetary Fund flagged elevated risks from widening deficits and nonbank exposures, reinforcing investor caution around sovereign spreads. Currency shifts and supply-side pressures also influenced flows: a firmer U.S. dollar increased hedged cost for non-U.S. bondholders, while heavy sovereign issuance in developed markets dampened effective duration positioning.
What to Watch for November 2025
In November, key factors likely to influence global bonds include upcoming central-bank commentary on policy paths, especially as the Fed meets in December. Inflation readings due from the U.S., eurozone, and U.K. will be critical in testing whether the disinflation trend sustains. Fiscal risks remain elevated: sovereign borrowing needs are large and market sensitivity to deficits has increased. Supply volumes will be significant again, particularly in developed-market sovereigns, potentially pressuring yields. Currency volatility may re-emerge, affecting unhedged global demand. Lastly, geopolitical or trade-policy events could trigger bond-market spill-overs given stretched valuations and limited yield-premium buffers.
Holdings
Fixed Income Sector
US 1-3 Month T-bill
US 3-7 Year Treasury
US 10-20 Year Treasury
TIPS (short-term)
US Mortgage-Backed
US Floating Rate
US Corporate
US High Yield
International Corporate Bond
Emerging Market Bond
Outlook (relative to benchmark)
Overweight
Neutral
Neutral
Neutral
Neutral
Underweight
Neutral
Neutral
Underweight
Modestly Overweight
Position Details
U.S. Treasuries: U.S. long-duration Treasuries positive indicators include technical moving average cross signals, improving momentum, favorable positioning versus inflation expectations, and firm relative strength against credit risk. These factors point to constructive demand and a supportive quality bid. Offsetting this, relative strength versus the equity market is weak, indicating capital preference for risk assets over duration. Overall, the composite suggests a positive but not uniform profile: technical and macro-risk indicators are aligned, while cross-asset allocation pressures temper the signal. We are currently overweight at the shorter end of the curve.
Commentary: U.S. Treasury yields drifted lower in October, with the 10-year note hovering around 4.11% by month-end, down from ~4.16% at the start of the month. Strong foreign demand also supported the market: October’s Treasury International Capital (TIC) data showed net foreign acquisitions of long‐term U.S. securities of approximately $203.6 billion. From a monetary perspective, the Federal Reserve tweaked its operational tools, lowering the rate paid on reserve balances to 3.90% effective Oct 30 and reinforcing a target federal funds range of 3.75%–4.00%. Exchange-rate movements were modest, but a firmer U.S. dollar raised hedged foreign cost of ownership and reinforced the safe-haven appeal of Treasuries for unhedged global buyers. On the policy front, lingering concerns about the ongoing government shutdown and credit governance (including a downgrade of U.S. sovereign rating by Scope Ratings on Oct 24) added premium to longer duration paper. Overall, the Treasury market in October reflected a convergence of strong global flows, policy calibration, and macro caution—supporting duration despite incremental headwinds from fiscal and currency dynamics.
Figure 1: CDS rates are potentially reversing, indicating that fear of a major market disruption is fading.
U.S. TIPS: U.S. TIPS indicators are mixed, with supportive readings from technical RSI, commodity-linked relative strength, moving-average relationships, and favorable positioning versus high-yield spreads. These indicate stable demand and a positive relative-value profile. Offsetting this, momentum-based mean-reversion and lower inflation expectations are headwinds, suggesting limited confirmation from trend-based signals and softer inflation-linked catalysts. Overall, the composite leans positive but is constrained by mixed momentum and muted inflation-expectation support.
Commentary: In October, inflation-linked Treasuries (TIPS) faced a challenging backdrop as confidence in the inflation outlook and real-yield trajectory became multifaceted. Inflation nowcasts for October showed monthly CPI growth near 0.18% and core CPI 0.25%, implying year-on-year rates around 2.9%–3.2%. The ongoing U.S. government shutdown further clouded inflation data collection and release timing, reducing transparency for inflation-sensitive assets. From a currency angle, a firmer U.S. dollar elevated hedged entry costs for foreign TIPS buyers, limiting some international demand. Meanwhile the Federal Reserve maintained a cautiously accommodative stance, leaving real yields in TIPS elevated. On net, TIPS returns in October were primarily driven by carry and the inflation adjustment in the principal, rather than by sharp portfolio re-rating. The interaction of subdued inflation surprises, limited visibility, stronger real yields, and currency drag meant that TIPS out-performance was muted compared to nominal Treasuries. For inflation-linked exposure, the environment is not highly favorable in the near term—supportive carry remains, but upside is constrained by uncertainty and real-rate stability.
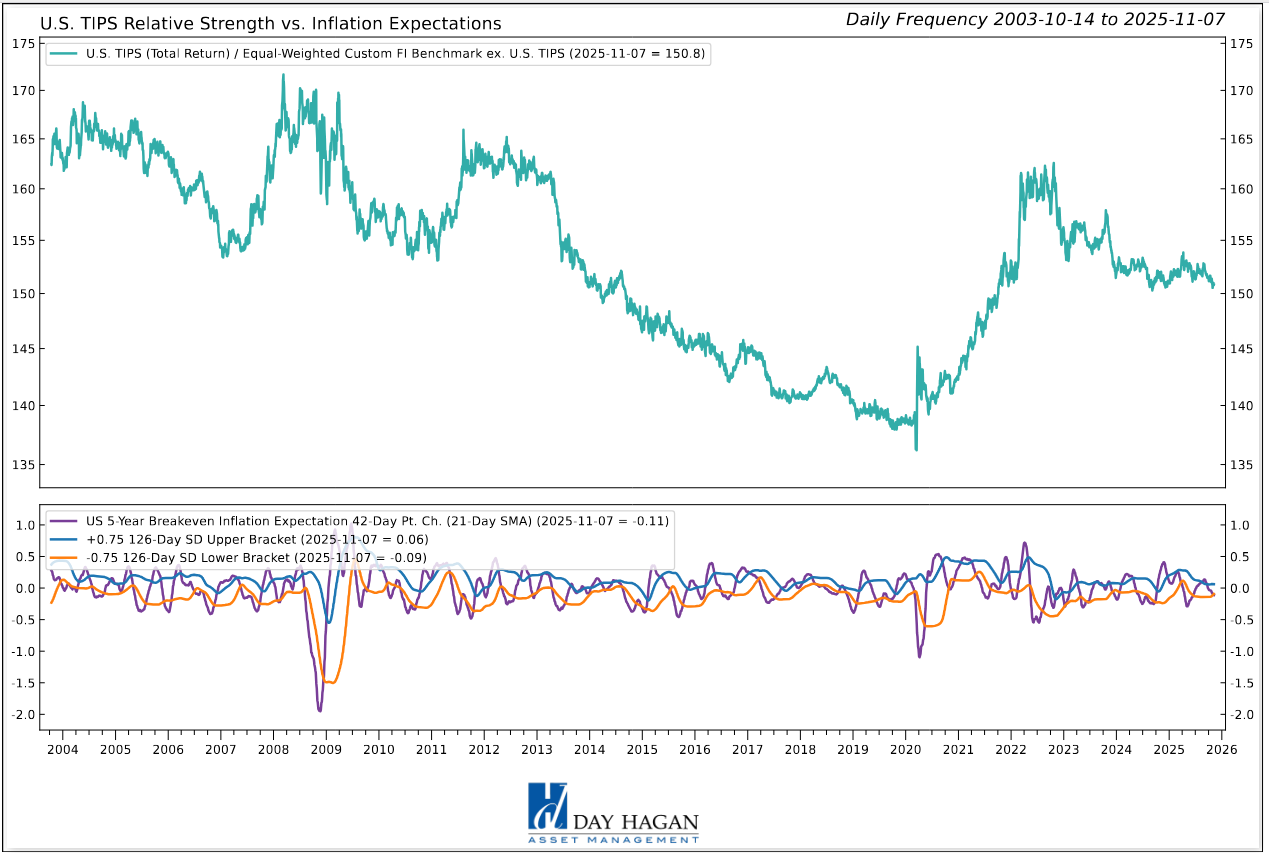
Figure 2: Inflation expectations are rolling over longer term. Negative for TIPS.
U.S. Mortgage-Backed Securities: U.S. MBS signals are broadly constructive. Relative strength versus moving-average trends, RSI, and the 10-year Treasury indicate supportive technical positioning, while a favorable slope profile and improvement versus high-yield spreads reinforce quality demand. The only offset comes from weaker alignment with inflation expectations, suggesting limited macro-inflation confirmation. Overall, the composite is decisively positive, led by technical and cross-credit strength, with minimal macro drag. Given the mix of indicator readings, we remain neutral.
Commentary: Agency mortgage-backed securities delivered modestly positive returns in October, underpinned by strong technical flows and shifting central-bank operations. Money-manager inflows, mortgage-REIT equity raises and collateralized mortgage-obligation creation all supported the sector, while reduced interest-rate volatility lowered hedging costs for investors. Meanwhile, the Federal Reserve announced on October 29 that it would conclude its quantitative-tightening program by December 1 and reinvest principal payments from its MBS holdings into Treasuries. The reinvestment decision lessens the rate of MBS-balance-sheet shrinkage, helping improve relative value for MBS. On the other hand, a weaker Treasury auction early in the month caused mortgage spreads to lag Treasuries and for 30-year fixed mortgage rates to tick up slightly. Currency movements were less material for MBS given their U.S.-domestic nature, though the strong U.S. dollar added some cost for foreign leverage strategies. Overall, the sector benefited from technical tailwinds and structural support from the Fed’s reinvestment shift, but upside remains constrained by issuance volumes and spread sensitivity.
Figure 3: Lower rates are good for MBS.
U.S. Floating Rate Notes: The U.S. floating-rate notes composite leans negative, with support from relative strength versus OIS levels and a stable slope profile. Headwinds are indicated by technical cross signals, momentum conditions, and positioning versus volatility extremes. These point to limited trend confirmation and risk-demand softness. Overall, the composite is mixed-to-negative, with rate structure offering support while technicals and volatility alignment remain unfavorable.
Commentary: In October, U.S. FRNs stood out for low duration risk and steady accrual, with the Treasury recently issuing new FRNs at a yield of ~3.90% as of Oct 31. From a monetary policy lens, funds tied to short-term floating structures reflected the Fed’s steady short-term rate environment and muted rate-cut bets, limiting upside from coupon resets. Currency dynamics played a role: a stronger U.S. dollar increased hedged cost for foreign FRN buyers, narrowing incremental demand outside domestic investors. Credit markets remained calm, but FRNs did not benefit from spread tightening like fixed-rate IG credit, thereby limiting excess returns. Technical flows were modest, as investors weighed yield-carry benefits against minimal price upside in a stable short-rate backdrop. Meanwhile, alternative short-duration options—such as bills or ultra-short corporates—competed for the same yield segment. Overall, FRNs delivered dependable income and offered protection from duration shocks, but in October their performance was defined by stable carry over re-rating. For portfolio positioning, they remain a defensive component, suited for income-focused allocation rather than opportunistic return chasing.
Figure 4: Relative momentum for Floating Rate Notes is negative.
U.S. IG Corporates: U.S. investment-grade indicators are also mixed. Support comes from relative strength versus credit spreads, including both OAS and CDS, alongside favorable positioning against the U.S. dollar. These point to stable credit conditions and modest cross-asset demand. Offsetting this, indicators versus implied rate volatility, technical cross measures, and price mean reversion are weak, reflecting lack of trend confirmation. Overall, the profile is balanced, with credit-side resilience tempered by weak technical structure and volatility pressure.
Commentary: U.S. investment grade corporate bonds continued to benefit from persistently strong technical conditions in October. Spreads reached approximately 74 bps, among the lowest in over 15 years, reflecting high investor conviction in the credit quality of major issuers. Issuance remained robust as companies locked in favorable financing while global investors hunted yield in a low-rate world. Strong corporate fundamentals—including improving earnings, stable leverage ratios and regulatory relief—provided further backing for the sector. On the monetary front, expectations of Fed cuts supported carry trades into credit, but the compressing spread backdrop raised questions about remaining upside. For portfolio positioning, the credit sector remains attractive for income-seeking investors; however, valuations warrant caution in the face of potential risk reversals.
Figure 5: Lower CDS rates are constructive for U.S. Corporate Bonds.
U.S. High Yield: U.S. high yield indicators are uniformly negative. Technical trend measures, bond-market breadth, and alignment with small-cap equity performance all weaken the profile. Additional pressure comes from unfavorable readings versus relative total-return trends, volatility dynamics, and spread-reversal behavior, indicating diminished risk appetite and unreliable carry compensation. Overall, the composite points to broad deterioration with no material offsetting strength.
Commentary: In October, U.S. high yield bonds produced modest positive returns—though the sector saw a 14 basis-point widening in spreads amid growing credit concerns, according to NewFleet. The underlying yield pickup remained a key driver, with income carry offsetting spread modestly moving wider. From an economic standpoint, resilient corporate earnings and low default rates supported credit quality, yet early signals of global growth uncertainty kept investors cautious. Monetary policy dynamics added nuance: while rate cuts by the Federal Reserve encouraged risk asset allocation, commentary suggesting no guarantee of further cuts this year dampened sentiment, reducing the risk-premium cushion for high yield. Regional central banks easing abroad shifted global yield attention back toward U.S. credit, helping flows into high yield. Technical supply was manageable, yet new issuance remained cautious given tight valuations and limited upside from spreads at current levels. For portfolio positioning, high yield continues to offer income and selective opportunities, but tight valuation and rising uncertainty suggest a reduced margin for error.
Figure 6: High-Yield bond breadth continued to deteriorate in October. A move below the lower bracket and a reversal back above would generate a buy signal for this indicator.
International IG Bonds: Positive indicators include equity-volatility proxies, option-adjusted spreads, and credit-default swaps, indicating stable cross-asset demand and constructive credit conditions. Offsetting this, relative-strength slope and moving-average measures are negative, reflecting weak trend persistence and limited technical confirmation. Overall, the composite leans modestly positive, supported by credit and risk-volatility relationships, while technical structure remains a constraint.
Commentary: October offered a mixed environment for international investment-grade bonds. Developed-market IG spreads remained narrow as issuance remained elevated and global investors hunted yield. According to a monthly review, the Bloomberg Global Aggregate Bond Index fell ~0.3%, reflecting spread pressure in IG and securitized segments. On the monetary front, the European Central Bank kept policy rates near 2% and emphasized gradual easing, while the Bank of England and other peers faced sticky inflation. Currency movements played a meaningful role: a firmer U.S. dollar increased hedging costs for non-U.S. bonds, reducing unhedged yield appeal in euros and sterling. Trade-policy developments, particularly easing U.S.–China rhetoric, improved sentiment toward global credit markets. Technicals were supportive—high demand for IG issuance and low hedging costs—while valuations appeared stretched, with analysts noting that corporate spreads in Europe now trade at under 1%. Overall, international IG bonds offered income and diversified credit exposure, but limited spread cushion amid tight valuations and currency drag warrant cautious positioning for the medium term.
Figure 7: Technicals are still negative for Global IG Corporate Bonds.
Emerging Market Bonds: Emerging-market USD debt indicators show broad support. Positive signals include strength versus EM equity momentum, favorable alignment with commodity trends, constructive absolute trend behavior, and an improving relative-strength slope. These suggest pro-cyclical participation and stable trend structure. The lone negative comes from weak positioning versus EM currencies versus the U.S. dollar, indicating currency-related headwinds. Overall, the composite leans positive, with macro-cyclical and technical conditions outweighing FX drag. We remain modestly overweight.
Commentary: Emerging market (EM) bonds posted solid returns in October on the back of favorable macro and technical dynamics. Yield-seeking flows returned as many EM economies exhibited resilient fundamentals, fiscal discipline and improving external balances, supporting credit spreads. The International Monetary Fund highlighted persistent financial-stability risks in EM bond and FX markets – including currency mismatches and non-bank financial-institution exposures – underscoring caution amid the optimism. Structurally, support from increased unilateral issuance, particularly local-currency debt absorbed domestically, helped buffer against external shocks. While global central-bank easing extended liquidity tailwinds into EM credit, valuations appeared tight and investor selectivity rose, particularly after elevated issuance and regional risks. For portfolios, EM bonds continued to offer diversified yield exposure; however, limited spread cushion, currency and structural vulnerabilities suggest maintaining a selective and risk-aware approach.
Figure 8: Emerging Market equity momentum has supported EM bond prices. A decline below the 0 line would lead us to reduce exposure. Getting closer.
Catastrophic Stop Model
The Catastrophic Stop model combines time-tested, objective indicators designed to identify high-risk periods for equities and assets with high correlations to the equity market. The model entered November recommending a fully invested allocation relative to the benchmark for credit sectors with high correlations to equities.
Several factors continue to underpin a constructive equity and overall fixed income outlook. Q3 earnings have broadly exceeded expectations, pushing S&P 500 growth to ~10.7% y/y, with guidance holding up. Notably, earnings expectations for the “493” are poised to narrow the gap with the “7” over the coming quarters. Mega-cap tech remains a powerful tailwind, signaling sustained AI-driven capex through 2026 and supporting demand across semiconductors, cloud, and networking. Inflation has eased only gradually (Sept CPI +0.3% m/m, +3.0% y/y), yet markets increasingly view the Fed as less restrictive as balance-sheet runoff slows—even as Powell downplayed near-term cuts. We still see December as in play.
Resilient earnings, sustained AI investment, a less-restrictive policy backdrop, and renewed buybacks should outweigh near-term headwinds. Positioning and flows remain supportive, but a cluster of upcoming data releases could introduce episodic volatility.
The weight of the evidence suggests that any equity weakness is unlikely to extend into a significant downtrend at this time. Of course, if our model triggers a sell signal (below 40% for two consecutive days), indicating more substantial problems, we will raise cash immediately.
Figure 9: The Catastrophic Stop model recommends fully invested equity and fixed income positions (relative to benchmarks). Because the model uses indices to extend its history, it is considered hypothetical.
The Day Hagan Daily Market Sentiment Composite (part of the Catastrophic Stop Model) remains in the “Excessive Pessimism” zone, reflecting a notable rise in investor caution. Historically, such rapid buildups in pessimism have often preceded rebounds, suggesting a greater likelihood of a year-end rally.
As of the end of October, U.S. equity sentiment remained cautious despite new market highs. The weekly American Association of Individual Investors (AAII) Bull-Bear spread stood around 7.17, up from -5.80% the previous week, indicating more bulls than bears, but not yet extended. Fund flows showed only $1.81 billion into U.S. equities for the week ending Oct 29, pulling back sharply from ~$9.65 billion the prior week, but understandable as investors awaited the FOMC decision and presser.
Meanwhile, we’re keeping an eye on technical breadth (e.g., the percentage of S&P 500 stocks above their 50— and 200-day averages), as both measures declined into last Friday, now at 22% and 33%, respectively. (Last Monday was odd, with the worst day of market breadth ever; the market closed at an all-time high, but 80% of the stocks declined. Some divergences reversed later in the week, but this is worth remembering.)
Figure 10: Investor sentiment is being reset, as illustrated by the DH Daily Market Sentiment Composite declining below 70. A decline below 30 and a reversal back above would be a nice setup for a year-end rally.
Our goal is to stay on the right side of the prevailing trend, introducing risk management when conditions deteriorate. Currently, the uptrend remains intact. The broader-based composite models calling U.S. economic growth, international economic growth, inflation trends, liquidity, and equity demand remain constructive. The Catastrophic Stop model is positive, and we are aligned with the message. If our models shift to bearish levels, we will raise cash.
This strategy utilizes measures of price, valuation, economic trends, monetary liquidity, and market sentiment to make objective, rational, and unemotional decisions about how much capital to place at risk and where to allocate that capital.
For more information, please contact us at:
Day Hagan Asset Management
1000 S. Tamiami Trl
Sarasota, FL 34236
Toll Free: (800) 594-7930
Office Phone: (941) 330-1702
Website: https://dayhagan.com or https://dhfunds.com
© 2025 Day Hagan Asset Management
This material is for educational purposes only. Further distribution is prohibited without prior permission. Please see the information on Disclosures and Fact Sheets here: https://dhfunds.com/literature. Charts with models and return information use indices for performance testing to extend the model histories, and they should be considered hypothetical. All Rights Reserved. (© Copyright 2025 Day Hagan Asset Management.)
Day Hagan Smart Sector® Fixed Income ETF
Symbol: SSFI
Disclosures
The data and analysis contained within are provided “as is” and without warranty of any kind, either express or implied. The information is based on data believed to be reliable, but it is not guaranteed. Day Hagan DISCLAIMS ANY AND ALL EXPRESS OR IMPLIED WARRANTIES, INCLUDING, BUT NOT LIMITED TO, ANY WARRANTIES OF MERCHANTABILITY, SUITABILITY, OR FITNESS FOR A PARTICULAR PURPOSE OR USE. All performance measures do not reflect tax consequences, execution, commissions, and other trading costs, and as such, investors should consult their tax advisors before making investment decisions, as well as realize that the past performance and results of the model are not a guarantee of future results. The Smart Sector® Strategy is not intended to be the primary basis for investment decisions, and the usage of the model does not address the suitability of any particular investment for any particular investor.
Using any graph, chart, formula, model, or other device to assist in deciding which securities to trade or when to trade them presents many difficulties, and their effectiveness has significant limitations, including that prior patterns may not repeat themselves continuously or on any particular occasion. In addition, market participants using such devices can impact the market in a way that changes the effectiveness of such devices. Day Hagan believes no individual graph, chart, formula, model, or other device should be used as the sole basis for any investment decision and suggests that all market participants consider differing viewpoints and use a weight-of-the-evidence approach that fits their investment needs.
Past performance does not guarantee future results. No current or prospective client should assume future performance of any specific investment or strategy will be profitable or equal to past performance levels. All investment strategies have the potential for profit or loss. Changes in investment strategies, contributions or withdrawals, and economic conditions may materially alter the performance of your portfolio. Different types of investments involve varying degrees of risk, and there can be no assurance that any specific investment or strategy will be suitable or profitable for a client’s portfolio. Historical performance results for investment indexes and/or categories generally do not reflect the deduction of transaction and/or custodial charges or the deduction of an investment management fee, the incurrence of which would have the effect of decreasing historical performance results. There can be no assurances that a portfolio will match or outperform any particular benchmark.
The information contained herein is provided for informational purposes only and should not be construed as investment advice or a recommendation to buy or sell any security. The securities, instruments, or strategies described may not be suitable for all investors, and their value and income may fluctuate. Past performance is not indicative of future results, and there is no guarantee that any investment strategy will achieve its objectives, generate profits, or avoid losses.
This material is intended to provide general market commentary and should not be relied upon as individualized investment advice. Investors should consult with their financial professional before making any investment decisions based on this information.
Data and analysis are provided “as is” without warranty of any kind, either express or implied. Day Hagan Asset Management, its affiliates, employees, or third-party data providers shall not be liable for any loss sustained by any person relying on this information. All opinions and views expressed are subject to change without notice and may differ from those of other investment professionals within Day Hagan Asset Management or Ashton Thomas Private Wealth, LLC.
Accounts managed by Day Hagan Asset Management or its affiliates may hold positions in the securities discussed and may trade such securities without notice.
Day Hagan Asset Management is a division of and doing business as (DBA) Ashton Thomas Private Wealth, LLC, an SEC-registered investment adviser. Registration with the SEC does not imply a certain level of skill or training.
There is no guarantee that any investment strategy will achieve its objectives, generate dividends, or avoid losses.
This material is for educational purposes only. Further distribution is prohibited without prior permission. Please see the information on Disclosures and Fact Sheets here: https://dhfunds.com/literature. Charts with models and return information use indices for performance testing to extend the model histories, and they should be considered hypothetical. All Rights Reserved.
© 2025 Day Hagan Asset Management
