
Day Hagan Smart Sector® with Catastrophic Stop Strategy Update November 2025
A downloadable PDF copy of the Article:
Day Hagan Smart Sector® with Catastrophic Stop Strategy Update November 2025 (pdf)
Executive Summary
November was a telling month. For the bullish camp: the Federal Reserve cut rates in late October and reaffirmed its easing intentions, which helped risk assets; corporate earnings remained resilient across many sectors; and, despite uncertainty, the economy still showed durability. For the bearish or cautious side, key headwinds persisted and in some cases deepened. Sentiment surveys hit a 17-month low in early November, underlining growing concerns about jobs, inflation, and economic policy. The ongoing U.S. federal government shutdown has created a blackout on key data—October’s employment report might not be published—raising questions about transparency and risk premia. Inflation likewise stayed sticky: consumer expectations for one-year-ahead inflation ticked lower to 3.2%, but remained elevated, and price pressures in services and shelter continued.
The global backdrop also weighed in: elevated oil and commodity price volatility, supply-chain stress, and trade/tariff frictions continued to flicker, particularly undermining export-sensitive and industrial sectors. At the index level, breadth and technical momentum held up reasonably well throughout most of the month, but rotation pressures and macro uncertainty crept in as sentiment cooled and upward surprise risk diminished.
Sector Dynamics & Drivers:
The Technology and Communication Services sectors again benefited from secular tailwinds, but October positioning skewed more selectively. AI-driven infrastructure spending and healthy cloud budgets continued to anchor sentiment, while October Fed easing supported duration assets. Earnings strength remained concentrated in mega-caps, though dispersion increased, reinforcing a focus on quality. Valuation premia stayed elevated, but strong 2026 earnings expectations helped offset multiple risks. Communications Services continued to see mixed ad-spend tone, but search and AI workloads remained bright spots.
Consumer Discretionary was more mixed, with holiday demand visibility improving but remaining uneven across categories. October saw persistent margin pressure from wage and freight costs; inventory discipline and promotional cadence were central. Earnings expectations moderated from summer levels, and valuations remained rich; high turnover metrics indicate the sector still benefits from platform scale. Amazon and select services remained relatively bright spots, but housing and auto-linked names stayed rate-sensitive.
Consumer Staples remained a defensive counterweight, aided by steady demand and strong Q3 beat rates. Despite improved relative stability in October, the group continued to lag more cyclical areas as investors favored growth. Pricing power is fading and elasticity is normalizing, which could pressure 2025 earnings. Valuations were near the market on P/E and below on P/S. FX and private-label share gains were notable watch points heading into year-end.
Healthcare stabilized further into November as defensive characteristics remained attractive and Q3 beat rates were among the strongest. Still, therapeutic pricing and regulatory dynamics remained swing factors. Current expectations are for mid-teens EPS growth in 2025 and a re-acceleration into 2026. Med-tech procedure normalization and selective M&A support sentiment. Tools and services maintained healthy activity.
Financials were supported by the prospect of a steeper curve and potential incremental credit demand following the Fed’s October cut. Large banks’ Q3 beats were solid, although November positioning remained tempered by pockets of consumer credit stress. Valuation screens inexpensive vs. the market. Key watchpoints include deposit cost normalization, card credit normalization, and CRE reserves.
Industrials and Materials remained bifurcated. Industrials benefited from improving order backlogs and potential broadening capex beyond semis, though transports remained mixed. Backlog durability, defense spending, and easing supply chains supported the outlook. Due to sluggish China demand and mixed fundamentals for chemicals, 2025 earnings are expected to be soft before improving in 2026. Commodity-linked exposures carried greater dispersion.
Energy was range-bound as supply discipline and geopolitical risk were countered by softer demand concerns. 2025 EPS looks negative y/y before improving in 2026, and valuation remains below market. Free cash flow (FCF) resiliency and low leverage rank well, but are under pressure. October’s performance was sensitive to OPEC+ updates and narrowing product crack spreads.
Utilities firmed as falling rate expectations boosted interest-sensitive assets. Relative valuations and the ever-increasing need for energy are secular positives. Rate-case cadence and funding costs remain key. Lower sector beta provided ballast into the year-end.
Real Estate/REITs found relief from the Fed cut, helping moderate discount-rate pressure. Divergences widened: datacenter and logistics assets benefited from structural demand and AI buildouts; office remained challenged. Refinancing windows and cap-rate stabilization remain key watchpoints.
In sum, October was shaped by a late-cycle easing environment, supportive long-duration sentiment, widening intra-sector dispersion, and selective risk-taking favoring secular growth (Tech/Comm) and structural load themes (Utilities, selective REITs). Cyclicals and commodity-exposed segments (Industrials, Materials, Energy) remained more dependent on incremental global growth signals, while defensives (Healthcare, Staples) retained portfolio ballast roles amid moderating inflation and still-uneven consumer strength.
Holdings
Sector
Consumer Discretionary
Consumer Staples
Communication Services
Energy
Financials
Health Care
Industrials
Information Technology
Materials
Real Estate
Utilities
Outlook (relative to benchmark weighting)
Neutral
Overweight
Overweight
Underweight
Neutral
Neutral
Underweight
Overweight
Underweight
Neutral
Underweight
Sector Review
Consumer Discretionary: The S&P 500 Consumer Discretionary sector shows several short- and intermediate-term moving-average crossovers that suggest strengthening relative momentum, while favorable price deviation from trend measures indicate improving participation. In addition, housing starts data align with stronger relative performance, implying supportive underlying economic activity and demand outlook. Together, these factors point to continued sector resilience and potential upside. However, multiple bearish conditions introduce notable caution. Relative price momentum is weakening, and overbought/oversold readings imply stretched positioning. Net new highs remain soft, reducing confirmation of broad strength. Valuation headwinds are also present, with the sector showing unfavorable relative forward P/E trends. Rising total consumer credit outstanding and securitized balances could constrain spending power, while the long-term Treasury yield relationship appears unfavorable, potentially pressuring interest-sensitive consumer demand. Finally, though discretionary consumer-spending signals are neutral, these collective bearish drivers counterbalance the sector’s strengths and suggest a more mixed, risk-aware outlook overall. We remain neutral.
Commentary: October favored the sector thanks to mega-cap strength—Amazon rallied on a broad Q3 beat—yet flagging housing affordability and a cooling consumer are watch-items. Into November: the Fed’s late-October cut may help autos/housing sensitivity at the margin, but real disposable income trends and credit normalizing remain pivotal. Earnings setup is mixed: CFRA shows 2025 EPS growth in low single digits before re-accelerating in 2026, implying stock selection matters more than beta. Valuation is rich relative to the market (29x 2025E P/E; P/B ~7.3x), so upside requires clean holiday execution and inventory discipline. Footwear/apparel promo intensity and used-auto price basing are micro drivers. Near-term, watch commentary on fulfillment costs and media spending tied to peak season.
Figure 1: Consumer Discretionary showing signs of a short-term reversal from oversold conditions.
Consumer Staples: On the bullish side, Consumer Staples' relative strength is benefiting near-term from improving price momentum, hinting at renewed leadership versus the broader market. Supportive macro backdrops also help looser financial conditions per the Chicago Fed index, and upbeat global growth surprises create a friendlier risk climate. Fundamentals add a tailwind as food sales growth remains positive, while a favorable relative short-interest ratio suggests reduced squeeze risk and room for incremental buying if sentiment improves. Conversely, several technical and fundamental headwinds temper the outlook. A bearish moving-average cross, negative deviation from trend, weak relative net new highs, and deteriorating 45-day breadth denote fragile participation and fading confirmation. Pricing dynamics are also challenging: elevated food CPI inflation can compress real demand and pressure margins, while unattractive sector sales yields diminish valuation appeal. Taken together, positives exist, yet the prevailing evidence skews toward the defensive overall.
Commentary: Staples’ relative strength line sits near record lows versus the S&P 500, a function of investors preferring growth and cyclicals, plus fading pricing tailwinds. Yet a defensive bid can re-emerge on macro downside or if yields fall further after the Fed cut. Q3 beat rates were among the highest across sectors, aided by the revenue mix and disciplined SG&A, but 2025 growth expectations are moderate (low single-digit EPS) as elasticities normalize. Valuation screens reasonable vs. history and the market: ~19x 2025E P/E and ~1.3x P/S, with sturdy ROE and lower beta—useful if volatility returns. Potential November drivers include FX for multinationals, private-label share creep, and promotional opportunities leading into the holidays. Staples’ operating leverage is small but steady; asset turnover leads most sectors, reflecting fast inventory cycles.
Figure 2: Relative price momentum is poised for a reversal. If this occurs, it would argue for more defensive exposure.
Communication Services: Communication Services are supported by multiple bullish underpinnings. A positive relative price moving-average cross signals improving trend persistence, while a favorable deviation from the trend indicates that the strength is broadening rather than narrowing. Macro context helps too: a supportive 10-year minus 2-year Treasury spread relationship aligns with risk-appetite stabilization, and an attractive relative earnings yield bolsters valuation, suggesting the sector’s cash flow power is competitive with alternatives. Together, these positives argue for sustained leadership potential. On the other hand, dual overbought/oversold signals warn that relative strength may be extended and vulnerable to mean reversion, particularly after sharp rallies. Such conditions can catalyze profit-taking and amplify drawdowns if macro data disappoints or rates reprice. With tactical gauges flashing overbought even as trends improve, the risk-reward skews toward choppier performance near term, making staggered entries, tighter risk controls, ongoing discipline, and vigilance on momentum confirmation prudent. We remain modestly overweight.
Commentary: Alphabet’s strong Q3 lifted the group while misses at Meta and Netflix weighed on cap-weighted results; performance dispersion within the “Mag 7” widened as intra-group correlations fell toward multi-year lows. In October, the sector modestly trailed the S&P 500. Key near-term swing factors: ad budgets into the holiday quarter, streamer profitability, and telecom pricing discipline. A late-October Fed cut should ease discount-rate headwinds for longer-duration ad/streaming cash flows if labor data doesn’t re-accelerate. Street expects above-market 2026 EPS growth, but mega-cap growth is decelerating from peak levels. On valuation, 2025E multiples look mid-pack (P/E ~18–19x; P/S ~2.1x), below Tech but dearer than Energy/Financials, and ROE sits in the mid-teens. Recent earnings skew: Alphabet beat; select media/streaming were mixed. Keep in mind that the top ten names are ~65% of the index, keeping concentration risk elevated.
Figure 3: The Communication Services sector has now worked off some of the froth we noted in last month’s letter.
Energy: The Energy sector shows several constructive elements. Relative price conditions appear supportive, with overbought/oversold dynamics favoring continued resilience. Rolling five-month volatility trends are also encouraging, implying steadier performance and reduced shock risk. In addition, improving alignment between sector strength and global rig activity suggests healthier upstream fundamentals, reinforcing the sector’s capacity to respond to supply conditions. These factors point to potential near-term stabilization and selective upside opportunities. Conversely, multiple conditions lean bearish. Core relative-strength indicators remain weak, with both the primary gauge and moving-average signals pointing to underperformance. Sector breadth over 150 days is soft, highlighting narrow leadership. Free cash-flow yield momentum is fading, reducing fundamental support. Meanwhile, relative strength versus crude oil days of supply and spot prices is unfavorable, raising concerns that pricing dynamics are not translating into competitive performance. Neutral crude-trend and currency signals add little conviction. Overall, despite pockets of support, the bearish backdrop currently dominates. We are slightly underweight.
Commentary: Crude finished October with macro crosscurrents: a soft-landing narrative and Fed easing support demand expectations, but ample inventories and disciplined U.S. supply cap near-term price upside. EPS growth through 2025 is negative y/y on tough comps, then turns positive in 2026 as base effects ease. CFRA consensus shows Energy lagging in 2025 earnings before re-accelerating. Valuation is still below market (2025E P/E ~16–17x; P/S ~1.3x; low debt-to-equity), cushioning downside if oil stays range-bound. Potential November drivers include OPEC+ reversing production increases, improving crack spreads, and winter natural gas dynamics. The sector carries the lowest debt-to-equity in the AltaVista grid (0.5x) and benefits from buybacks tied to disciplined capex. Recent prints highlighted free-cash-flow resilience at mid-cycle prices; watch commentary on LNG ramp and refining maintenance schedules into year-end.
Figure 4: Profitability (cash flow trends) is still an issue for the Energy sector.
Financials: Financials display a few constructive signals. Relative strength is supported by improving bank loan growth, suggesting healthier credit demand and potential revenue expansion. Forward earnings yield is comparatively attractive, suggesting valuations remain appealing and may draw incremental interest. In addition, a favorable yield curve provides a cyclical tailwind, as steeper curves can improve net interest margins and boost profitability. However, the sector is challenged by an unusually broad set of bearish indicators. Relative strength continues to weaken across trend, momentum, total return, and overbought/oversold measures, signaling persistent underperformance. Elevated sector volatility and pronounced maximum drawdowns highlight vulnerability to shocks. A negative backdrop from global economic surprises and unfavorable currency dynamics compound external pressures. Credit spreads within financial institutions remain unsupportive, reflecting increased perceived risk. Meanwhile, business credit conditions are neutral, offering little offset. Collectively, these headwinds outweigh strengths, keeping the sector’s outlook cautious despite selective bright spots.
Commentary: Despite one of the best bank beat rates since 2021, Financials underperformed in October on idiosyncratic credit headlines (auto-linked bankruptcies; a regional lender’s charge-offs), reminding investors that micro matters as much as macro. Looking to November, the Fed’s cut and a tentative re-steepening can support NIM stabilization into 2026 if deposit costs crest; loan growth historically lags capex by ~two quarters, so broadening capex beyond Tech would help. Valuation is attractive vs. the market (2025E P/E ~17x; P/B ~2.1x), and CFRA expects high-single-digit EPS growth in 2025. We are monitoring CRE reserve builds and card delinquencies, and we are watching capital returns for signs of deceleration. Recent earnings were broadly solid, but guidance remains cautious.
Figure 5: Keeping an eye on credit spreads in the Financials sector. Up slightly, but so far, the increase isn’t indicating a major problem in the financial market structure.
Healthcare: Health Care is showing broader participation, with an improving 100-day relative breadth indicating stronger underlying engagement across the group. The sector’s own trend backdrop is also favorable, suggesting internal leadership dynamics remain intact despite cross-currents. Additionally, relative strength appears to benefit from the trajectory of medical inflation, implying pricing power may help defend margins and revenue growth. Together, these tailwinds point to a foundation that could help stabilize performance. Negative indicators include relative price trend and momentum measures, which remain weak, and momentum reversals further underscore the sector’s struggle to sustain leadership. Maximum drawdown signals remain elevated, highlighting vulnerability to downside shocks. Health-care personal-expenditure dynamics appear unsupportive, limiting potential demand growth, while sector book-yield relationships suggest valuation appeal is lagging. With new-construction indicators neutral and unable to offset these pressures, the balance of evidence leans cautious, even as some breadth and pricing factors offer selective support. We remain neutral.
Commentary: Health Care’s estimates have been drifting lower and still sit below the vaccine-era peak, but valuations are near four-year lows on P/E. Q3 evidenced strong earnings beat rates. In October, the group modestly lagged, though defensive attributes plus innovation optionality (GLP-1; oncology; tools) are supportive into year-end. 2025 EPS growth is mid-teens per CFRA, re-accelerating into 2026; AltaVista shows ~18–19x 2025E P/E and ~1.5x P/S—close to market with better balance-sheet leverage (0.8x debt-to-equity). November watch-items: drug-pricing headlines and Medicare updates, GLP-1 supply/label expansion, and M&A in tools/services. Interesting: the top ten names comprise ~57% of the sector—less concentrated than Tech or Comm Services—diversifying policy risk across biopharma, equipment, and payors. Recent earnings skewed positive in large-cap biopharma and med-tech procedure volumes. If rates grind lower post-Fed, long-duration innovators could regain a relative bid.
Figure 6: Health Care shows signs of relative strength improvement.
Industrials: Several constructive signals: The relative price trend shows short-term outperformance, supported by favorable RSI readings that signal an improving technical tone. A stronger cash-flow yield reinforces the fundamental appeal, suggesting healthy earnings support, while strength relative to broad commodity benchmarks indicates resilience amid shifting input costs. Positive alignment with the trade-weighted U.S. dollar and improving industrial production adds a cyclical tailwind, implying demand remains durable and potentially supportive of continued relative leadership. Nonetheless, multiple momentum measures are weak, signaling difficulty sustaining outperformance, and elevated sector volatility adds fragility to the trend. An increase in the number of 210-day new lows highlights uneven participation, while a weaker relationship to sector sales yield raises valuation concerns. Underperformance relative to oil also suggests sensitivity to energy-linked cost dynamics, and neutral consumer-confidence measures provide little incremental support. Together, these bearish factors temper the otherwise constructive backdrop, pointing to an environment where improving fundamentals and technicals coexist with uneven participation and macro sensitivities. We remain underweight.
Commentary: Industrial earnings breadth improved in Q3, with beats in several capital goods names and firm backlogs, while transports stayed mixed. The October Fed cut should support interest-sensitive pockets (aero/defense financing, commercial equipment), and a broader capex cycle beyond semis would filter into 2026 revenue. CFRA shows low-to-mid-teens EPS growth for 2025; AltaVista’s 2025E P/E (~27–28x) is above market, implying execution needs to stay strong. November drivers: ISM new orders, inventories/destocking progress, and defense budget visibility. We note that Industrials’ asset turnover and leverage are average, but operating leverage is high. Recent calls highlighted resilient aftermarket/service revenues and easing supply chains. If the curve steepens and the dollar softens, global cyclicals in the sector could benefit from a tailwind.
Figure 7: The number of new lows within the Industrials sector is increasing, indicating technical weakness.
Information Technology: Relative price momentum is firm, suggesting continued leadership, while one of the overbought/oversold measures still leans favorable, indicating upside pressure remains intact. A positive sales yield enhances fundamental appeal, pointing to solid revenue efficiency, and positive sensitivity to market-based inflation expectations suggests that tech leadership is persisting even as macro signals are potentially decelerating. Improving earnings-revision breadth further reinforces sentiment, reflecting growing confidence in forward estimates and helping sustain a constructive backdrop. However, there are a few cautionary elements we are watching. One of our intermediate-term overbought/oversold gauge indicates stretched conditions that may leave the group vulnerable to near-term consolidation, particularly following extended rallies. Additionally, a less supportive relative short-interest ratio hints at positioning that could reduce incremental buying fuel or amplify volatility if sentiment shifts. While these bearish factors merit attention, the broader balance remains favorable, with strong momentum, robust fundamentals, and improving earnings expectations anchoring the sector’s outlook. We are slightly overweight.
Commentary: Tech led October as AI capex and semis strength overshadowed some Mega cap post-earnings volatility. The Fed cut reduces discount-rate pressure on long-duration cash flows, and cloud/AI order books remain robust into 2026. CFRA shows Tech with the fastest 2025 EPS growth among major sectors (~22% y/y) and the highest EPS level; valuation reflects that: ~35–36x 2025E P/E, ~8.2x P/S, and best-in-class ROE. Potential November drivers include hyperscaler capex growth, GPU supply, and PC/server refresh follow-through. AltaVista’s shows rapid book-value compounding and high reinvestment rates. We do note that concentration is elevated, so dispersion risk remains if one or two mega-caps disappoint. Recent prints show broad beats across semis, mixed software reaction as net retention moderates. With policy easing underway, multiple risks are lower, but expectations are still high—guidance quality will dictate year-end positioning.
Figure 8: The Information Technology sector remains in overbought territory. A reversal below the top band would generate a sell signal.
Materials: The Materials sector exhibits mixed dynamics. Positive indicators include lower 90-day sector volatility, which provides a steadier backdrop, while favorable alignment with copper, silver, and gold momentum underscores the benefit from strengthening commodity trends. Sales-yield conditions add to the positive tone, suggesting revenues are holding up. Additionally, improving materials-focused industrial production offers a cyclical tailwind, indicating demand signals may be firming beneath the surface. These bullish elements present a constructive foundation for selective strength. Negative indicators include relative strength remaining under pressure, with a weak moving-average crossover, soft momentum, and unfavorable overbought/oversold readings. Broader equity-momentum relationships, particularly relative to emerging and developed peers, are unsupportive, and potential mean reversion in natural gas futures adds another source of instability. Fundamental headwinds persist as earnings-yield trends weaken. With relative-price trend measures only neutral, the bearish backdrop dominates despite pockets of commodity-linked and production-led support. We are underweight.
Commentary: Materials lagged for a second straight month in October, pressured by weak chemicals and cautious China demand read-throughs. Relative strength remains soft. Into November, a flatter dollar and any sign of industrial activity could help, but near-term EPS growth looks subdued for 2025 before improving in 2026; CFRA shows 2025 up only ~1–2% with a stronger 2026 rebound. Valuation is not distressed but below Tech/Discretionary (~24x 2025E P/E; ~2.0x P/S), and leverage is modest. Watch commodity inputs (natural gas for chemicals, alumina for metals) and housing starts for building products.
Figure 9: Historically, better equity performance in Emerging Markets has been bullish for the Materials sector. EM is slowly making headway against DM, the opposite of what we saw last month.
Real Estate: Real Estate exhibits somewhat broader participation, with stronger 50-day relative breadth suggesting deeper engagement across the group. However, the broader backdrop remains challenging. Relative price trend, percentage of positive days, and deviation from trend all point to continued underperformance. Higher long-term Treasury yields add pressure by increasing financing costs and weighing on valuations. Weaker construction-supply production signals softer building-related activity, while tighter small-business credit conditions could curb commercial real-estate demand. Together, these bearish indicators outweigh the supportive breadth and housing-related signals, keeping the overall tone cautious despite selective positives. We are now neutral.
Commentary: With the Fed cutting in late October and talk of a December move, REITs finally got some policy relief. In November, we are focusing on cap rates vs. bond yields, debt maturities, and leasing spreads. CFRA shows 2025 sector EPS (FFO proxy) down y/y on tough comps before improving in 2026; valuation is mixed: ~15x 2025E P/E and ~6x sales, with leverage near 1x debt-to-equity. Subsector divergence is wide—data centers and towers correlate with AI build-outs, while offices remain idiosyncratic. If rates continue to drift lower and credit markets remain healthy, capital-intensive REITs could see a relative bid. Recent prints: industrial/logistics reported resilient rent growth; towers called out churn normalization. Watch the path of real rates into year-end and the refinancing window.
Figure 10: Improvement in the NFIB Small Business Credit Conditions survey often supports the Real Estate sector.
Utilities: Utilities' overbought/oversold signals suggest improving conditions, hinting that prior selling pressure may be easing and positioning could support a rebound. Favorable sensitivity to crude oil perpetual futures and a constructive relationship with manufacturing sentiment point to cyclical undercurrents that may help stabilize relative performance. In addition, the sector’s dividend yield continues to provide an income buffer, appealing to defensively oriented investors and offering a potential valuation floor. However, recent relative price trends are weak, with negative moving-average signals, soft momentum, and frequent price reversals. Deviation from trend reinforces this weakness, and narrow 50-day breadth suggests limited participation within the group. Valuation dynamics are challenged as the earnings yield lags long-term Treasuries, while capacity utilization signals highlight macro softness. We remain slightly underweight.
Commentary: Utilities rallied in October as bond-proxy sectors looked cheap and rate sensitivity flipped from a headwind to a tailwind after the Fed cut. The structural story—electrification and AI-driven data-center load growth—keeps rate-base expansion elevated into 2026–27. CFRA shows mid-to-high single-digit 2025 EPS growth; AltaVista’s 2025E P/E ~20x and P/B ~2.4x are a touch above historical troughs but below Tech crowding. Potential November drivers include commission decisions on allowed ROEs, capex trackers, and balance-sheet funding as spreads ease; weather normal adds noise. Utilities’ beta and standard deviation are the lowest among sectors, and the CAPE model pegs many bond proxies as “cheap” on long-term value metrics. Recent reports highlighted constructive rate cases and datacenter interconnect backlogs. If yields grind lower into December, Utilities’ income and growth profile remains compelling.
Figure 11: Relative Breadth is declining from the recent peak. A decisive reversal would support increased exposure.
Catastrophic Stop Update
The Catastrophic Stop model combines time-tested, objective indicators designed to identify high-risk periods for the equity market. The model entered November recommending a fully invested equity allocation relative to the benchmark.
Several factors continue to underpin a constructive equity outlook. Q3 earnings have broadly exceeded expectations, pushing S&P 500 growth to ~10.7% y/y, with guidance holding up. Notably, earnings expectations for the “493” are poised to narrow the gap with the “7” over the coming quarters. Mega-cap tech remains a powerful tailwind, signaling sustained AI-driven capex through 2026 and supporting demand across semiconductors, cloud, and networking. Inflation has eased only gradually (Sept CPI +0.3% m/m, +3.0% y/y), yet markets increasingly view the Fed as less restrictive as balance-sheet runoff slows—even as Powell downplayed near-term cuts. We still see December as in play.
Resilient earnings, sustained AI investment, a less-restrictive policy backdrop, and renewed buybacks should outweigh near-term headwinds. Positioning and flows remain supportive, but a cluster of upcoming data releases could introduce episodic volatility.
The weight of the evidence suggests that any weakness is unlikely to extend into a significant downtrend at this time. Of course, if our model triggers a sell signal (below 40% for two consecutive days), indicating more substantial problems, we will raise cash immediately.
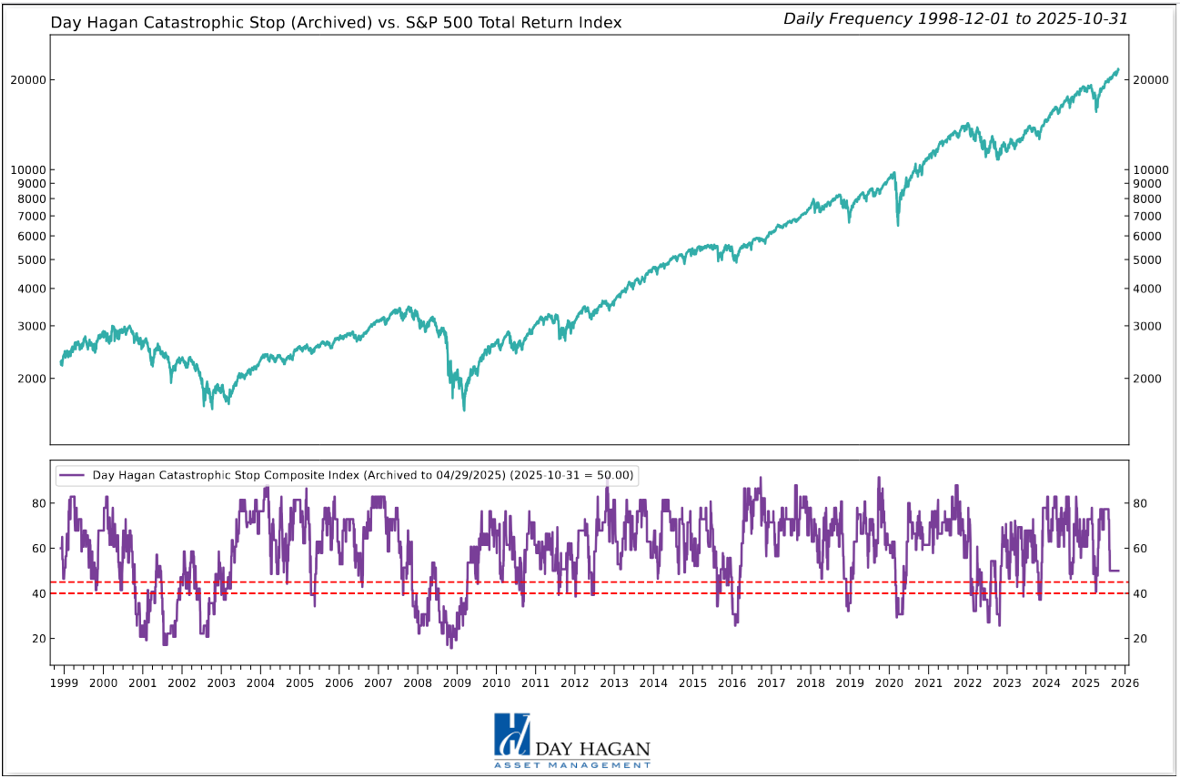
Figure 12: The Catastrophic Stop model recommends a fully invested equity position (relative to the benchmark). Because the model uses indices to extend its history, it is considered hypothetical.
The Day Hagan Daily Market Sentiment Composite (part of the Catastrophic Stop Model) remains in the “Excessive Pessimism” zone, reflecting a notable rise in investor caution. Historically, such rapid buildups in pessimism have often preceded rebounds, suggesting a greater likelihood of a year-end rally.
As of the end of October, U.S. equity sentiment remained cautious despite new market highs. The weekly American Association of Individual Investors (AAII) Bull-Bear spread stood around 7.17, up from -5.80% the previous week, indicating more bulls than bears, but not yet extended. Fund flows showed only $1.81 billion into U.S. equities for the week ending Oct 29, pulling back sharply from ~$9.65 billion the prior week, but understandable as investors awaited the FOMC decision and presser.
Meanwhile, we’re keeping an eye on technical breadth (e.g., the percentage of S&P 500 stocks above their 50— and 200-day averages), as both measures declined into last Friday, now at 22% and 33%, respectively. (Last Monday was odd, with the worst day of market breadth ever; the market closed at an all-time high, but 80% of the stocks declined. Some divergences reversed later in the week, but this is worth remembering.)
Figure 13: Investor sentiment is being reset, as illustrated by the DH Daily Market Sentiment Composite declining below 70. A decline below 30 and a reversal back above would be a nice setup for a year-end rally.
Our goal is to stay on the right side of the prevailing trend, introducing risk management when conditions deteriorate. Currently, the uptrend remains intact. The broader-based composite models, which call for U.S. and international economic growth, inflation trends, liquidity, and equity demand, remain constructive. The Catastrophic Stop model is positive, and we align with its message. If our models shift to bearish levels, we will raise cash.
This strategy utilizes measures of price, valuation, economic trends, monetary liquidity, and market sentiment to make objective, rational, and unemotional decisions about how much capital to allocate and where to invest that capital.
Day Hagan Asset Management
1000 S. Tamiami Trl
Sarasota, FL 34236
Toll Free: (800) 594-7930
Office Phone: (941) 330-1702
Website: https://dayhagan.com or https://dhfunds.com
This material is for educational purposes only. Further distribution is prohibited without prior permission. Please see the information on Disclosures and Fact Sheets here: https://dhfunds.com/literature. Charts with models and return information use indices for performance testing to extend the model histories, and they should be considered hypothetical. All Rights Reserved. (© Copyright 2025 Day Hagan Asset Management.)
Day HaganSmart Sector®
With Catastrophic Stop ETF
Symbol: SSUS
Disclosures
The data and analysis contained within are provided “as is” and without warranty of any kind, either express or implied. The information is based on data believed to be reliable, but it is not guaranteed. Day Hagan DISCLAIMS ANY AND ALL EXPRESS OR IMPLIED WARRANTIES, INCLUDING, BUT NOT LIMITED TO, ANY WARRANTIES OF MERCHANTABILITY, SUITABILITY, OR FITNESS FOR A PARTICULAR PURPOSE OR USE. All performance measures do not reflect tax consequences, execution, commissions, and other trading costs, and as such, investors should consult their tax advisors before making investment decisions, as well as realize that the past performance and results of the model are not a guarantee of future results. The Smart Sector® Strategy is not intended to be the primary basis for investment decisions, and the usage of the model does not address the suitability of any particular investment for any particular investor.
Using any graph, chart, formula, model, or other device to assist in deciding which securities to trade or when to trade them presents many difficulties, and their effectiveness has significant limitations, including that prior patterns may not repeat themselves continuously or on any particular occasion. In addition, market participants using such devices can impact the market in a way that changes the effectiveness of such devices. Day Hagan believes no individual graph, chart, formula, model, or other device should be used as the sole basis for any investment decision and suggests that all market participants consider differing viewpoints and use a weight-of-the-evidence approach that fits their investment needs.
Past performance does not guarantee future results. No current or prospective client should assume future performance of any specific investment or strategy will be profitable or equal to past performance levels. All investment strategies have the potential for profit or loss. Changes in investment strategies, contributions or withdrawals, and economic conditions may materially alter the performance of your portfolio. Different types of investments involve varying degrees of risk, and there can be no assurance that any specific investment or strategy will be suitable or profitable for a client’s portfolio. Historical performance results for investment indexes and/or categories generally do not reflect the deduction of transaction and/or custodial charges or the deduction of an investment management fee, the incurrence of which would have the effect of decreasing historical performance results. There can be no assurances that a portfolio will match or outperform any particular benchmark.
The information contained herein is provided for informational purposes only and should not be construed as investment advice or a recommendation to buy or sell any security. The securities, instruments, or strategies described may not be suitable for all investors, and their value and income may fluctuate. Past performance is not indicative of future results, and there is no guarantee that any investment strategy will achieve its objectives, generate profits, or avoid losses.
This material is intended to provide general market commentary and should not be relied upon as individualized investment advice. Investors should consult with their financial professional before making any investment decisions based on this information.
Data and analysis are provided “as is” without warranty of any kind, either express or implied. Day Hagan Asset Management, its affiliates, employees, or third-party data providers shall not be liable for any loss sustained by any person relying on this information. All opinions and views expressed are subject to change without notice and may differ from those of other investment professionals within Day Hagan Asset Management or Ashton Thomas Private Wealth, LLC.
Accounts managed by Day Hagan Asset Management or its affiliates may hold positions in the securities discussed and may trade such securities without notice.
Day Hagan Asset Management is a division of and doing business as (DBA) Ashton Thomas Private Wealth, LLC, an SEC-registered investment adviser. Registration with the SEC does not imply a certain level of skill or training.
There is no guarantee that any investment strategy will achieve its objectives, generate dividends, or avoid losses.
This material is for educational purposes only. Further distribution is prohibited without prior permission. Please see the information on Disclosures and Fact Sheets here: https://dhfunds.com/literature. Charts with models and return information use indices for performance testing to extend the model histories, and they should be considered hypothetical. All Rights Reserved. (© Copyright 2025 Day Hagan Asset Management.)
© 2025 Day Hagan Asset Management
