
Day Hagan Smart Sector® International Strategy Update May 2026
A downloadable PDF copy of the Article:
Day Hagan Smart Sector® International Strategy Update May 2026 (pdf)
Executive Summary
April delivered a classic late-cycle macro plot twist. Equities sought to celebrate AI, while bond markets had to reprice the risk that inflation was not finished. The month’s defining shock came from energy. March CPI, released April 10, rose 0.9% month over month and 3.3% year over year, with energy up 10.9% and gasoline up 21.2%, the largest monthly gasoline increase recorded. That single release changed the tone of fixed-income markets, leading investors to question whether policy rates could remain higher for longer.
Yet equities largely overlooked rate anxiety. The S&P 500 rose about 10%, the Nasdaq about 15%, and the Dow about 7% in April, with the S&P 500 and Nasdaq posting their best monthly gains since 2020. Leadership was not broad optimism but targeted enthusiasm. AI infrastructure, semiconductors, data centers, and mega-cap technology drove the market. Effectively, investors believed that capital spending on AI could be powerful enough to offset margin pressure from oil and rates.
Macro data offered both bulls and bears support. First-quarter U.S. GDP, released April 30, grew at a 2.0% annualized pace, supported by investment, exports, consumer spending, and government spending. The same day, the March PCE report showed personal spending up 0.9%, while the PCE price index rose 3.5% year over year, reinforcing the idea that demand had not cooled enough to give central banks easy cover.
Geopolitics added a risk premium. Oil prices climbed above $126 per barrel on April 30 before retreating, as markets responded to the U.S.-Iran war and potential for prolonged Middle East supply disruption. Central banks responded with caution. The Fed held its target range at 3.50%–3.75%, while the ECB and Bank of England also left rates unchanged. For clients, April’s lesson was clear. Equities can rally on accelerating earnings expectations, but fixed income still trades on inflation arithmetic.
Given the energy shock, key regional risks are increasingly being divided by import exposure. The U.S. is better positioned than most peers, having been a net total energy exporter since 2019, though it still imports crude oil mainly because certain refineries are configured for heavier grades. Higher gasoline and freight costs are pressuring consumers, but U.S. LNG producers are gaining share as swing suppliers. In April, Asia accounted for nearly a quarter of U.S. LNG exports, while Europe received about 56%. U.S. crude oil production remained near record levels, with EIA weekly data showing output at 13.6 million barrels per day for the week ended April 24, 2026. Refinery utilization also remained high, at 89.6% in the same week, helping to support domestic fuel supply.
Europe remains more exposed to energy market volatility. The EU imported 57% of its energy needs in 2024, while energy product imports in 2025 still totaled €336.7 billion, or 723.3 million tons, despite a 11.1% decline in value from 2024. Crude oil, petroleum products, and gas continue to dominate the import mix. The shock is pressuring household real income, industrial margins, and fiscal policy. EU gas storage was a vulnerability rather than a strong cushion: inventories were reported near 31% of capacity in late April, after starting the month around 28%, making the summer refill campaign more expensive and more exposed to LNG competition from Asia. At the same time, the shock is accelerating investments in grid upgrades, renewables, LNG infrastructure, storage, and nuclear power as governments seek to reduce long-term reliance on imports.
Emerging markets face the hardest trade-offs. The OECD notes that many large importers have strategic stocks, but lower-income economies often have thinner buffers. According to the IMF’s April 2026 outlook, a severe energy shock could reduce GDP growth in emerging markets excluding China by 1.9 percentage points, with current account balances and inflation rates likely to deteriorate. Food inflation remains a persistent risk in several regions, given the linkages among energy costs, fertilizers, freight, and other agricultural inputs.
Japan remains highly import-dependent, with OECD data showing that net energy imports exceed 80% of domestic consumption in both Japan and Korea. The current shock is worsening terms of trade and adding to currency volatility, with the yen weakening past 160 per U.S. dollar in April 2026, near its weakest levels since 2024. Policy responses include accelerated efforts to secure long-term LNG contracts, diversify supply, and restart or extend nuclear generation where politically feasible. Investment focus is shifting toward exporters with pricing power, utilities with approved cost recovery, and energy-security themes.
Pacific ex-Japan is mixed, as Korea and Taiwan are vulnerable as major LNG and oil importers, while Australia benefits as a commodity exporter but still faces domestic fuel-import inflation. In April, South Korea and Australia announced new bilateral agreements to deepen energy supply-chain cooperation, including collaboration on hydrogen, critical minerals, and LNG. Taiwan also remains exposed to global LNG prices, with domestic gas price pressures reflecting higher import costs.
Canada is the cleanest regional hedge, remaining a major oil, gas, and power exporter. Higher fuel costs are lifting input prices, but the terms-of-trade effect is more favorable than in most developed markets. The April Manufacturing PMI improved to 53.3, though much of the gain reflected stockpiling rather than organic demand. For investors, Canada’s relative appeal lies in energy-linked cash flows, infrastructure, pipelines, and select industrials tied to North American supply security.
Holdings
Core: Developed Market Positions (approximately 65% of equity holdings)
Country
Australia
Canada
China
France
Germany
Japan
Switzerland
United Kingdom
Outlook
Neutral
Overweight
Underweight
Underweight
Underweight
Overweight
Underweight
Neutral
Explore: Emerging Market Positions (approximately 35% of equity holdings)
Peru
Brazil
Chile
Mexico
New Zealand
Position Details
Core: Developed Market Commentary
Approximately 65% of the strategy is allocated across eight of the largest markets in the ACWI ex-U.S. Index. The fund overweights and underweights the largest non-U.S. equity markets based on macro, fundamental, behavioral, and technical indicators.
Australia: Australia’s outlook is generally positive, but valuations are still an issue. Key indicators show the market is supported by commodities, higher relative interest rates (which create demand from global investors seeking yield), and steady equity trends. The neutral bear-market signal means things aren’t overheated. However, other measures suggest the market is not cheap. Opportunities are in miners, gold-related stocks, infrastructure, and solid banks. Australia’s March inflation, released in late April, rose 4.6% from last year. Gasoline prices jumped 32.8% in one month, making energy the main cause of higher prices. Manufacturing activity improved a little in April, but mostly because of longer delivery times and companies building up inventories, not stronger demand. The Reserve Bank raised interest rates to 4.10% in March, and most economists expect another hike to 4.35% in May. In this setting, BHP, Commonwealth Bank, CSL, NAB, and Westpac continue to drive the index.
Figure 1: Following gold’s recent decline, the yellow metal appears primed for a rebound, which would be a positive underpinning for Australia’s resource-heavy equity index.
Canada: Canada’s situation looks better than its economic numbers suggest. Key indicators show the market still has some short-term support. However, weaker growth signals and a less supportive currency raise some concerns. Recent strength has been focused on energy, pipelines, gold, and banks. April’s data supports this view. Canada’s manufacturing activity rose to 53.3 from 50.0, the highest since June 2022, but much of the gain came from companies stockpiling because of the war, not from stronger demand. March inflation, released in April, was up 2.4% from last year. Energy prices rose 3.9% over the year and 13.1% in one month. The Bank of Canada kept its main interest rate at 2.25% on April 29, pointing to higher oil prices and trade uncertainty. The main stocks leading the index are Royal Bank, TD, Shopify, Enbridge, Canadian Natural Resources, Agnico Eagle, and Brookfield.
Figure 2: The Canadian dollar has rolled over and is a potential headwind for global demand flows.
China: China’s equity market has begun to show signs of improvement, as reflected in recent manufacturing and credit data. Official and private PMI figures for April remained in expansion territory, supported by increased output and new orders. However, consumer demand remains subdued, with March retail sales rising only 1.7% year over year. Despite some positive indicators, price momentum and other market signals suggest that many investors remain cautious. The MSCI China Index is heavily weighted toward companies such as Tencent, Alibaba, China Construction Bank, PDD, Xiaomi, ICBC, Ping An, Meituan, BYD, and Bank of China, which means internet, banking, and electric-vehicle sectors significantly influence index performance.
Figure 3: High-yield credit spreads often represent risk-on versus risk-off attitudes. Increasing spreads may indicate investors are becoming more risk-averse. The reversal in spreads may indicate that a more risk-on attitude is taking hold.
France: France’s Composite model is cautious. Most of the indicators are bearish, including trend, the ACWI technical scorecard, 50-day momentum, OECD leading indicators, dividend yield, and valuation. The one positive signal is 200-day breadth, which suggests parts of the market are still holding up under the surface. Neutral ETF flows also indicate investors are not showing a clear directional bias. Overall, the model points to a selective approach, with relative strength evident in defense, aerospace, energy, industrial automation, and global companies with stronger pricing power. The backdrop is choppy. France’s composite PMI fell to 47.6 in April from 48.8, showing a deeper private-sector slowdown, even as manufacturing PMI rose to 52.8, the highest since May 2022. First-quarter GDP was flat, missing expectations for 0.2% growth, as weaker consumption and investment offset gains from inventory buildup. Inflation also moved up: harmonized inflation rose to 2.5% in April from 2.0% in March, driven by energy. Index leadership is concentrated in TotalEnergies, Schneider Electric, LVMH, Air Liquide, Airbus, Safran, BNP Paribas, L’Oréal, Sanofi, and AXA.
Figure 4: European fund outflows appear to be stabilizing. We’re monitoring flows for signs that demand is improving and that an upgrade is warranted.
Germany: Germany’s Composite model is mixed, with a slight cautious tilt. Breadth, the relative moving-average cross, and dividend yield factors are positive, which suggests parts of the market still have support. However, bearish readings from the ACWI technical scorecard, ETF flows, manufacturing confidence, and the euro-dollar signal point to a less settled setup. The model suggests staying balanced, with more attention to companies tied to automation, defense, insurance, power equipment, and global software than to broad export cyclicals. The April/May backdrop explains the crosscurrents. Germany’s manufacturing PMI eased to 51.2 in April from 52.2, as output and new orders slowed and employment remained weak. Composite PMI fell to 48.3, showing renewed private-sector contraction. First-quarter GDP grew 0.3%, better than expected, but April inflation rose to 2.9%, driven by a 10.1% increase in energy prices. Index impact is concentrated: Siemens, SAP, Allianz, Siemens Energy, Deutsche Telekom, Infineon, Munich Re, Rheinmetall, Deutsche Boerse, and BASF were the top MSCI Germany weights at April-end.
Figure 5: ETF fund flows improving for Germany.
Japan: Japan’s Composite model is one of the cleaner positive setups in this group. Absolute trend, relative trend, the ACWI technical scorecard, China PMI, valuation, forward earnings growth, and the yen signal are all supportive. The only bearish reading is sentiment reversal, which suggests investor enthusiasm may need to cool. Overall, the model points to staying involved, but with attention to price discipline and earnings quality. The backdrop is helpful, though not risk-free. Japan’s manufacturing PMI rose to 55.1 in April from 51.6, the strongest reading in more than four years, helped by production, new orders, and inventory building. Supply chains were a problem, with delivery times worsening and input costs rising on oil, raw materials, and transport. The BOJ held rates at 0.75%, but three members voted for a hike to 1.0%, showing policy is getting less easy. Index drivers include Mitsubishi UFJ, Toyota, Hitachi, Advantest, Tokyo Electron, SoftBank Group, Sony, and Mizuho.
Figure 6: Earnings growth expectations continue to increase.
Switzerland: Switzerland’s Composite model is cautious. The only positive reading is 200-day breadth, which suggests some parts of the market are still holding up. The rest of the model is weaker: trend, 50-day momentum, moving-average slope, dividend yield, relative yields, and ETF flows are all bearish. That points to a market where defense still matters, and broad leadership is not yet confirmed. The model suggests a selective approach, with focus on health care, quality industrials, insurance, and companies with steadier cash flows. The April/May backdrop is also mixed. Swiss inflation rose to 0.3% in March from 0.1%, the highest in a year, as fuel prices increased, but inflation remained low compared with the euro area. Switzerland’s manufacturing PMI improved to 53.3 in March from 47.4, indicating a stronger factory reading heading into April. The SNB warned in April that the Middle East conflict could mean slower growth and higher inflation. Index impact remains concentrated in Roche, Novartis, Nestlé, ABB, UBS, Richemont, Zurich Insurance, Swiss Re, Holcim, and Lonza.
Figure 7: Breadth initially improved from oversold levels, but is still in negative territory.
United Kingdom: The U.K.’s Composite model has improved. Trend, cross-sectional momentum, sterling, and sentiment are all positive, suggesting the market is supported by both price action and investor positioning. The bearish valuation and OAS (option-adjusted spread) readings are the main offsets, so the model does not support an unchecked risk-on view. A balanced approach may favor global earners, energy, defense, banks, and steady dividend payers, while being more careful with areas exposed to tighter credit conditions. The April/May backdrop is firmer, but cost pressure remains. U.K. manufacturing PMI rose to 53.7 in April from 51.0, the highest since May 2022, helped by stronger output and new orders. Inflation also rose, with March CPI, released in April, up 3.3% year over year from 3.0% in February. The Bank of England held Bank Rate at 3.75% in April, with an 8–1 vote and one member favoring a hike. Index impact remains concentrated in HSBC, AstraZeneca, Shell, Rolls-Royce, British American Tobacco, Unilever, BP, Rio Tinto, GSK, and National Grid.
Figure 8: Sentiment initially rebounded from levels denoting extreme pessimism, but the recent peak indicates that the current move may be encountering resistance.
Emerging Market Positions
Approximately 30% of the strategy is allocated across five markets from a pool of more than 20 smaller markets. Selection is based on a multifactor technical ranking system that uses trend and mean-reversion indicators. The process seeks to identify oversold opportunities in global equity markets that are likely to mean-revert from lower levels and to exhibit mild pullbacks from long-term uptrends.
Current Holdings:
Peru
Brazil
Chile
Mexico
New Zealand
Explore: Emerging Market Commentary
Peru:
Peru is a small, concentrated market, but that concentration gives it a clear identity. The market is driven mainly by banks, copper, and gold, with Credicorp, Southern Copper, and Buenaventura carrying most of the index weight. Inflation edged up to 4.0% in April, while the policy rate stood at 4.25%, leaving real rates modestly positive. That backdrop could help support the currency and local assets if inflation cools.
Copper exposure ties Peru to global infrastructure, electrification, and supply-security themes, while gold can help when investors are worried about inflation or geopolitical risk. Credicorp adds financial-sector exposure, supported by a rate backdrop that is not overly loose. The main risk is concentration: a few companies and sectors can drive most of the market’s return. For client portfolios, Peru may be best viewed as a targeted allocation to metals and financials rather than a broad country exposure.
Brazil:
Brazil stands out for its mix of commodity exposure, financial depth, and income potential. The central bank’s recent rate cuts have helped investor sentiment, while mid-April inflation of 4.37%, which came in below expectations, kept the easing story alive. Policymakers remain cautious, however, as higher energy prices and global risks could slow the pace of further rate cuts.
The index is well aligned with the current macro setting. Vale, Nu Holdings, Itaú Unibanco, Petrobras, Bradesco, B3, Sabesp, and Itaúsa give investors exposure to iron ore, oil, banking, market activity, and infrastructure. That mix can work well if lower rates support domestic demand while global commodity prices remain firm.
The positive case is that Brazil may benefit from both easing policy and continued demand for real assets. A stronger currency can also help contain imported inflation. The key risk is sticky inflation, which could limit how much monetary policy can ease. Still, if earnings hold up and rates continue to move lower, Brazil may remain one of the more attractive emerging market opportunities.
Chile:
Chile offers one of the cleaner ways to gain equity exposure to copper. The market is shaped by metal prices, interest rates, and domestic demand, with copper playing an outsized role in the trade balance, fiscal revenues, and investor sentiment. The central bank has kept its policy rate at 4.5%, reflecting caution around global uncertainty, higher oil prices, and inflation risk.
The positive side is straightforward: copper remains tied to long-term themes such as electrification, infrastructure, and supply security. Banks may also benefit from a steadier rate environment if loan demand and credit quality hold up. At the same time, Chile is an energy importer, so higher oil prices can pressure consumers, margins, and inflation expectations.
Miners, banks, and companies less exposed to fuel-sensitive margins may be better positioned than broad domestic consumer plays. Chile may appeal to investors looking for a more focused Latin American allocation with copper upside, a credible central bank, and a policy rate that is no longer rising sharply.
Mexico:
Mexico’s equity story is mixed, but there are still several positive pieces. Growth has slowed, with first-quarter GDP down 0.8%, yet inflation is moving in a better direction. Mid-April inflation eased to 4.53%, while core inflation slowed to 4.27%. Banxico has cut its policy rate to 6.75%, though officials have also suggested the easing cycle may be closer to its later stages.
For equities, the better opportunities appear more company- and theme-specific. Grupo México, Banorte, América Móvil, FEMSA, Cemex, Walmex, and airport operators give the market exposure to copper, banking, telecom, staples, construction, retail, and travel. The World Cup may also support airports, hotels, restaurants, and consumer activity later this year. Walmex’s stronger first-quarter profit, helped by Mexican sales and online demand, is a useful example of how domestic scale still matters.
Mexico can still benefit from nearshoring, infrastructure, tourism, and high-quality domestic franchises. However, weaker growth argues against treating the market as a simple broad recovery trade.
New Zealand:
New Zealand's equity market is often less volatile, which can be useful when global markets are unsettled. The Reserve Bank of New Zealand has kept the official cash rate at 2.25%, while inflation has held at 3.1%. Higher fuel costs remain a challenge, but the market’s sector mix gives it a more defensive profile than many other small developed markets.
The index is led by health care, infrastructure, airports, and utilities. Fisher & Paykel Healthcare, Auckland International Airport, Infratil, Contact Energy, and Meridian Energy are key names, giving investors exposure to medical devices, travel recovery, renewable power, and contracted or regulated cash flows. That structure can help when investors want steadier earnings and less direct exposure to global cyclicals.
The main risk is that higher fuel prices weigh on consumers and travel margins, while the central bank is not yet moving quickly toward easier policy. Still, with inflation no longer accelerating and the RBNZ on hold, New Zealand may remain useful as a defensive developed-market allocation with select growth from health care, infrastructure, and renewable energy.
Catastrophic Stop Model
The Catastrophic Stop model combines time-tested, objective indicators designed to identify high-risk periods for the equity market. The model entered May recommending a fully invested equity allocation relative to the benchmark.
The weight of the evidence suggests that any weakness is unlikely to extend into a significant downtrend at this time. Of course, if our model triggers a sell signal (below 40% for two consecutive days), indicating more substantial problems, we will raise cash immediately.
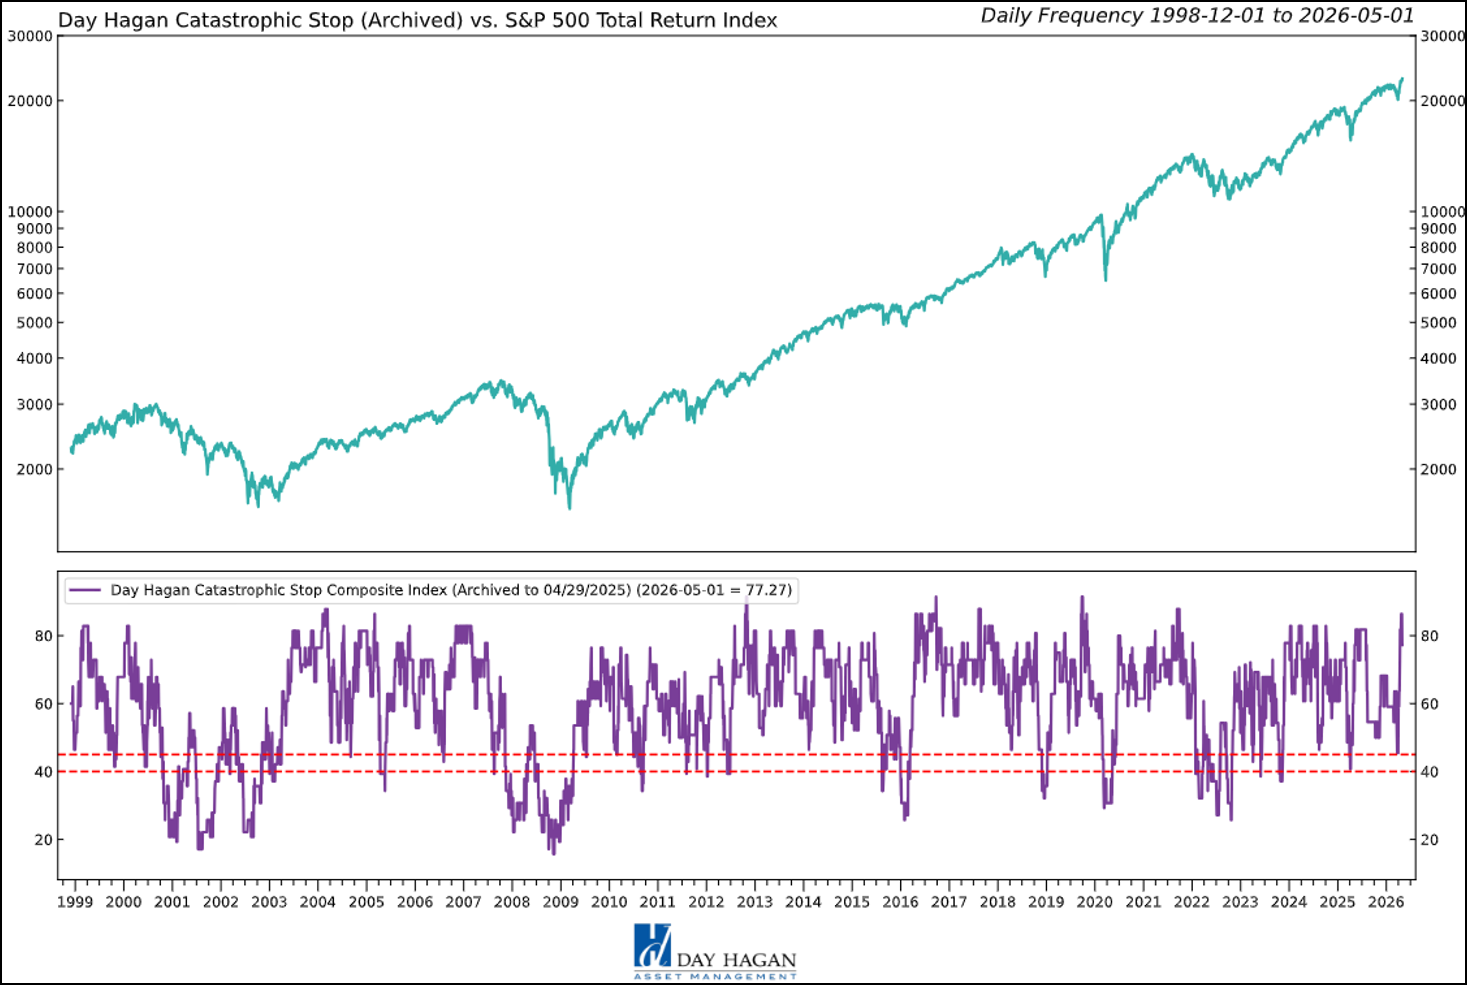
Figure 9: The Catastrophic Stop model recommends a fully invested equity position (relative to the benchmark). Because the model uses indices to extend its history, it is considered hypothetical.
Hypothetical and historical past performance is not indicative of future results. There can be no assurance that any investment or strategy will achieve its objectives or avoid substantial losses or have comparable results. This information is provided for illustrative purposes only and is not a prediction, projection, or guarantee of future performance. Hypothetical results do not reflect actual trading, were derived using the benefit of hindsight, and may not reflect material economic and market events. Actual results vary and depend on many factors and subject to risk and uncertainties.
This chart compares the S&P 500 with the Day Hagan Daily Market Sentiment Composite. The current composite reading is 89.43, well above the +70 upper bracket, indicating elevated or optimistic sentiment. Historically, readings above this level often suggest a strong risk appetite and a positive market tone, but they can also indicate the market is becoming stretched in the short term. This is not necessarily bearish by itself; rather, it suggests investors are already leaning bullish, so near-term upside may be more vulnerable to consolidation, volatility, or disappointment. The way we incorporate these types of models into our outlook is to "Go with the flow until it reaches an extreme and reverses." We're still going with the flow, but headwinds are building.
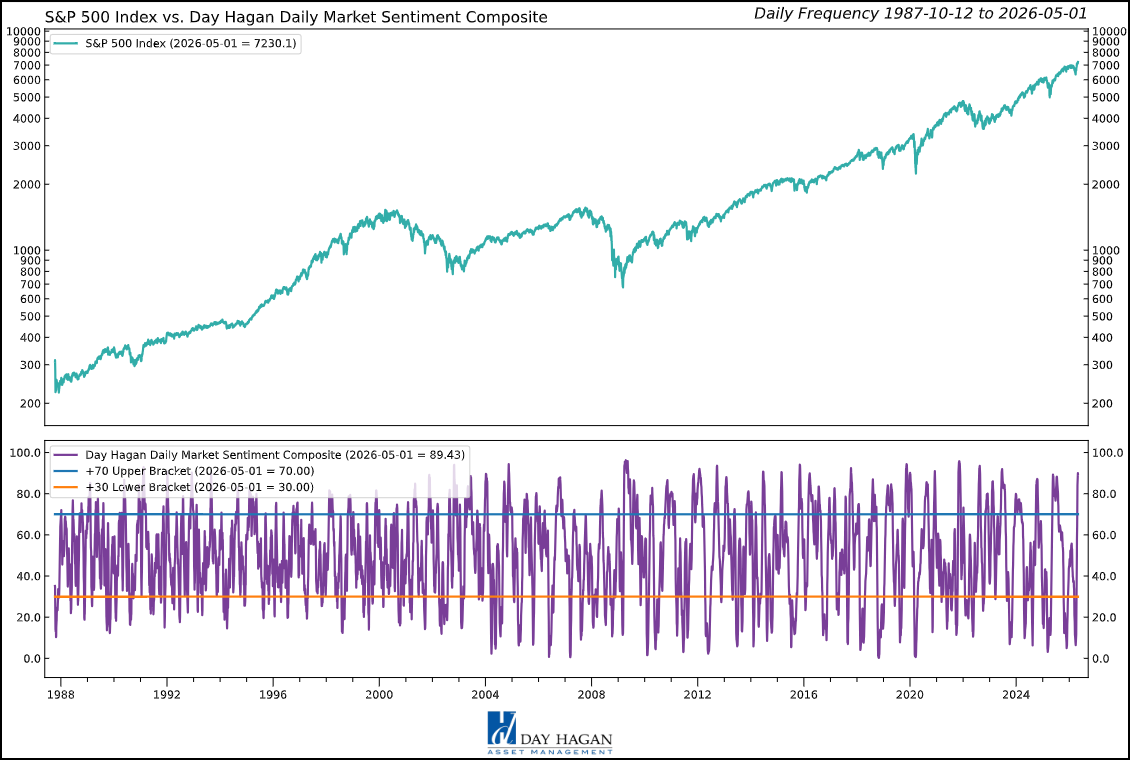
Figure 10: A sell signal would occur if the Composite falls back below 70, suggesting investors may be shifting toward a more pessimistic view of the market.
This strategy uses measures of price, valuation, economic trends, liquidity, and market sentiment to make objective, rational, and unemotional decisions about how much capital to risk and where to allocate it.
For more information, please contact us at:
Day Hagan Asset Management
1000 S. Tamiami Trl
Sarasota, FL 34236
Toll Free: (800) 594-7930
Office Phone: (941) 330-1702
Website: https://dayhagan.com or https://dhfunds.com
© 2026 Day Hagan Asset Management
This material is for educational purposes only. Further distribution is prohibited without prior permission. Please see the information on Disclosures and Fact Sheets here: https://dhfunds.com/literature. Charts with models and return information use indices for performance testing to extend the model histories, and they should be considered hypothetical. All Rights Reserved. (© Copyright 2026 Day Hagan Asset Management.)
Day Hagan Smart Sector® International ETF
Symbol: SSXU
Strategy Description
The Smart Sector® International strategy combines three quantitative investment strategies: Core International, Explore International, and Catastrophic Stop.
The Process Is Based On The Weight Of The Evidence
Core Allocation
The fund begins by overweighting and underweighting the largest non-U.S. equity markets based on proprietary models.
Each of the models utilizes market-specific, weight-of-the-evidence composites of fundamental, economic, technical, and behavioral indicators to determine each area’s probability of outperforming the ACWI, for example. U.S. Markets are weighted accordingly relative to benchmark weightings.
Explore Allocation
To select smaller markets, the fund uses a multi-factor technical ranking system to choose the top markets. The markets with the highest rankings split the non-core model allocation equally.
When Market Risks Become Extraordinarily High — Reduce Your Portfolio Risk
The model remains fully invested unless the Catastrophic model is triggered, whereupon the equity-invested position may be trimmed by up to 50%.
The Catastrophic Stop model combines time-tested, objective indicators designed to identify periods of high risk for the broad U.S. equity market. The model uses price-based, breadth, deviation from trend, fundamental, economic, interest rate, behavioral, and volatility-based indicator composites.
When Market Risks Return To Normal — Put Your Money Back To Work
When the Catastrophic Stop model moves back to bullish levels, indicating lower risk, the strategy will reverse toward being fully invested.
Disclosures
The data and analysis contained within are provided “as is” and without warranty of any kind, either express or implied. The information is based on data believed to be reliable, but it is not guaranteed. Day Hagan DISCLAIMS ANY AND ALL EXPRESS OR IMPLIED WARRANTIES, INCLUDING, BUT NOT LIMITED TO, ANY WARRANTIES OF MERCHANTABILITY, SUITABILITY, OR FITNESS FOR A PARTICULAR PURPOSE OR USE. All performance measures do not reflect tax consequences, execution, commissions, and other trading costs, and as such, investors should consult their tax advisors before making investment decisions, as well as realize that the past performance and results of the model are not a guarantee of future results. The Smart Sector® Strategy is not intended to be the primary basis for investment decisions, and the usage of the model does not address the suitability of any particular investment for any particular investor.
Using any graph, chart, formula, model, or other device to assist in deciding which securities to trade or when to trade them presents many difficulties, and their effectiveness has significant limitations, including that prior patterns may not repeat themselves continuously or on any particular occasion. In addition, market participants using such devices can impact the market in a way that changes the effectiveness of such devices. Day Hagan believes no individual graph, chart, formula, model, or other device should be used as the sole basis for any investment decision and suggests that all market participants consider differing viewpoints and use a weight-of-the-evidence approach that fits their investment needs.
Past performance does not guarantee future results. No current or prospective client should assume future performance of any specific investment or strategy will be profitable or equal to past performance levels. All investment strategies have the potential for profit or loss. Changes in investment strategies, contributions or withdrawals, and economic conditions may materially alter the performance of your portfolio. Different types of investments involve varying degrees of risk, and there can be no assurance that any specific investment or strategy will be suitable or profitable for a client’s portfolio. Historical performance results for investment indexes and/or categories generally do not reflect the deduction of transaction and/or custodial charges or the deduction of an investment management fee, the incurrence of which would have the effect of decreasing historical performance results. There can be no assurances that a portfolio will match or outperform any particular benchmark. Comparisons to indices are inherently unreliable indicators of future performance. The strategies used to generate the performance vary from those used to generate the returns depicted in the benchmarks. Investors cannot directly invest in an index.
The information contained herein is provided for informational purposes only and should not be construed as investment advice or a recommendation to buy or sell any security. The securities, instruments, or strategies described may not be suitable for all investors, and their value and income may fluctuate. Past performance is not indicative of future results, and there is no guarantee that any investment strategy will achieve its objectives, generate profits, or avoid losses.
This material is intended to provide general market commentary and should not be relied upon as individualized investment advice. Investors should consult with their financial professional before making any investment decisions based on this information.
The material may contain “forward-looking” information that is not purely historical in nature. Such information may include, among other things, projections, forecasts, estimates of market returns, and proposed or expected portfolio composition. Day Hagan Asset Management, its affiliates, employees, or third-party data providers shall not be liable for any loss sustained by any person relying on this information. All opinions and views expressed are subject to change without notice and may differ from those of other investment professionals within Day Hagan Asset Management or Ashton Thomas Private Wealth, LLC.
Accounts managed by Day Hagan Asset Management or its affiliates may hold positions in the securities discussed and may trade such securities without notice.
Day Hagan Asset Management is a division of and doing business as (DBA) Ashton Thomas Private Wealth, LLC, an SEC-registered investment adviser. Registration with the SEC does not imply a certain level of skill or training.
This material is for educational purposes only. Further distribution is prohibited without prior permission. Please see the information on Disclosures and Fact Sheets here: https://dhfunds.com/literature. Charts with models and return information use indices for performance testing to extend the model histories, and they should be considered hypothetical. All Rights Reserved. (© Copyright 2026 Day Hagan Asset Management.)
All hypothetical results are presented for illustrative purposes only. Back-testing and other statistical analysis is provided in use simulated analysis and hypothetical circumstances to estimate how it may have performed prior to its actual existence. The results obtained from "back-testing" information should not be considered indicative of the actual results that might be obtained from an investment or participation in a financial instrument or transaction referencing the Index. The Firm provides no assurance or guarantee that the products/securities linked to the strategy will operate or would have operated in the past in a manner consistent with these materials. The hypothetical historical levels have inherent limitations. Alternative simulations, techniques, modeling or assumptions might produce significantly different results and prove to be more appropriate. Actual results will vary, perhaps materially, from the simulated returns presented.
© 2026 Day Hagan Asset Management
Definitions:
S&P/ASX 200 – Designed to measure the performance of the 200 largest index-eligible stocks listed on the Australian Securities Exchange by float-adjusted market capitalization.
PMI — A survey-based economic indicator that measures business activity in sectors such as manufacturing and services; readings above 50 generally indicate expansion, while readings below 50 indicate contraction.
CPI — A measure of inflation that tracks changes in the prices consumers pay for goods and services over time.
Core Inflation — Inflation excluding more volatile items, typically food and energy, used to gauge underlying price trends.
Federal Reserve (Fed) — The central bank of the United States, responsible for monetary policy, interest rates, and financial stability.
ECB — The European Central Bank, responsible for setting monetary policy for countries that use the euro.
Bank of Japan (BoJ) — Japan’s central bank, responsible for monetary policy, interest rates, and financial conditions in Japan.
Bank of Canada (BoC) — Canada’s central bank, responsible for setting policy rates and managing inflation and economic stability.
Bank of England (BoE) — The United Kingdom’s central bank, responsible for monetary policy and financial stability.
SNB — The Swiss National Bank, responsible for monetary policy and maintaining price stability in Switzerland.
PBoC — The People’s Bank of China, which manages monetary policy, liquidity, and key lending benchmarks in China.
S&P 500 — A major U.S. stock market index tracking 500 large publicly traded U.S. companies; widely used as a benchmark for the U.S. equity market.
DJIA — The Dow Jones Industrial Average, a price-weighted stock index of 30 large U.S. companies, often used as a headline indicator of the U.S. stock market.
Nasdaq Composite — A stock market index composed largely of companies listed on the Nasdaq exchange, with especially heavy representation from technology and growth stocks.
STOXX 600 — A broad European stock index that tracks 600 large, mid, and small companies across Europe.
Nikkei 225 — A major Japanese stock market index tracking 225 prominent Japanese companies.
TSX — Canada’s main stock market benchmark, often referring to the S&P/TSX Composite Index.
CAC 40 — France’s main stock market index, tracking 40 major French companies.
DAX — Germany’s main stock market index, tracking major German listed companies.
FTSE 100 — The leading U.K. stock market index, tracking 100 large companies listed in London.
Shanghai Composite — A major Chinese stock index tracking stocks listed on the Shanghai Stock Exchange.
Shenzhen Component — A major Chinese stock index tracking companies listed on the Shenzhen Stock Exchange.
ACWI ex-U.S. Index — The MSCI All Country World Index excluding the United States; a benchmark for developed and emerging equity markets outside the U.S.
10-Year Yield — The interest rate paid on a 10-year government bond; a key benchmark for long-term borrowing costs and valuation.
Bund Yield — The yield on German government bonds, often used as a benchmark for euro-area sovereign debt.
Gilt Yield — The yield on U.K. government bonds, commonly called gilts.
OAT Yield — The yield on French government bonds.
Policy Rate — The benchmark interest rate set by a central bank to influence borrowing costs, inflation, and economic activity.
Basis Point (bp) — One one-hundredth of a percentage point; 25 basis points equals 0.25%.
Relative Strength — A measure of how a market, sector, or asset performs compared with another market or benchmark.
Overweight / Underweight / Neutral — Portfolio positioning terms: overweight means above benchmark allocation, underweight means below benchmark allocation, and neutral means roughly in line with the benchmark.
