
Day Hagan Smart Sector® Fixed Income Strategy Update May 2026
A downloadable PDF copy of the Article:
Day Hagan Smart Sector® Fixed Income Strategy Update May 2026 (pdf)
Executive Summary
April was a challenging month for global fixed-income markets, with higher energy prices, persistent inflation, and waning hopes of quick central bank rate cuts. In the United States, the March Consumer Price Index (CPI) climbed 0.9% month over month and 3.3% year over year, with energy prices making the biggest impact—gasoline alone rose 21.2% in March. Core CPI, which excludes food and energy, was more subdued at 0.2% month-over-month and 2.6% year-over-year. Even so, the surge in energy costs kept inflation risks firmly in focus. Across Europe and emerging markets, similar inflation pressures added to the cautious mood in bond markets.
On April 29, the Federal Reserve reiterated its data-dependent approach by keeping the federal funds target range at 3.50%–3.75%. Policymakers stressed that any future changes would be guided by economic indicators and the evolving risk outlook. As a result, Treasury yields moved higher late in the month, with the 10-year yield rising to approximately 4.4% after the Fed meeting, up from around 4.3% earlier in April. Similar yield movements were observed in global developed markets, with German Bund yields reaching 2.5% and UK Gilts at 4.2%, reflecting shared concerns about inflation and monetary policy.
Fixed income helped dampen volatility in April, but returns were modest. The Bloomberg U.S. Aggregate Bond Index was nearly flat, down 0.05% for the month, and year-to-date performance stood at about 0.18% as of May 1. This subdued return profile highlights the importance of short-duration exposure; U.S. 1–3-month T-bills provided steady income with minimal interest-rate risk. Meanwhile, neutral stances in intermediate and long-term U.S. Treasuries reflect persistent uncertainty around inflation, central bank policy, and fiscal supply. Globally, bond indices in Europe and Asia also showed muted returns, as investors remained cautious amid inflation and geopolitical risks.
Credit markets outperformed other fixed income sectors in April. Risk appetite improved, and lower-quality credit saw gains from both carry and narrowing spreads; the Bloomberg U.S. Corporate High Yield Index rose 1.69%, and the J.P. Morgan Emerging Markets Bond Index returned 2.53%. High-yield spreads finished the month at 2.83%, historically tight levels that support overweight positions in U.S. high-yield and emerging-market bonds. Investment-grade corporates, international corporates, mortgage-backed securities (MBS), and short-term Treasury Inflation-Protected Securities (TIPS) continued to lag, as compensation for spread, currency, prepayment, or inflation risk appeared less attractive. In Europe, high-yield indices also performed well, with the ICE BofA Euro High Yield Index up 1.8% for the month, reflecting a broad-based improvement in global credit sentiment.
Holdings
Fixed Income Sector
US 1-3 Month T-bill
US 3-7 Year Treasury
US 10-20 Year Treasury
TIPS (short-term)
US Mortgage-Backed
US Floating Rate
US Corporate
US High Yield
International Corporate Bond
Emerging Market Bond
Outlook (relative to benchmark)
Overweight
Neutral
Neutral
Underweight
Underweight
Neutral
Underweight
Overweight
Underweight
Overweight
Position Details
U.S. Treasuries: May’s Composite update for long-term Treasuries showed that technical indicators were mixed: relative strength was negative, but momentum remained positive, suggesting the market is still finding its footing. The 10-year Treasury yield ended the month at about 4.42%.
Economic data made the picture more complex. First-quarter GDP came in at 2.0% annualized, a bit softer than the 2.3% consensus, which provided some support for Treasuries. On the other hand, manufacturing looked stronger, with the S&P Global U.S. Manufacturing PMI rising to 54.5 in April—the highest level since May 2022—suggesting parts of the economy are picking up speed.
One of the more encouraging signs for bonds was their performance relative to inflation expectations, which remained positive despite ongoing price pressures. In April, the 10-year breakeven inflation rate was 2.46%. Meanwhile, March CPI rose to 3.3%, with much of the increase driven by higher energy costs linked to tensions in the Middle East.
Federal Reserve policy continued to weigh on the market. The Federal Open Market Committee (FOMC) left rates unchanged at 3.5%–3.75% for the third consecutive meeting, with committee members showing a rare split and focusing more on inflation. Stock market trends were neutral, as strong tech earnings and investor appetite for risk kept demand for safe-haven assets in check. In credit markets, the U.S. 5-year CDS closed in April near 35 basis points, suggesting little change in perceived sovereign risk.
Figure 1: Relative momentum improving for Treasuries.
U.S. TIPS: U.S. TIPS struggled in April despite a clear inflation impulse. The signal set was broadly negative: relative strength was bearish versus RSI, mean reversion, moving-average cross, high-yield spreads, and inflation expectations. The one positive input came from commodity trends, where the sharp move in oil created a more supportive backdrop for inflation-linked assets.
The tension was that inflation protection became more valuable, but real yields still stayed high enough to weigh on TIPS prices. The 10-year real yield ended April at 1.94%, while the nominal 10-year Treasury yield finished at 4.42%, leaving the 10-year breakeven inflation rate at 2.48% on April 30.
April’s inflation story was driven mainly by energy. March CPI rose 3.3% year over year, up from 2.4%, with energy prices up 12.5%, gasoline up 18.9%, and fuel oil up 44.2%, tied to the war in Iran. Brent crude also jumped above $113 on April 30 as the conflict intensified.
Policy and credit conditions did not help. The Fed held rates at 3.5%–3.75% and delivered a notably split vote, while high-yield OAS ended April at 2.83%, signaling limited stress pricing. Overall, April favored inflation awareness, but not broad TIPS leadership.
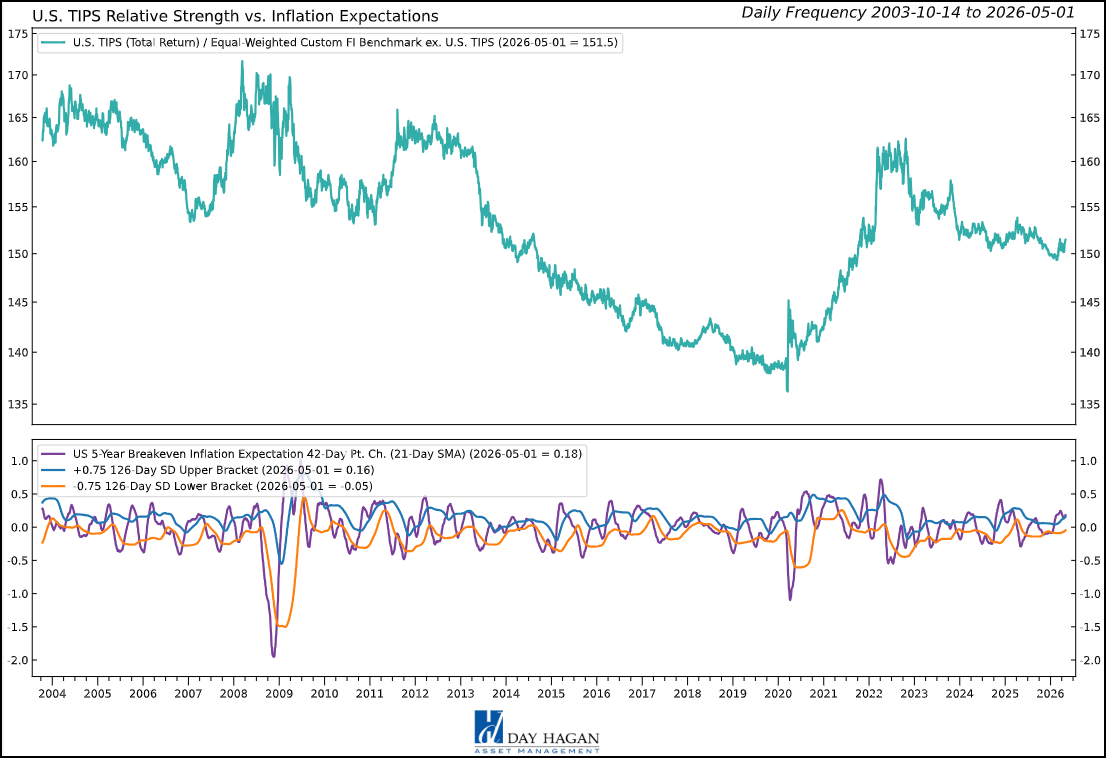
Figure 2: 5-year breakeven inflation expectations are potentially showing early signs of peaking.
U.S. Mortgage-Backed Securities (MBS): U.S. MBS had a choppy April, with the signal set leaning negative despite some support from rates. Relative strength improved versus the 10-year Treasury yield and the RSI, suggesting MBS found a short-term footing as rate volatility eased at times during the month. But the broader message was cautious: trend, relative-strength slope, credit spread, and inflation expectations signals were all bearish.
The key issue was that mortgage rates remained high enough to keep the housing and refinancing channels constrained. Freddie Mac’s 30-year fixed mortgage rate ended April at 6.30%, up from 6.23% the prior week, though still below 6.76% a year earlier. The 10-year Treasury yield finished April at 4.40%, keeping primary mortgage rates elevated and limiting the case for a strong MBS rally.
Inflation was another headwind. Trading Economics reported that U.S. CPI rose 3.3% year over year in March, driven mainly by energy costs tied to the Iran conflict, while the Fed held its policy range at 3.5%–3.75% in April and delivered an unusually divided vote.
Credit markets did not provide much help either. High-yield OAS ended April at 2.83%, signaling limited stress and reducing the safe-income appeal of agency MBS. Overall, April’s setup favored selectivity: MBS looked better versus Treasuries in the near term, but broader trend and macro signals remained unfavorable.
Figure 3: U.S. MBS approaching oversold levels (below 35).
U.S. Floating Rate Notes (FLRN): U.S. Floating Rate Notes ended April with a mixed performance. Support mainly came from the front of the yield curve: the Federal Reserve kept rates steady at 3.5%–3.75% for a third consecutive meeting, and the Secured Overnight Financing Rate (SOFR) finished the month at 3.66%. This made floating-rate income competitive compared to longer-term bonds, particularly since the 3-month Treasury bill closed in April at 3.59%.
Focusing on short-term rates proved beneficial, as investors continued to earn attractive yields without taking on the greater price swings of long-term Treasuries. This strategy worked well in a month marked by persistent inflation concerns and cautious messaging from the Fed. Notably, April’s Fed meeting was unusually divided—one governor supported a rate cut, while three others expressed concerns about signaling any future easing.
On the downside, momentum and other technical signals were less convincing. While floating rate notes continued to provide steady income, they didn’t stand out as market leaders. As investor confidence grew near the end of April, the VIX volatility index dropped sharply to 16.89, making ultra-short-duration assets like floating-rate notes less appealing as a defensive option.
In summary, April highlighted floating-rate notes as a reliable choice for generating income but not as a top momentum play. The case for earning yield remained strong, even though technical indicators offered mixed support.
Figure 4: Floating Rate Securities do not do well when equity volatility is moving higher from low levels. It can be interpreted as investors becoming more concerned about equity valuations. Currently, the VIX has declined sharply, which has historically been unfavorable for interest-rate hedges like FLRNs (non-Treasury). Note, FLRNs are often issued by lower-quality companies. (Note: Y-axis is inverted.)
U.S. Investment-Grade Corporate Bonds: U.S. investment-grade corporate bonds faced a challenging environment in April. Most technical indicators pointed down, including relative strength versus bond volatility, spreads, the U.S. dollar, trend, and price mean reversion. The one bright spot was credit default swaps, with sovereign risk improving a bit—U.S. 5-year CDS finished the month at 35.04 basis points.
Spreads stayed tight, with the ICE BofA U.S. Corporate Index option-adjusted spread at 0.81% by month’s end, which doesn’t leave much room if rates rise or market sentiment shifts. Bond volatility was notable, with the MOVE Index closing April at 74.33, jumping sharply on the last day as rate uncertainty returned.
Economic data was mixed—Q1 GDP rose 2.0% annualized, missing forecasts, while inflation picked up to 3.3% in March, driven by higher energy costs linked to tension in Iran. The Fed kept rates at 3.5%–3.75% in April, with a split vote that added to policy uncertainty.
The dollar also weighed on the market, ending April at 98.06 after dropping 0.91% on the last day of the month. Overall, investment-grade corporate bonds continued to provide income, but April signals suggested investors should be cautious rather than expect further spread tightening.
Figure 5: A peak in the U.S. dollar index might prompt global fixed-income investors to look elsewhere.
U.S. High Yield: U.S. high yield bonds performed well in April, though not every signal was positive. Trend indicators improved, with gains relative to technical benchmarks and moving averages, supported by small-cap equities and a lower VIX. This reflected a stronger appetite for risk and firmer price action compared to investment-grade bonds.
Economic data also lent support. First-quarter GDP rose at a 2.0% annualized rate—slightly below forecasts but still showing growth. Manufacturing was strong, with the S&P Global U.S. Manufacturing PMI climbing to 54.5, the highest since May 2022. Small-cap stocks joined the late-month rally, as the Russell 2000 gained 1.4% on April 30, and volatility dropped with the VIX closing the month at 16.89.
There were reasons for caution, though. High-yield spreads finished April at 2.83%, already tight, limiting the potential for further gains if risk appetite fades. Inflation added another headwind: March CPI rose to 3.3%, driven mainly by higher energy prices linked to unrest in the Middle East. The Federal Reserve kept rates steady at 3.5%–3.75% in April amid a divided policy committee, adding to the uncertainty.
All in all, April was favorable for high-yield bonds as investors sought riskier credit, but the combination of tight spreads and mixed signals suggests it’s wise to stay selective rather than assume the rally will continue unchecked.
Figure 6: High-yield bond breadth indicates potential signs of fatigue in the high-yield market.
International Investment-Grade Corporate Bonds: April was a tough month for these bonds. Most technical indicators—including relative strength, moving averages, credit spreads, and credit default swaps—signaled a lack of momentum. These bonds lagged behind riskier assets, and there was little sign of improving performance or leadership.
Part of the challenge was the weaker demand for defensive assets. With equity volatility dropping—the VIX ended April at 16.89—investors showed less interest in high-grade global corporate bonds. Meanwhile, global corporate spreads were already tight, leaving little cushion for those worried about geopolitical risks or rate swings.
Europe was at the core of this story. Euro area GDP growth was barely positive at 0.1% in the first quarter, while April’s manufacturing PMI improved to 52.2, showing some strength in activity despite sluggish growth overall. Central banks stayed cautious; the Bank of England voted 8–1 to keep its rate at 3.75%, highlighting ongoing concerns about the Middle East and energy prices.
Currency movements added to the mix. The U.S. Dollar Index dropped sharply at the end of April, closing at 98.06. This gave a slight boost to some non-dollar bond returns but also pointed to shifting capital flows around the world. Overall, international investment-grade corporates still offered steady income, but the signals suggested that investors should take a cautious, patient approach rather than expect outperformance.
Figure 7: Credit Default Swaps inching higher—historically negative for international bonds.
Emerging Market Bonds: Emerging-market dollar-denominated bonds stood out in April, with most technical signals pointing higher. Strength in EM currencies, positive equity momentum, firm commodity prices, and clear upward trends all contributed to a favorable setup. The combination of increased investor demand, rising commodity values, and a weaker dollar created a supportive market backdrop.
Currency moves played a big role. The U.S. Dollar Index fell to 98.06 by the end of April, easing some of the pressure on emerging market assets and boosting dollar-denominated EM bonds. Commodities also provided a tailwind: Brent crude finished near $108 per barrel, and gold prices held above $4,600 an ounce, both notably higher than a year ago.
Income was another bright spot. The iShares J.P. Morgan USD Emerging Markets Bond ETF closed April with a net asset value of $95.64 and a 30-day SEC yield of 5.74%, showing the attractive income potential in this segment.
The main challenge remained U.S. interest rates, with the 10-year Treasury yield ending in April at 4.42%, keeping global borrowing costs relatively high. Still, most indicators were in sync: EM dollar bonds gained on strong carry, higher commodity prices, a weaker dollar, and positive trends across related assets.
Figure 8: U.S. dollar weakness is positive for international financial asset demand.
Catastrophic Stop Model
The Catastrophic Stop model combines time-tested, objective indicators to identify high-risk periods for equities and fixed-income assets that are highly correlated with the equity market. The model entered May recommending a fully invested allocation relative to the benchmark for credit sectors with high correlations to equities.
The weight of the evidence suggests that any equity weakness is unlikely to extend to a significant downtrend at this time. Of course, if our model triggers a sell signal (below 40% for two consecutive days), indicating more substantial problems, we will reduce exposure.
Figure 9: The Catastrophic Stop model recommends a fully invested position (relative to the benchmark). Because the model uses indices to extend its history, it is considered hypothetical.
Hypothetical and historical past performance is not indicative of future results. There can be no assurance that any investment or strategy will achieve its objectives or avoid substantial losses or have comparable results. This information is provided for illustrative purposes only and is not a prediction, projection, or guarantee of future performance. Hypothetical results do not reflect actual trading, were derived using the benefit of hindsight, and may not reflect material economic and market events. Actual results vary and depend on many factors and subject to risk and uncertainties.
This chart compares the S&P 500 with the Day Hagan Daily Market Sentiment Composite. The current composite reading is 89.43, well above the +70 upper bracket, indicating elevated or optimistic sentiment. Historically, readings above this level often suggest a strong risk appetite and a positive market tone, but they can also indicate the market is becoming stretched in the short term. This is not necessarily bearish by itself; rather, it suggests investors are already leaning bullish, so near-term upside may be more vulnerable to consolidation, volatility, or disappointment. The way we incorporate these types of models into our outlook is to "Go with the flow until it reaches an extreme and reverses." We're still going with the flow, but headwinds are building.
Figure 10: A sell signal would occur if the Composite falls back below 70, suggesting investors may be shifting toward a more pessimistic view of the market.
Our goal is to stay on the right side of the prevailing trend and introduce risk management when conditions deteriorate. Currently, the uptrend remains intact. The broader-based composite models calling U.S. economic growth, international economic growth, inflation trends, liquidity, and equity demand remain broadly constructive. The Catastrophic Stop model is positive, and we are aligned with the message. If our models shift to bearish levels, we will raise cash and lower exposure to risk-on fixed-income sectors.
This strategy uses measures of price, valuation, economic trends, liquidity, and market sentiment to make objective, rational, and unemotional decisions about how much capital to risk and where to allocate it.
For more information, please contact us at:
Day Hagan Asset Management
1000 S. Tamiami Trl
Sarasota, FL 34236
Toll Free: (800) 594-7930
Office Phone: (941) 330-1702
Website: https://dayhagan.com or https://dhfunds.com
© 2026 Day Hagan Asset Management
This material is for educational purposes only. Further distribution is prohibited without prior permission. Please see the information on Disclosures and Fact Sheets here: https://dhfunds.com/literature. Charts with models and return information use indices for performance testing to extend the model histories, and they should be considered hypothetical. All Rights Reserved. (© Copyright 2026 Day Hagan Asset Management.)
Day Hagan Smart Sector® Fixed Income ETF
Symbol: SSFI
Disclosures
The data and analysis contained within are provided “as is” and without warranty of any kind, either express or implied. The information is based on data believed to be reliable, but it is not guaranteed. Day Hagan DISCLAIMS ANY AND ALL EXPRESS OR IMPLIED WARRANTIES, INCLUDING, BUT NOT LIMITED TO, ANY WARRANTIES OF MERCHANTABILITY, SUITABILITY, OR FITNESS FOR A PARTICULAR PURPOSE OR USE. All performance measures do not reflect tax consequences, execution, commissions, and other trading costs, and as such, investors should consult their tax advisors before making investment decisions, as well as realize that the past performance and results of the model are not a guarantee of future results. The Smart Sector® Strategy is not intended to be the primary basis for investment decisions, and the usage of the model does not address the suitability of any particular investment for any particular investor.
Using any graph, chart, formula, model, or other device to assist in deciding which securities to trade or when to trade them presents many difficulties, and their effectiveness has significant limitations, including that prior patterns may not repeat themselves continuously or on any particular occasion. In addition, market participants using such devices can impact the market in a way that changes the effectiveness of such devices. Day Hagan believes no individual graph, chart, formula, model, or other device should be used as the sole basis for any investment decision and suggests that all market participants consider differing viewpoints and use a weight-of-the-evidence approach that fits their investment needs.
Past performance does not guarantee future results. No current or prospective client should assume future performance of any specific investment or strategy will be profitable or equal to past performance levels. All investment strategies have the potential for profit or loss. Changes in investment strategies, contributions or withdrawals, and economic conditions may materially alter the performance of your portfolio. Different types of investments involve varying degrees of risk, and there can be no assurance that any specific investment or strategy will be suitable or profitable for a client’s portfolio. Historical performance results for investment indexes and/or categories generally do not reflect the deduction of transaction and/or custodial charges or the deduction of an investment management fee, the incurrence of which would have the effect of decreasing historical performance results. There can be no assurances that a portfolio will match or outperform any particular benchmark. Comparisons to indices are inherently unreliable indicators of future performance. The strategies used to generate the performance vary from those used to generate the returns depicted in the benchmarks. Investors cannot directly invest in an index.
The information contained herein is provided for informational purposes only and should not be construed as investment advice or a recommendation to buy or sell any security. The securities, instruments, or strategies described may not be suitable for all investors, and their value and income may fluctuate. Past performance is not indicative of future results, and there is no guarantee that any investment strategy will achieve its objectives, generate profits, or avoid losses.
This material is intended to provide general market commentary and should not be relied upon as individualized investment advice. Investors should consult with their financial professional before making any investment decisions based on this information.
The material may contain “forward-looking” information that is not purely historical in nature. Such information may include, among other things, projections, forecasts, estimates of market returns, and proposed or expected portfolio composition. Day Hagan Asset Management, its affiliates, employees, or third-party data providers shall not be liable for any loss sustained by any person relying on this information. All opinions and views expressed are subject to change without notice and may differ from those of other investment professionals within Day Hagan Asset Management or Ashton Thomas Private Wealth, LLC.
Accounts managed by Day Hagan Asset Management or its affiliates may hold positions in the securities discussed and may trade such securities without notice.
Day Hagan Asset Management is a division of and doing business as (DBA) Ashton Thomas Private Wealth, LLC, an SEC-registered investment adviser. Registration with the SEC does not imply a certain level of skill or training.
This material is for educational purposes only. Further distribution is prohibited without prior permission. Please see the information on Disclosures and Fact Sheets here: https://dhfunds.com/literature. Charts with models and return information use indices for performance testing to extend the model histories, and they should be considered hypothetical. All Rights Reserved.
All hypothetical results are presented for illustrative purposes only. Back testing and other statistical analysis is provided in use simulated analysis and hypothetical circumstances to estimate how it may have performed prior to its actual existence. The results obtained from "back-testing" information should not be considered indicative of the actual results that might be obtained from an investment or participation in a financial instrument or transaction referencing the Index. The Firm provides no assurance or guarantee that the products/securities linked to the strategy will operate or would have operated in the past in a manner consistent with these materials. The hypothetical historical levels have inherent limitations. Alternative simulations, techniques, modeling or assumptions might produce significantly different results and prove to be more appropriate. Actual results will vary, perhaps materially, from the simulated returns presented.
© 2026 Day Hagan Asset Management
Disclosure
Federal Reserve (Fed) — The central bank of the United States, responsible for setting monetary policy and short-term interest rates.
U.S. Treasuries — Bonds issued by the U.S. government; they are widely used as benchmarks for interest rates and as defensive assets in portfolios.
T-bill (Treasury bill) — A short-term U.S. government security, typically maturing in one year or less.
Duration — A measure of a bond’s sensitivity to changes in interest rates; higher duration usually means greater price movement when yields change.
Yield — The income return on a bond, usually expressed as an annual percentage of its price.
Investment-Grade (IG) Corporate Bonds — Corporate bonds with relatively high credit quality and lower default risk than high-yield bonds.
High-Yield (HY) Bonds — Lower-rated corporate bonds that offer higher yields because they carry higher credit risk.
Private Credit — Non-bank lending, often directly to companies, outside the public bond markets.
TIPS (Treasury Inflation-Protected Securities) — U.S. government bonds designed to protect investors from inflation by adjusting principal based on inflation.
Breakeven Inflation Rate — The market’s implied inflation expectation, calculated as the difference between nominal Treasury yields and TIPS yields.
Real Yield — A bond yield after adjusting for inflation; often referenced in connection with TIPS.
Nominal Yield — A bond yield not adjusted for inflation.
Inflation Expectations — The market’s view of future inflation, which influences both bond yields and asset prices.
Mortgage-Backed Securities (MBS) — Bonds backed by pools of home mortgages; investors receive cash flows from underlying mortgage payments.
Agency MBS — Mortgage-backed securities issued or guaranteed by U.S. government-related agencies, generally viewed as having high credit quality.
Floating Rate Notes (FRNs) — Bonds whose interest payments reset periodically based on a short-term reference rate, reducing interest-rate sensitivity.
SOFR (Secured Overnight Financing Rate) — A key U.S. benchmark short-term interest rate used in loans, derivatives, and floating-rate instruments.
OIS (Overnight Index Swap) Rate — A rate derived from swaps tied to overnight interest rates, often used to gauge policy-rate expectations.
Primary Issuance — The sale of new bonds into the market by governments or companies.
Spread — The yield difference between one bond and a benchmark, often used to measure compensation for credit risk.
Option-Adjusted Spread (OAS) — A spread measure that adjusts for embedded bond options, commonly used in corporate bonds and mortgage-backed securities.
Credit Default Swap (CDS) — A derivative contract used to insure against bond default risk; rising CDS levels often signal greater credit concern.
Carry — The return earned from holding a bond or credit asset, assuming market conditions remain stable.
Refinancing Risk — The risk that a borrower will face higher costs or difficulty when replacing maturing debt with new debt.
Emerging Market (EM) Bonds — Debt issued by governments or companies in developing economies.
Hard-Currency Debt — Emerging-market debt issued in a major foreign currency, usually U.S. dollars or euros.
Local-Currency Debt — Emerging-market debt issued in the borrower’s domestic currency, making returns more sensitive to exchange-rate movements.
Risk-On / Risk-Off — Market environments where investors are either more willing to buy riskier assets (“risk-on”) or prefer safer assets (“risk-off”).
RSI (Relative Strength Index) — A technical indicator used to assess whether an asset may be overbought or oversold.
VIX — A widely followed measure of U.S. equity market volatility, often called the market’s “fear gauge.”
