
Day Hagan Smart Sector® International Strategy Update March 2026
A downloadable PDF copy of the Article:
Day Hagan Smart Sector® International Strategy Update March 2026 (pdf)
Executive Summary
International equities in February responded to uneven G20 growth data, steady but moderating inflation, and stable global rate expectations. Flash PMIs released during the month showed services activity continuing to anchor expansion across much of the developed world. The euro area composite index remained slightly above 50, driven by services, while manufacturing stayed weak. The U.K. composite PMI held in the low-50s, indicating ongoing but moderate expansion. Japan’s services sector expanded, though manufacturing momentum softened.
Across emerging markets, growth differentials remained a defining feature. India’s composite PMI stayed firmly in expansion territory, reinforcing its relative growth leadership. Several ASEAN economies also reported mid-50s PMI readings, while parts of Latin America showed signs of stabilization after a prior slowdown. China’s manufacturing readings remained subdued, tempering broader EM sentiment.
Inflation data released in February showed continued disinflation in Europe, with euro area CPI trending below 2% year over year. U.K. inflation moderated but remained above target. Japan’s core inflation hovered near 2%, keeping Bank of Japan normalization expectations intact. In emerging markets, inflation prints were mixed but generally well below prior cycle peaks, allowing some central banks to maintain a neutral bias.
Currency markets were largely range-bound. The U.S. dollar index held firm during February, supported by rate differentials and relative U.S. growth strength. This limited broad-based EM currency appreciation, though commodity-linked currencies found support from steady metals pricing.
Global sovereign yields were stable overall. European yields drifted modestly lower as inflation eased, while Japanese government bond yields remained elevated relative to 2024/early-2025 levels. Corporate earnings updates across Europe were mixed but stable, while several emerging markets maintained constructive forward guidance. Overall, February reflected steady but differentiated global growth rather than a decisive macro shift.
Holdings
Core: Developed Market Positions (approximately 65% of equity holdings)
Country
Australia
Canada
China
France
Germany
Japan
Switzerland
United Kingdom
Outlook
Neutral
Overweight
Overweight
Underweight
Neutral
Overweight
Overweight
Underweight
Explore: Emerging Market Positions (approximately 35% of equity holdings)
Chile
India
Malaysia
Spain
Italy
Position Details
Core: Developed Market Commentary
Approximately 65% of the strategy is allocated across eight of the largest markets in the ACWI ex-U.S. Index. The fund overweights and underweights the largest non-U.S. equity markets based on macro, fundamental, behavioral, and technical indicators.
Australia: Australia's relative strength reflects a split backdrop. On the positive side, the Absolute Moving Average Cross is bullish, indicating a constructive longer-term trend. Beta relative to ACWI is also favorable, suggesting Australia is positioned to participate in broader equity advances. In addition, Relative Earnings Yield is supportive, indicating a reasonable valuation relative to global peers. Bear market bounce metrics are neutral, signaling no extreme oversold or rebound conditions. On the negative side, the Adaptive Moving Average signal is bearish, indicating a softer near-term trend. The Australia–U.S. interest rate differential is also unfavorable, limiting policy-driven support. Relative performance versus gold is negative, suggesting that commodities are competing for capital. Finally, the ACWI Technical Scorecard is bearish, reflecting weaker confirmation from global equity trends.
Commentary: Australia’s equity market was driven by a mix of strong earnings, persistent inflation, and macroeconomic signals. Domestic equities outperformed modestly, with the ASX 200 posting one of its best monthly gains and reaching consecutive record highs, supported by robust earnings reports from mining, banking, energy, and healthcare sectors. Materials and major resources names like BHP and Rio Tinto hit new highs, and dividend increases and buybacks bolstered sentiment during the reporting season, marking a return to profit growth for many companies. On the macro front, inflation remained stubbornly above target, with headline CPI at about 3.8% and the trimmed mean also elevated, increasing speculation of further Reserve Bank of Australia (RBA) tightening. This pushed yields higher and strengthened the Australian dollar amid rising rate expectations. Consumer confidence softened, and commodity price volatility, especially in energy, introduced risk. Together, these factors created a backdrop of strong corporate performance offset by inflation and monetary policy concerns.
Figure 1: Australia’s relative earnings yield is supportive.
Canada: Canada's relative strength is supported by several trend indicators. The Triple Moving Average Diffusion Index and Absolute Moving Average Cross are both bullish, indicating broad-based upside participation and positive longer-term alignment. Mean reversion is also favorable, suggesting leadership is not extended. In addition, performance relative to the CAD-USD exchange rate is supportive, suggesting that currency trends are not a headwind. On the negative side, global confirmation is lacking. The ACWI Technical Scorecard is bearish, reflecting weaker alignment with broader international trends. OECD Composite Leading Indicators are also negative, pointing to softer forward growth signals. Relative Earnings Yield is unfavorable, suggesting that valuation support is less compelling than that of global peers. Overall, the internal price structure is constructive, but macro and cross-market inputs temper the outlook.
Commentary: Canada’s equity market was impacted by strong sector performance, mixed macro data, and ongoing global uncertainties. On the positive side, the S&P/TSX Composite Index reached multiple record highs, driven by elevated energy and materials prices and strong bank earnings. Resource and materials stocks benefited from higher commodity prices, while major banks beat earnings expectations, supported by diversified fee income and solid balance sheets. Industrial and energy names also contributed to gains as investors rotated into traditional sectors. On the negative side, underlying economic data pointed to challenges. Q4 2025 GDP contracted at an annualized rate of -0.6%, marking the slowest annual growth since 2020, and January GDP stalled with no month-over-month expansion. Inflation was modest at about 2.3%, easing but still affecting cost dynamics. Technology and consumer discretionary sectors lagged late in the month, and ongoing tariff-related trade risks added to the backdrop of caution.
Figure 2: Canadian dollar showing modest strength versus the U.S. dollar.
China: China's relative strength shows limited areas of support amid broader weakness. On the positive side, performance relative to the Emerging Markets currency basket is bullish, indicating that currency dynamics are not detracting from relative returns. Mean reversion and bear market bounce measures are neutral, suggesting the market is neither deeply oversold nor benefiting from a sharp rebound phase. On the negative side, momentum and trend signals are unfavorable. Relative Price Momentum and the Absolute Moving Average Cross are bearish, pointing to persistent underperformance and weak technical structure. PMI-linked performance is also negative, reflecting soft underlying economic momentum. In addition, high-yield credit spreads are bearish, signaling tighter financial conditions and elevated credit risk. Overall, technical and macro inputs remain challenged despite stable currency support.
Commentary: China’s equity market is supported by a mix of macro stabilization and policy-driven activity, though underlying growth signals remain uneven. Recent official data show GDP growth moderating but still around its target level, indicating the economy continues expanding despite weaker domestic demand and a prolonged property slump. Service activity data point to expansion in the services sector, with improving hiring and new orders, while the official manufacturing PMI recently slipped just below the expansion threshold, reflecting divergent sector conditions. Inflation remains subdued, allowing the People’s Bank of China (PBOC) to maintain accommodative settings. Authorities have resumed government bond purchases and maintained liquidity operations to support financial conditions. The yuan has strengthened moderately, but the PBOC is managing the currency to balance export competitiveness with stability. Technical conditions for Chinese equities have shown resilience amid policy support and export momentum, with major indexes holding key trend levels. Geopolitical factors, including trade tensions and export dependencies, continue to influence market sentiment, and plans to issue special bonds to recapitalize insurers aim to reduce financial sector stress and support broader market confidence.
Figure 3: Negative momentum.
France: France's relative strength presents limited areas of support within a broadly cautious backdrop. On the positive side, the 200-Day Moving Average Breadth is bullish, indicating improving participation beneath the surface. OECD Composite Leading Indicators and Relative ETF Fund Flows are neutral, suggesting macro momentum and investor positioning are not exerting strong directional pressure. On the negative side, trend and valuation signals weigh on the outlook. The Moving Average Cross and Cross-Sectional 50-Day Price Momentum are bearish, pointing to weak short- and intermediate-term leadership. The ACWI Technical Scorecard also reflects limited global confirmation. Relative Dividend Yield and the ACWI Valuation Scorecard are unfavorable, indicating less compelling income and valuation support versus peers. Overall, internal breadth offers some stability, but broader technical and valuation inputs remain challenged.
Commentary: On the positive side, the CAC 40 posted modest gains and set fresh records mid-month as defense, aerospace, and financial stocks outperformed, and broader European sentiment lifted risk assets. Manufacturing activity stayed near expansion, and corporate earnings from key names provided tactical support. There were also pockets of outperformance among luxury and cyclical stocks as global equities showed tentative strength. On the negative side, the underlying economic data limited upside. Composite and services PMIs remained below growth thresholds, indicating weak private-sector momentum, and French inflation unexpectedly rose in late February, adding uncertainty around consumer demand and ECB policy. The index also showed volatility at times, with pullbacks alongside ECB announcements that failed to provide fresh policy support. Geopolitical and export headwinds continued to temper confidence, keeping performance gains measured rather than broad-based.
Figure 4: International regions continue to attract fund flows.
Germany: Germany's relative strength shows selective internal support alongside notable external headwinds. On the positive side, 200-Day Moving Average Breadth is bullish, indicating improving participation beneath the surface and a firmer long-term foundation. Relative Dividend Yield is also favorable, suggesting income support versus global peers. Bear market bounce measures and Relative ETF Fund Flows are neutral, signaling balanced positioning without extreme oversold conditions or strong capital surges. On the negative side, several cyclical and cross-market signals weigh on the outlook. The ACWI Technical Scorecard and Relative Moving Average Cross are bearish, indicating weak global confirmation and a softer trend alignment. Manufacturing Confidence is negative, reflecting industrial uncertainty. In addition, performance versus the EUR-USD exchange rate is unfavorable, indicating that currency dynamics do not provide support. Overall, breadth and yield help, but macro and trend inputs remain challenged.
Commentary: In February, Germany’s equity market moved amid mixed macroeconomic signals and evolving sentiment. On the positive side, PMI data pointed to expanding private-sector activity, with the Composite PMI rising to 53.1, supported by manufacturing above 50 and stronger services output, suggesting renewed economic momentum. This helped lift the DAX at points during the month and accompanied modest overall gains for the index, which were up around 1.9% month-over-month. Manufacturing expansion also marked the first growth in that sector since 2022. Inflation data showed consumer prices slowing to about 1.9%, easing pressure on real incomes and aligning closely with ECB targets. On the negative side, the labor market remained sluggish, with unemployment unchanged near 6.3% and jobless levels still elevated. Consumer sentiment deteriorated unexpectedly, signaling weaker household demand. And although broad sentiment improved at the business climate level, confidence remained subdued. Currency effects from a stronger euro and external geopolitical risks continued to temper enthusiasm.
Figure 5: German manufacturing confidence continues to roll over.
Japan: Japan's relative strength reflects broad-based technical and fundamental support. Absolute and Relative Moving Average Cross signals are bullish, indicating strong alignment with the trend both domestically and versus global peers. The ACWI Technical Scorecard also confirms favorable global positioning. Valuation metrics are supportive, with the ACWI Valuation Scorecard pointing to attractive relative pricing. Forward earnings growth trends are constructive, reinforcing fundamental momentum. Sentiment reversal measures remain positive, suggesting positioning is not stretched. In addition, performance relative to the USD/JPY exchange rate is supportive, indicating that currency dynamics are aligned with equity leadership. On the negative side, exposure to China-linked growth remains a headwind. Performance versus China PMI is bearish, highlighting sensitivity to softer external demand. Overall, internal trend, valuation, and earnings signals are strong, offset by regional macro risk.
Commentary: Japan’s equity market responded to strong activity data and contrasting inflation and currency dynamics. On the positive side, Japan’s S&P Global Composite PMI climbed to 53.8, the highest since mid-2023, driven by expanding manufacturing and services output and robust new export orders, supporting broad economic momentum. Nikkei 225 rose roughly 10% for the month, marking one of the strongest February performances on record and reaching nearly all-time highs, bolstered by foreign investment inflows and solid corporate earnings. Export-oriented sectors, particularly technology and autos, featured prominently in gains. On the negative side, inflation trends and currency pressures influence sentiment. Consumer inflation eased to around 1.5%, below earlier expectations, while core price measures softened, complicating the Bank of Japan's outlook for tightening. The Japanese yen remained weak versus the dollar, dampening local purchasing power and contributing to volatility in import-dependent sectors. Additionally, softer GDP data in late 2025 weighed on near-term growth perceptions, tempering some equity upside.
Figure 6: Earnings growth expectations continue to increase.
Switzerland: Switzerland's relative strength presents a constructive internal backdrop with selective external pressures. On the positive side, the 200-Day Moving Average Breadth is bullish, indicating improving participation across constituents. Cross-Sectional 50-Day Price Momentum is also favorable, indicating near-term market leadership. The Moving Average Slope of relative strength confirms the persistence of an upward trend. Relative ETF Fund Flows are neutral, suggesting stable positioning without strong capital rotation. On the negative side, the Moving Average Cross is bearish, signaling weaker longer-term trend alignment. Relative Dividend Yield is unfavorable, indicating less compelling income support versus peers. In addition, Relative Nominal 10-Year Yield trends are negative, implying interest rate dynamics are not providing tailwinds. Overall, breadth and momentum are supportive, but yield and rate-related factors temper the relative outlook.
Commentary: Switzerland’s equity market reflected a generally positive price environment amid subdued domestic inflation and improving business confidence. The Swiss Market Index (CH20) climbed, hitting near all-time highs around 14,014 late in the month and extending gains across key large caps, including Roche, Novartis, and Nestlé. Business confidence rose to over 104, suggesting firms were more upbeat about near-term prospects. Strength in corporate earnings and export sectors also supported broader sentiment. On the negative side, inflation remained extremely low — around 0.1% — keeping the Swiss National Bank in a challenging position with a 0% policy rate and limited room to stimulate further. This environment sapped the yield appeal for investors and pressured financial-sector performance. Ongoing tariff and trade negotiations with the U.S. added uncertainty for export-oriented companies, while unemployment ticked slightly higher. Overall, strong relative equity gains coexisted with low inflation and policy constraints that tempered momentum.
Figure 7: Last month, we wrote that relative momentum was picking up for Swiss equities. This month, it appears to be the opposite, with momentum potentially at a peak.
United Kingdom: The U.K.’s relative strength shows constructive internal price action alongside notable cross-asset headwinds. On the positive side, the Moving Average Cross is bullish, signaling improving trend alignment. Cross-Sectional Price Momentum is also favorable, indicating broad participation and near-term leadership within the market. On the negative side, several external factors weigh on the outlook. Performance relative to the GBP-USD exchange rate is bearish, suggesting that currency dynamics are not supportive. The ACWI Valuation Scorecard is unfavorable, pointing to less compelling relative pricing. DSI sentiment is negative, indicating positioning may be stretched. In addition, U.K. option-adjusted spreads are bearish, reflecting tighter credit conditions and elevated risk premiums. Overall, price momentum is constructive, but valuation, sentiment, currency, and credit inputs introduce meaningful constraints.
Commentary: In February, the U.K. equity market was shaped by strengthening business activity and ongoing economic uncertainties. On the positive side, the S&P Global Composite PMI rose to 53.9, the highest in nearly two years, driven by expanding manufacturing and sustained services growth, signaling healthier private-sector momentum. The FTSE 100 climbed for the month and hit multiple record highs, supported by strong performances in mining, defense, and large caps like Rolls-Royce and LSEG, amid growing expectations of a Bank of England rate cut. Consumer-oriented equities also showed pockets of strength alongside robust export orders. On the negative side, macro data remained uneven. GDP growth was sluggish at just 0.1%, and unemployment rose toward multi-year highs, dampening prospects for household spending. Consumer confidence slipped despite easing inflation, while employment trends weakened across sectors. Sterling weakness reflected rate-cut bets but also tempered returns for foreign investors.
Figure 8: U.K. OAS spreads have increased, indicating caution building. While not at alarming levels, we’re watching these developments closely.
Emerging Market Positions
Approximately 30% of the strategy is allocated across five markets from a pool of more than 20 smaller markets. Selection is based on a multifactor technical ranking system that uses trend and mean-reversion indicators. The process seeks to identify oversold opportunities within the global equity markets that are likely to mean-revert from lower levels and exhibit mild pullbacks from long-term uptrends.
Current Holdings:
Chile
India
Malaysia
Spain
Italy
Explore: Emerging Market Commentary
Chile
Chile’s equity market was supported by constructive commodity dynamics and improving external balances. Copper prices remained firm during the month, underpinning mining earnings and fiscal revenues, while the IPSA index advanced as investors rotated into materials and utilities. Inflation continued to trend lower on a year-over-year basis, reinforcing expectations that monetary conditions could gradually normalize later in 2026. Bond yields were stable, and the peso traded in a contained range, supporting foreign participation. On the softer side, labor market data showed only gradual improvement, and domestic consumption indicators remained mixed. However, export strength and disciplined fiscal management helped offset internal demand concerns, leaving February characterized by commodity-led equity gains and improving macro stability.
India
India’s equity market extended its leadership in February, supported by strong activity data and steady policy signals. Composite PMI readings remained firmly in expansion territory, highlighting robust momentum in services and manufacturing. Corporate earnings updates were broadly constructive, with financial, industrial, and technology names contributing to index strength. Inflation remained within the central bank’s tolerance band, allowing policymakers to maintain a stable rate stance. Government bond auctions were well absorbed, reinforcing confidence in domestic liquidity conditions. On the cautionary side, global risk sentiment and commodity price volatility introduced periodic swings, and valuations in select growth sectors remained elevated. Nonetheless, sustained domestic demand, improving credit growth, and steady foreign inflows anchored February’s constructive equity performance.
Malaysia
Malaysia’s equity market posted steady gains in February, supported by stable macro conditions and improving regional trade flows. Inflation remained contained near recent lows, and Bank Negara Malaysia maintained a predictable policy stance, reinforcing rate stability. Manufacturing activity was near expansion levels, while export data showed gradual improvement, benefiting energy and palm oil producers. The FTSE Bursa Malaysia index advanced as banks delivered solid earnings and infrastructure-linked names attracted renewed interest. On the softer side, the ringgit experienced mild volatility against the U.S. dollar, and foreign fund flows were uneven. Technology-related stocks lagged broader benchmarks amid global sector rotation. Even so, stable prices, supportive commodities, and consistent domestic liquidity underpinned a constructive February backdrop.
Spain
Spain’s stock market strengthened in February as service-sector momentum and improving fiscal dynamics supported risk appetite. Composite PMI readings remained above 50, driven by tourism and services, reinforcing growth expectations. The IBEX benefited from strong performance in banks and travel-related companies, while sovereign bond spreads narrowed modestly against German bunds. Inflation moderated during the month, easing pressure on consumers and supporting real income trends. On the negative side, unemployment remained elevated relative to the euro area average, and manufacturing activity was mixed. External demand conditions across parts of Europe introduced some caution. Nevertheless, stable rates, firm domestic services activity, and solid corporate earnings helped maintain positive equity momentum through February.
Italy
Italy’s equity market advanced in February, supported by firm bank earnings and improving credit conditions. The FTSE MIB benefited from strength in financials and selected industrial exporters, while sovereign spreads narrowed modestly as fiscal projections stabilized. Inflation remained moderate, and fixed income markets were orderly, helping sustain investor confidence. PMI readings indicated stabilization in services activity, and export-oriented companies saw support from steady global demand. On the softer side, manufacturing surveys were uneven, and retail sales growth was modest. Political developments remained a background consideration for investors. Even so, improved balance sheets in the banking sector, contained inflation, and steady bond markets helped deliver a constructive tone for Italian equities during the month.
Catastrophic Stop Model
The Catastrophic Stop model combines time-tested, objective indicators designed to identify high-risk periods for the equity market. The model entered March recommending a fully invested equity allocation relative to the benchmark.
The weight of the evidence suggests that any weakness is unlikely to extend into a significant downtrend at this time. Of course, if our model triggers a sell signal (below 40% for two consecutive days), indicating more substantial problems, we will raise cash immediately.
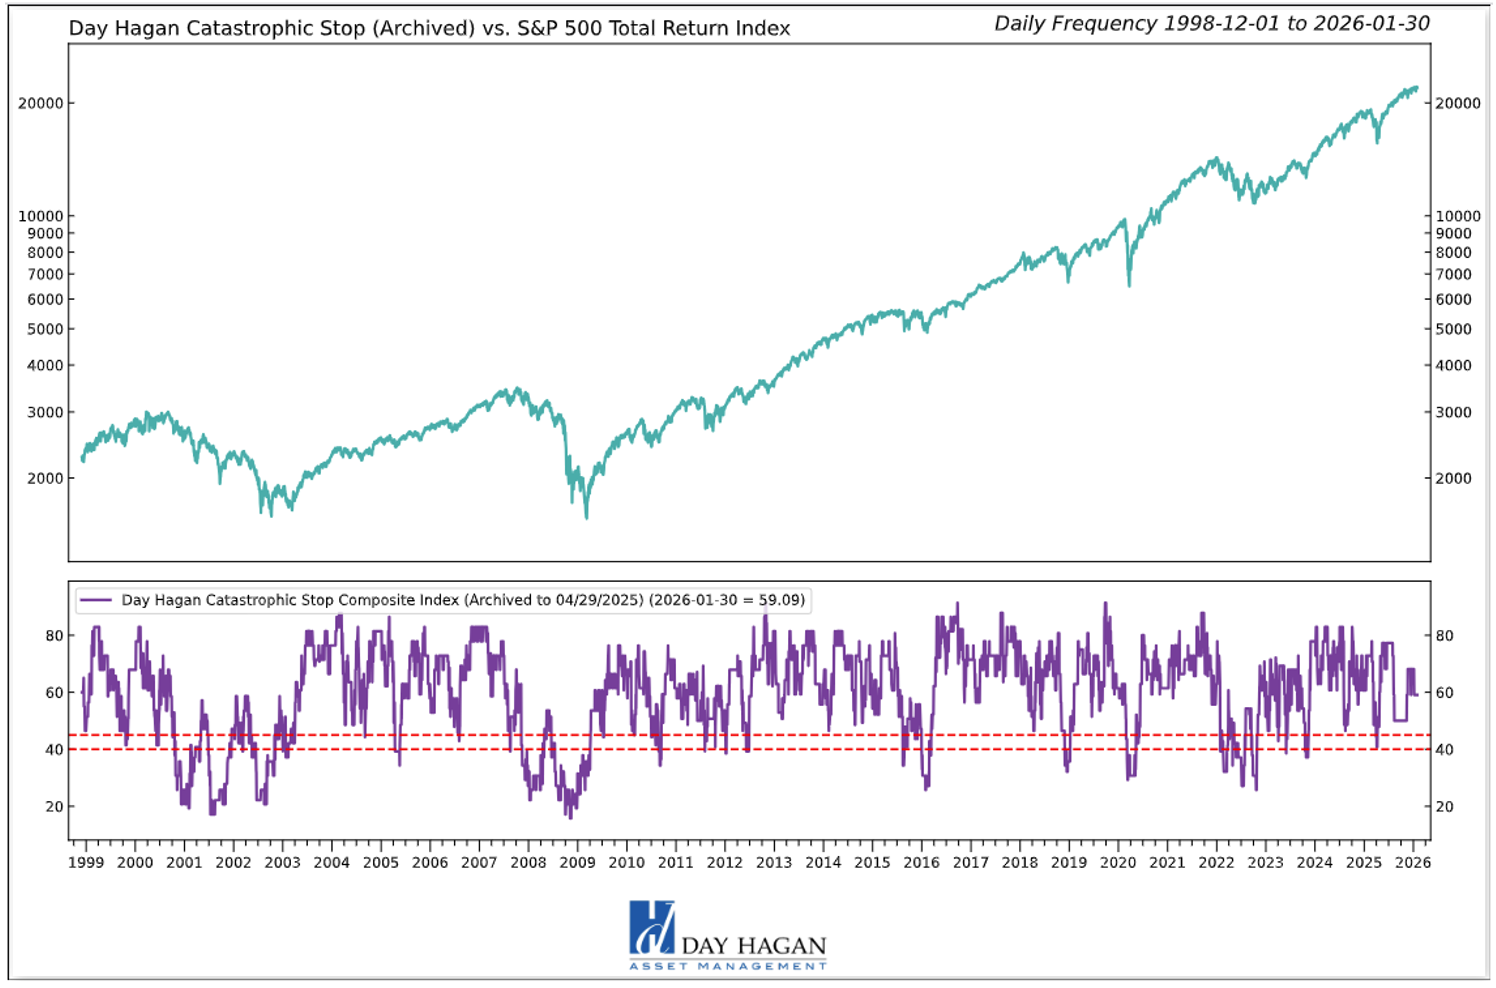
Figure 9: The Catastrophic Stop model recommends a fully invested equity position (relative to the benchmark). Because the model uses indices to extend its history, it is considered hypothetical.
Hypothetical and historical past performance is not indicative of future results. There can be no assurance that any investment or strategy will achieve its objectives or avoid substantial losses or have comparable results. This information is provided for illustrative purposes only and is not a prediction, projection or guarantee of future performance. Hypothetical results do not reflect actual trading, were derived using the benefit of hindsight, and may not reflect material economic and market events. Actual results vary and depend on many factors and subject to risk and uncertainties.
The Day Hagan Daily Market Sentiment Composite (part of the Catastrophic Stop Model) is neutral, indicating investors are neither overly bullish nor overly bearish.
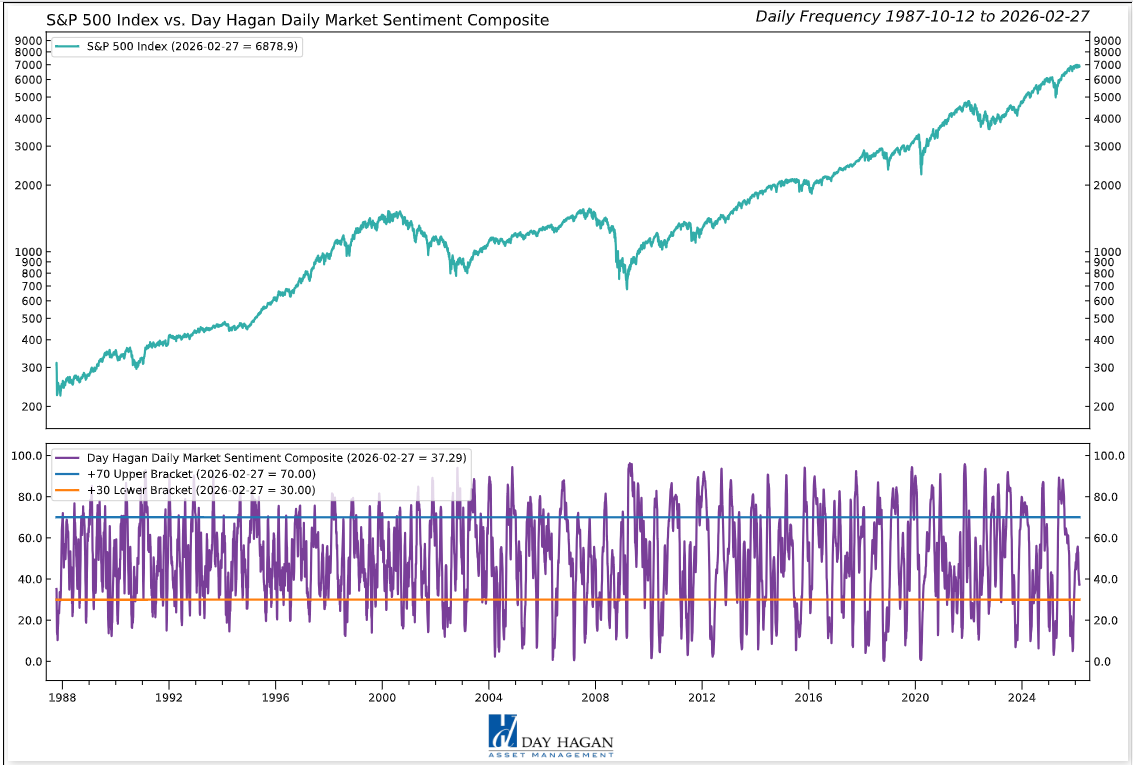
Figure 10: Should the Sentiment Composite move back above the 70 level, we would view it as a negative development and a potential short-term headwind.
This strategy uses measures of price, valuation, economic trends, liquidity, and market sentiment to make objective, rational, and unemotional decisions about how much capital to risk and where to allocate it.
For more information, please contact us at:
Day Hagan Asset Management
1000 S. Tamiami Trl
Sarasota, FL 34236
Toll Free: (800) 594-7930
Office Phone: (941) 330-1702
Website: https://dayhagan.com or https://dhfunds.com
© 2026 Day Hagan Asset Management
This material is for educational purposes only. Further distribution is prohibited without prior permission. Please see the information on Disclosures and Fact Sheets here: https://dhfunds.com/literature. Charts with models and return information use indices for performance testing to extend the model histories, and they should be considered hypothetical. All Rights Reserved. (© Copyright 2026 Day Hagan Asset Management.)
Day Hagan Smart Sector® International ETF
Symbol: SSXU
Strategy Description
The Smart Sector® International strategy combines three quantitative investment strategies: Core International, Explore International, and Catastrophic Stop.
The Process Is Based On The Weight Of The Evidence
Core Allocation
The fund begins by overweighting and underweighting the largest non-U.S. equity markets based on proprietary models.
Each of the models utilizes market-specific, weight-of-the-evidence composites of fundamental, economic, technical, and behavioral indicators to determine each area’s probability of outperforming the ACWI, for example. U.S. Markets are weighted accordingly relative to benchmark weightings.
Explore Allocation
To select smaller markets, the fund uses a multi-factor technical ranking system to choose the top markets. The markets with the highest rankings split the non-core model allocation equally.
When Market Risks Become Extraordinarily High — Reduce Your Portfolio Risk
The model remains fully invested unless the Catastrophic model is triggered, whereupon the equity-invested position may be trimmed by up to 50%.
The Catastrophic Stop model combines time-tested, objective indicators designed to identify periods of high risk for the broad U.S. equity market. The model uses price-based, breadth, deviation from trend, fundamental, economic, interest rate, behavioral, and volatility-based indicator composites.
When Market Risks Return To Normal — Put Your Money Back To Work
When the Catastrophic Stop model moves back to bullish levels, indicating lower risk, the strategy will reverse toward being fully invested.
Disclosures
The data and analysis contained within are provided “as is” and without warranty of any kind, either express or implied. The information is based on data believed to be reliable, but it is not guaranteed. Day Hagan DISCLAIMS ANY AND ALL EXPRESS OR IMPLIED WARRANTIES, INCLUDING, BUT NOT LIMITED TO, ANY WARRANTIES OF MERCHANTABILITY, SUITABILITY, OR FITNESS FOR A PARTICULAR PURPOSE OR USE. All performance measures do not reflect tax consequences, execution, commissions, and other trading costs, and as such, investors should consult their tax advisors before making investment decisions, as well as realize that the past performance and results of the model are not a guarantee of future results. The Smart Sector® Strategy is not intended to be the primary basis for investment decisions, and the usage of the model does not address the suitability of any particular investment for any particular investor.
Using any graph, chart, formula, model, or other device to assist in deciding which securities to trade or when to trade them presents many difficulties, and their effectiveness has significant limitations, including that prior patterns may not repeat themselves continuously or on any particular occasion. In addition, market participants using such devices can impact the market in a way that changes the effectiveness of such devices. Day Hagan believes no individual graph, chart, formula, model, or other device should be used as the sole basis for any investment decision and suggests that all market participants consider differing viewpoints and use a weight-of-the-evidence approach that fits their investment needs.
Past performance does not guarantee future results. No current or prospective client should assume future performance of any specific investment or strategy will be profitable or equal to past performance levels. All investment strategies have the potential for profit or loss. Changes in investment strategies, contributions or withdrawals, and economic conditions may materially alter the performance of your portfolio. Different types of investments involve varying degrees of risk, and there can be no assurance that any specific investment or strategy will be suitable or profitable for a client’s portfolio. Historical performance results for investment indexes and/or categories generally do not reflect the deduction of transaction and/or custodial charges or the deduction of an investment management fee, the incurrence of which would have the effect of decreasing historical performance results. There can be no assurances that a portfolio will match or outperform any particular benchmark. Comparisons to indices are inherently unreliable indicators of future performance. The strategies used to generate the performance vary from those used to generate the returns depicted in the benchmarks. Investors cannot directly invest in an index.
The information contained herein is provided for informational purposes only and should not be construed as investment advice or a recommendation to buy or sell any security. The securities, instruments, or strategies described may not be suitable for all investors, and their value and income may fluctuate. Past performance is not indicative of future results, and there is no guarantee that any investment strategy will achieve its objectives, generate profits, or avoid losses.
This material is intended to provide general market commentary and should not be relied upon as individualized investment advice. Investors should consult with their financial professional before making any investment decisions based on this information.
The material may contain “forward-looking” information that is not purely historical in nature. Such information may include, among other things, projections, forecasts, estimates of market returns, and proposed or expected portfolio composition. Day Hagan Asset Management, its affiliates, employees, or third-party data providers shall not be liable for any loss sustained by any person relying on this information. All opinions and views expressed are subject to change without notice and may differ from those of other investment professionals within Day Hagan Asset Management or Ashton Thomas Private Wealth, LLC.
Accounts managed by Day Hagan Asset Management or its affiliates may hold positions in the securities discussed and may trade such securities without notice.
Day Hagan Asset Management is a division of and doing business as (DBA) Ashton Thomas Private Wealth, LLC, an SEC-registered investment adviser. Registration with the SEC does not imply a certain level of skill or training.
This material is for educational purposes only. Further distribution is prohibited without prior permission. Please see the information on Disclosures and Fact Sheets here: https://dhfunds.com/literature. Charts with models and return information use indices for performance testing to extend the model histories, and they should be considered hypothetical. All Rights Reserved. (© Copyright 2026 Day Hagan Asset Management.)
All hypothetical results are presented for illustrative purposes only. Back-testing and other statistical analysis is provided in use simulated analysis and hypothetical circumstances to estimate how it may have performed prior to its actual existence. The results obtained from "back-testing" information should not be considered indicative of the actual results that might be obtained from an investment or participation in a financial instrument or transaction referencing the Index. The Firm provides no assurance or guarantee that the products/securities linked to the strategy will operate or would have operated in the past in a manner consistent with these materials. The hypothetical historical levels have inherent limitations. Alternative simulations, techniques, modeling or assumptions might produce significantly different results and prove to be more appropriate. Actual results will vary, perhaps materially, from the simulated returns presented.
© 2026 Day Hagan Asset Management
