
Day Hagan Smart Sector® with Catastrophic Stop Strategy Update March 2026
A downloadable PDF copy of the Article:
Day Hagan Smart Sector® with Catastrophic Stop Strategy Update March 2026 (pdf)
Executive Summary
In February, the U.S. stock market was shaped by a combination of Federal Reserve policy signals, mixed economic data, and pronounced sector rotation that reflected shifting investor expectations about growth and interest rates.
A central influence was the Federal Reserve's activity. After holding rates steady at its late-January meeting, Fed officials used speeches throughout February to emphasize a “data-dependent” stance. While inflation had moderated from its 2024–2025 peaks, core measures remained slightly above the 2% target, keeping policymakers cautious about signaling imminent rate cuts. Treasury yields moved within a volatile but contained range as markets recalibrated expectations for the timing and pace of easing. Equity investors reacted quickly to each policy hint, with rate-sensitive sectors experiencing outsized swings.
Economic releases added nuance. January CPI and PPI data, reported in mid-February, showed continued disinflation in goods but stickier inflation in services, particularly in housing and healthcare. Meanwhile, nonfarm payrolls surprised modestly to the upside, underscoring labor market resilience but also reinforcing the Fed’s reluctance to pivot prematurely. Retail sales data pointed to a cooling yet still constructive consumer backdrop, while manufacturing surveys remained mixed, reflecting uneven global demand. Together, these releases painted a picture of a slowing but not stalling economy.
Sector trends during the month highlighted rotation rather than broad-based risk appetite. Large-cap technology stocks, which had led much of the prior rally, consolidated as investors trimmed positions in high-multiple names amid higher real yields. Capital flowed instead into financials and select industrials, benefiting from stable credit conditions and tailwinds from infrastructure spending. Energy shares also saw renewed interest on firmer crude prices and improved cash-flow discipline. Conversely, defensive sectors such as utilities and consumer staples lagged early in the month, then stabilized as volatility picked up.
Overall, February 2026 was characterized less by dramatic index moves and more by repositioning. Investors balanced optimism about eventual policy easing with caution about sticky inflation, driving a rotation that reflected evolving expectations about growth, rates, and the durability of earnings. Holdings
Sector
Consumer Discretionary
Consumer Staples
Communication Services
Energy
Financials
Health Care
Industrials
Information Technology
Materials
Real Estate
Utilities
Outlook (relative to benchmark weighting)
Underweight
Overweight
Overweight
Neutral
Underweight
Underweight
Underweight
Overweight
Overweight
Overweight
Overweight
Sector Review
Our March sector tilts indicate how the portfolio is positioned relative to its benchmark and provide insight into our models’ macroeconomic outlook and risk posture. An overweight allocation to Consumer Staples, Utilities, and Real Estate suggests a defensive bias. These sectors are typically favored when markets anticipate slower economic growth or heightened volatility because they tend to generate stable earnings and consistent cash flows regardless of the economic cycle. In contrast, the underweight positions in Consumer Discretionary and Industrials imply reduced confidence in cyclical growth and consumer-driven expansion. This positioning signals caution about the strength and sustainability of economic momentum.
At the same time, the portfolio maintains selective growth exposure through overweight positions in Information Technology and Communication Services. This suggests that while the overall stance leans defensive, the models still see opportunity in secular growth themes such as digital transformation, artificial intelligence, and platform-based business models. These sectors often combine strong earnings growth potential with high margins and durable competitive advantages, making them attractive even in a moderating growth environment.
The overweight allocation to Materials reflects expectations for infrastructure spending, supply constraints, or commodity price support, while the overweight to Real Estate indicates a view that interest rates are stabilizing or may decline, enhancing the appeal of income-generating assets.
Meanwhile, an underweight position in Financials suggests limited conviction in a strong cyclical rebound or sustained commodity upside. The underweight in Health Care is notable, as it is often considered defensive; this reflects valuation considerations and a strategic preference for other defensive sectors offering more attractive risk-reward profiles.
Overall, the combination of defensive overweights and cyclical underweights, balanced by selective growth exposure, points to a moderately cautious outlook—one anticipating slower but stable economic conditions rather than a robust expansion.
Consumer Discretionary: In February, the S&P 500 Consumer Discretionary sector faced a split backdrop, with macro inputs offering support while price leadership lagged. On the positive side, breadth improved, as reflected in bullish 120-day net new highs, suggesting participation beneath the surface. Housing data remained constructive; housing starts were reported at roughly 1.404 million SAAR in the latest release, reinforcing stabilization in interest-rate-sensitive demand. Total consumer credit owned and securitized continued to expand, indicating households still had access to financing. Long-end rates also eased modestly, with the 30-year Treasury yield averaging near 4.7% in February, helping duration-sensitive growth names at the margin. These factors provided a fundamental cushion tied to credit availability and housing-linked activity. However, the price structure told a more cautious story. Short- and intermediate-term moving average crosses were bearish, along with negative readings in price deviation from trend and relative momentum, signaling fading leadership relative to the broader market. Overbought/oversold measures also leaned bearish, indicating limited technical support. Relative forward P/E was unfavorable, highlighting valuation pressure in a sector already trading at a premium. Discretionary consumer spending data was neutral, offering neither acceleration nor contraction. Overall, February reflected improving macro stability and financing conditions, but weak relative trend dynamics and valuation headwinds kept the sector from asserting clear leadership.
Figure 1: The Consumer Discretionary sector is in minor oversold territory. A reversal back above the lower SD bracket would generate a buy signal.
Consumer Staples: The S&P 500 Consumer Staples displayed improving internal strength even as fundamental inputs were mixed. On the positive side, trend structure firmed, with the moving average cross turning bullish and relative net new highs and 45-day breadth confirming broader participation. Overbought/oversold measures were constructive, suggesting room for continued upside. Financial conditions remained supportive; the Chicago Fed National Financial Conditions Index stayed in accommodative territory during the month, helping defensive sectors. Short interest ratios were favorable, implying limited bearish positioning pressure. Sector sales yield also compares attractively versus the broader market, reinforcing the group’s income appeal amid long-term Treasury yields holding near 4.7% in February. On the negative side, relative price momentum remained soft, signaling that leadership was still emerging rather than entrenched. Food CPI inflation moderated year-over-year in recent data, while food sales growth slowed, tempering top-line growth for packaged goods companies. The Citi G10 Economic Surprise Index trended lower, reflecting softer momentum in global data. Price deviation from trend was neutral. Overall, February favored staples’ defensive characteristics and improving breadth, even as growth-sensitive inputs remained subdued.
Figure 2: Expanding net new highs are supportive.
Communication Services: The S&P 500 Communication Services sector modestly improved as rate dynamics and earnings quality aligned. On the positive side, the relative price moving average cross turned bullish, and price deviation from the trend confirmed improving leadership relative to the broader index. One overbought/oversold measure also signaled constructive momentum, while relative earnings yield compared favorably, suggesting valuation support amid still-elevated index multiples. Importantly, the 10-year minus 2-year Treasury spread steepened modestly during the month as long rates eased and policy expectations stabilized, improving the duration backdrop for growth-oriented media and platform companies. With the 10-year yield hovering near the low-4% range in February, discount-rate pressure was less acute than in prior quarters. On the negative side, a secondary overbought/oversold measure flagged stretched near-term positioning, indicating potential for tactical consolidation. Macro inputs were mixed; the services PMI remained in expansion, but consumer confidence data softened, raising concerns about selective advertising and streaming demand. Currency stability limited translation benefits for global platforms. Overall, February reflected improving technical structure and rate support, offset by short-term positioning and uneven demand signals.
Figure 3: Communication Services showing signs of a reversal from overbought conditions.
Energy: The S&P 500 Energy sector strongly benefited from improving technicals and a supportive commodity backdrop. Relative strength turned bullish, reinforced by a constructive moving average crossover and firm 150-day sector breadth, indicating broader participation within the group. Crude oil traded above its 5-month moving average and near the upper end of its 3-month Bollinger range during the month, consistent with stable demand expectations as global PMIs held in expansion. Total world rig count trends were supportive of relative performance, suggesting disciplined supply growth rather than aggressive expansion. The trade-weighted U.S. dollar was largely neutral, limiting currency headwinds for globally priced commodities. However, not all signals are aligned. Rolling five-month volatility was elevated relative to the baseline, tempering conviction. Free cash flow momentum softened compared to prior quarters as earnings growth normalized. Crude oil days of supply ticked higher in recent data releases, and spot price relative strength was weaker than longer-term measures, reflecting range-bound trading. Overbought/oversold readings were neutral, indicating limited short-term extremes. Overall, February reflected improving breadth and trend alignment, balanced against inventory dynamics and moderating cash flow acceleration.
Figure 4: The energy sector is benefiting from geopolitical upheavals. Nonetheless, inventories are accumulating.
Financials: The S&P 500 Financials sector navigated improving macro inputs against weaker price leadership. On the positive side, the yield curve steepened modestly during the month as long-term Treasury yields eased relative to policy-sensitive short rates, improving net interest margin expectations. Business credit conditions remained stable, investment-grade option-adjusted spreads for U.S. financial institutions were contained, and bank loan growth continued expanding in recent Federal Reserve data releases. Forward earnings yield was supportive relative to the broader market, and the Citi G10 Economic Surprise Index turned higher late in the month, reflecting better-than-expected global data. These factors reinforced fundamental stability across large banks and diversified financials. On the negative side, relative price and total return readings were bearish, signaling lagging sector performance relative to the S&P 500. Overbought/oversold metrics leaned negative, and sector volatility and maximum relative drawdown measures reflected a fragile technical footing. The trade-weighted U.S. dollar remained firm, limiting the benefits of global revenue translation. Relative strength momentum was neutral, suggesting consolidation rather than acceleration. Overall, February delivered improving credit and rate fundamentals, but technical underperformance kept Financials from asserting leadership.
Figure 5: Relatively tight credit spreads are constructive for the Financials sector.
Healthcare: In February, the S&P 500 Health Care sector strengthened on improving relative trend dynamics and momentum. Relative price trends, strength momentum, and momentum reversals all turned bullish, signaling sustained leadership versus the broader market. The underlying sector trend also improved, confirming internal stabilization following prior drawdowns. With the 10-year Treasury yield holding in the low-4% range during February and volatility contained, investors gravitated toward sectors offering visibility. The U.S. Services PMI remained in expansion, reinforcing steady health care utilization, while defensive positioning gained favor amid mixed global data. Relative breadth and new construction metrics were neutral, suggesting participation was steady rather than broadening aggressively. On the negative side, maximum relative drawdown metrics highlighted lingering fragility beneath the surface. Medical CPI moderated year-over-year in recent data releases, and health care personal expenditures grew more slowly, tempering top-line acceleration. Sector book yield comparisons were unfavorable, indicating valuation was not overtly compelling. Overall, February reflected strengthening technical leadership and stable macro conditions, offset by softer spending growth and valuation considerations.
Figure 6: Health Care breadth appears to be taking a breather.
Industrials: The S&P 500 Industrials sector reflected improving macro momentum but uneven technical follow-through. On the positive side, relative price momentum measures were bullish, and industrial production data released during the month showed continued year-over-year expansion, reinforcing demand across capital goods and aerospace. Cash flow yield comparisons were supportive, highlighting balance-sheet strength among large, diversified manufacturers. The CRB Index held firm in February, consistent with steady global demand signals as U.S. manufacturing PMI remained near expansion territory. These factors helped anchor performance in defense, machinery, and transportation names. On the negative side, the broader relative price trend was bearish, and RSI readings signaled fading short-term leadership. Sector volatility and elevated 210-day new lows pointed to uneven participation. Sales yield metrics were less compelling, and relative performance versus oil futures was weak despite stable crude pricing. A firm trade-weighted U.S. dollar in February limited exporters' translation benefitsd. Consumer confidence data were neutral, offering little incremental tailwind for demand. Overall, February combined constructive production trends and cash flow support with technical fragility and currency headwinds.
Figure 7: Rising commodity prices continue to support the Industrials sector.
Information Technology: The S&P 500 Information Technology sector was the weakest sector in February as momentum and earnings dynamics decelerated. Nonetheless, earnings revision breadth strengthened during the month, reflecting upward adjustments tied to AI infrastructure spending and steady enterprise demand. Short interest ratios were supportive, suggesting potentially excessive bearish positioning. With the 10-year Treasury yield hovering in the low-4% range and largely range-bound, rate volatility was less disruptive than in prior quarters, allowing growth valuations to stabilize. U.S. services PMI remained in expansion territory in February, reinforcing technology-linked business activity. On the negative side, a secondary overbought/oversold indicator flagged stretched conditions in select mega-cap names, suggesting ongoing consolidation risk. Relative performance versus market-based inflation expectations was bearish, as breakevens firmed modestly during the month, reintroducing discount-rate sensitivity. Sales yield metrics were neutral, suggesting valuation remained full but not expanding. Overall, February reflected weaker technical momentum and improving earnings visibility, tempered by inflation sensitivity and pockets of crowded positioning.
Figure 8: Short-term OBOS indicators are now generally oversold. A reversal above the lower SD bracket, below, would generate a buy signal. Note that intermediate-term measures have more work to do before reaching significant oversold conditions.
Materials: In February, the S&P 500 Materials sector showed broad technical strength as price-based indicators aligned constructively. Relative moving average crossovers, trend measures, momentum, and price deviation from trend all turned bullish, signaling improved leadership relative to the broader market. Overbought/oversold readings confirmed sustained demand without immediate exhaustion. Sector volatility dynamics were supportive, and performance tracked positively against broader emerging and developed market equity momentum. Precious metals momentum strengthened during the month, with gold and silver futures firming later in the month, reinforcing investor interest in diversified materials exposure. Sales yield comparisons were favorable, suggesting steady top-line positioning. However, several fundamental crosscurrents tempered the backdrop. Copper spot momentum softened during February, reflecting mixed signals from global manufacturing demand. Natural gas mean reversion trends were unfavorable, highlighting commodity dispersion within the complex. Materials' earnings yield was less compelling than the broader markets, suggesting valuation sensitivity. Industrial production data for materials-related industries showed limited acceleration in recent releases. Overall, February reflected powerful technical alignment and supportive metals pricing, offset by uneven industrial demand and selective commodity weakness.
Figure 9: Natural Gas futures show signs of reversal. May lower input costs. Usually, a near-term tailwind.
Real Estate: The S&P 500 Real Estate sector benefited from an improving rate backdrop and firmer macro tone. The 30-year Treasury yield drifted modestly lower during the month, easing financing pressure and supporting REIT valuations. Relative price trend turned bullish, and 50-day breadth strengthened, signaling broader participation. Performance versus the homebuilding sub-industry improved as housing starts stabilized near 1.4 million SAAR in recent data releases. Unemployment remained near the low-4% range, reinforcing steady occupancy trends, while NFIB small business credit conditions were supportive of leasing activity. The Citi Economic Surprise Index firmed late in the month, reflecting better-than-expected macro prints. However, near-term price dynamics were uneven. The percentage positive percentage of days and price deviation from trend were bearish, indicating choppy momentum. Industrial production for construction supplies softened in recent reports, tempering materials-linked real estate demand. Overall, February reflected a constructive interest-rate environment and stable labor conditions, balanced against patchy short-term momentum and uneven construction inputs.
Figure 10: Long-term mortgage rates recently broke below the psychologically impactful 6% level.
Utilities: The S&P 500 Utilities sector quietly strengthened as defensive positioning and rate stability supported the group. Relative price moving average crossovers and reversal signals turned bullish, while overbought/oversold measures and price deviation from trend confirmed improving technical structure. Dividend yield comparisons remained favorable, reinforcing the sector’s income appeal with the 10-year Treasury yield holding in the low-4% range during the month. Capacity utilization data were steady, supporting expectations of regulated demand. Relative performance versus crude oil was constructive, reflecting stable input costs and limited commodity volatility. However, the picture was not uniformly positive. Relative momentum readings were soft, and 50-day breadth was bearish, suggesting uneven participation beneath the surface. The spread between utilities’ earnings yield and the 10-year Treasury yield narrowed, limiting the potential for valuation expansion. Manufacturing PMI data remained subdued, reducing cyclical tailwinds, while the copper/gold ratio was neutral, indicating no strong pro-growth signal. Overall, February reflected improving technical alignment and income support, balanced against moderate valuation pressure and selective breadth weakness.
Figure 11: Higher crude oil prices can imply stronger economic activity, higher energy demand, or geopolitical upheaval, all of which would benefit the defensive utilities sector.
Catastrophic Stop Update
The Catastrophic Stop model combines time-tested, objective indicators designed to identify high-risk periods for the equity market. The model entered March, recommending a fully invested equity allocation relative to the benchmark.
The weight of the evidence suggests that any weakness is unlikely to extend into a significant downtrend at this time. Of course, if our model triggers a sell signal (below 40% for two consecutive days), indicating more substantial problems, we will raise cash immediately.
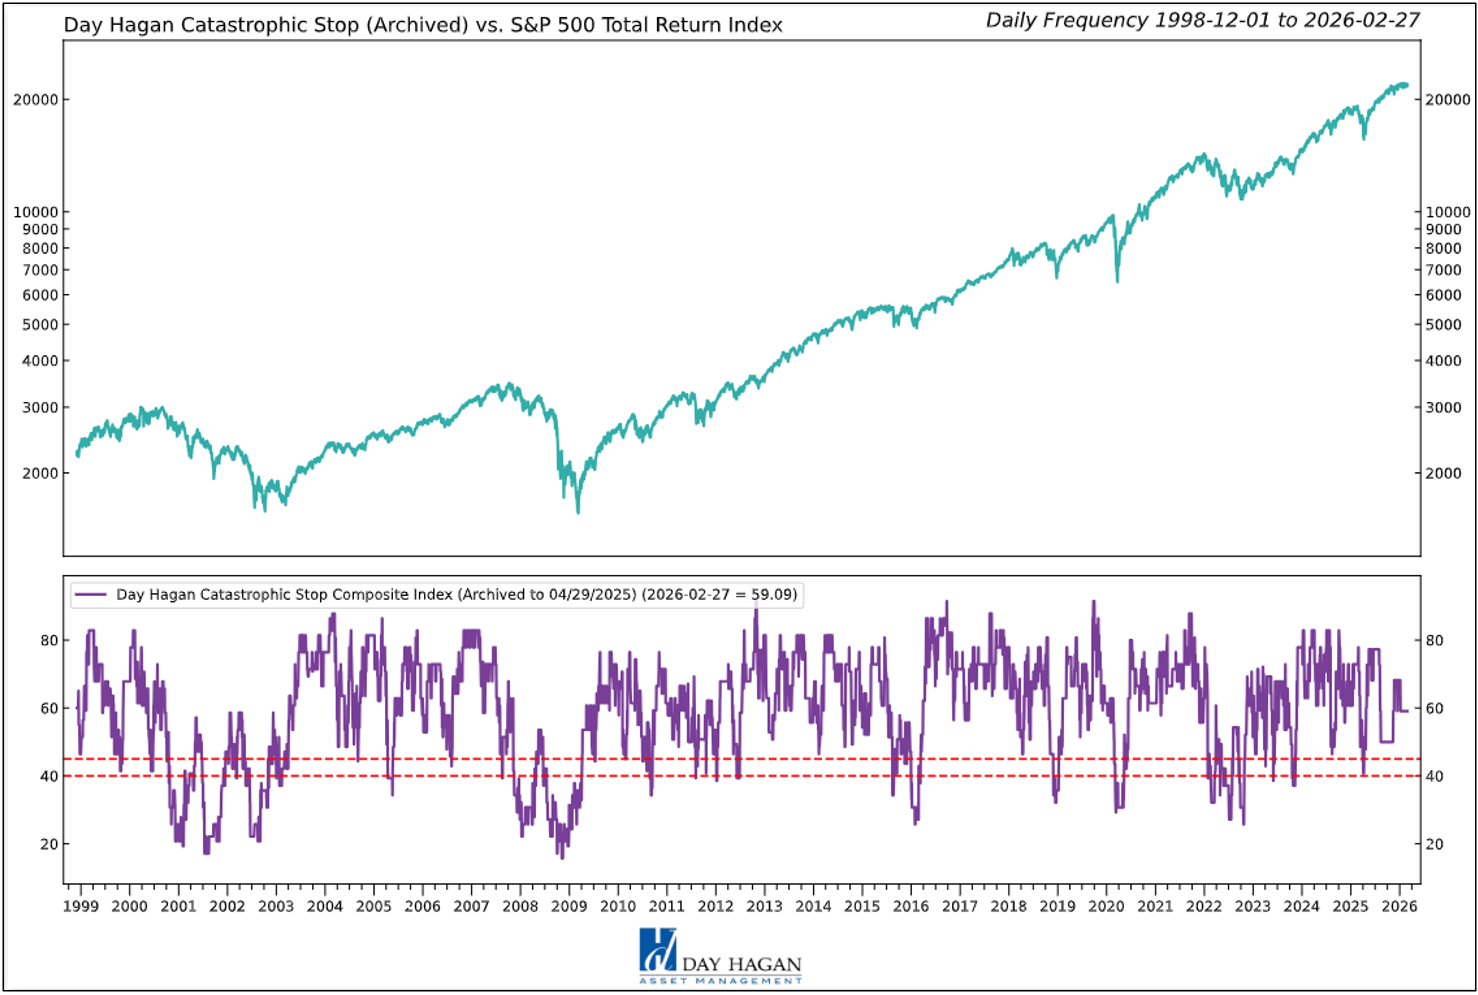
Figure 12: The Catastrophic Stop model recommends a fully invested equity position (relative to the benchmark). Because the model uses indices to extend its history, it is considered hypothetical.
Hypothetical and historical past performance is not indicative of future results. There can be no assurance that any investment or strategy will achieve its objectives or avoid substantial losses or have comparable results. This information is provided for illustrative purposes only and is not a prediction, projection, or guarantee of future performance. Hypothetical results do not reflect actual trading, were derived using the benefit of hindsight, and may not reflect material economic and market events. Actual results vary and depend on many factors and subject to risk and uncertainties.
The Day Hagan Daily Market Sentiment Composite (part of the Catastrophic Stop Model) is neutral, indicating investors are neither overly bullish nor overly bearish.
Figure 13: Should the Sentiment Composite move back above the 70 level, we would view it as a negative development and a potential short-term headwind.
Our goal is to stay on the right side of the prevailing trend and introduce risk management when conditions deteriorate. Currently, the uptrend remains intact. The broader-based composite models, which call for U.S. and international economic growth, inflation trends, liquidity, and equity demand, remain constructive. The Catastrophic Stop model is positive, and we align with its message. If our models shift to bearish levels, we will raise cash.
This strategy uses measures of price, valuation, economic trends, liquidity, and market sentiment to make objective, rational, and unemotional decisions about how much capital to allocate and where to invest it.
Day Hagan Asset Management
1000 S. Tamiami Trl
Sarasota, FL 34236
Toll Free: (800) 594-7930
Office Phone: (941) 330-1702
Website: https://dayhagan.com or https://dhfunds.com
This material is for educational purposes only. Further distribution is prohibited without prior permission. Please see the information on Disclosures and Fact Sheets here: https://dhfunds.com/literature. Charts with models and return information use indices for performance testing to extend the model histories, and they should be considered hypothetical. All Rights Reserved. (© Copyright 2026 Day Hagan Asset Management.)
Day HaganSmart Sector®
With Catastrophic Stop ETF
Symbol: SSUS
Disclosures
The data and analysis contained within are provided “as is” and without warranty of any kind, either express or implied. The information is based on data believed to be reliable, but it is not guaranteed. Day Hagan DISCLAIMS ANY AND ALL EXPRESS OR IMPLIED WARRANTIES, INCLUDING, BUT NOT LIMITED TO, ANY WARRANTIES OF MERCHANTABILITY, SUITABILITY, OR FITNESS FOR A PARTICULAR PURPOSE OR USE. All performance measures do not reflect tax consequences, execution, commissions, and other trading costs, and as such, investors should consult their tax advisors before making investment decisions, as well as realize that the past performance and results of the model are not a guarantee of future results. The Smart Sector® Strategy is not intended to be the primary basis for investment decisions, and the usage of the model does not address the suitability of any particular investment for any particular investor.
Using any graph, chart, formula, model, or other device to assist in deciding which securities to trade or when to trade them presents many difficulties, and their effectiveness has significant limitations, including that prior patterns may not repeat themselves continuously or on any particular occasion. In addition, market participants using such devices can impact the market in a way that changes the effectiveness of such devices. Day Hagan believes no individual graph, chart, formula, model, or other device should be used as the sole basis for any investment decision and suggests that all market participants consider differing viewpoints and use a weight-of-the-evidence approach that fits their investment needs.
Past performance does not guarantee future results. No current or prospective client should assume future performance of any specific investment or strategy will be profitable or equal to past performance levels. All investment strategies have the potential for profit or loss. Changes in investment strategies, contributions or withdrawals, and economic conditions may materially alter the performance of your portfolio. Different types of investments involve varying degrees of risk, and there can be no assurance that any specific investment or strategy will be suitable or profitable for a client’s portfolio. Historical performance results for investment indexes and/or categories generally do not reflect the deduction of transaction and/or custodial charges or the deduction of an investment management fee, the incurrence of which would have the effect of decreasing historical performance results. There can be no assurances that a portfolio will match or outperform any particular benchmark. Comparisons to indices are inherently unreliable indicators of future performance. The strategies used to generate the performance vary from those used to generate the returns depicted in the benchmarks. Investors cannot directly invest in an index.
The information contained herein is provided for informational purposes only and should not be construed as investment advice or a recommendation to buy or sell any security. The securities, instruments, or strategies described may not be suitable for all investors, and their value and income may fluctuate. Past performance is not indicative of future results, and there is no guarantee that any investment strategy will achieve its objectives, generate profits, or avoid losses.
This material is intended to provide general market commentary and should not be relied upon as individualized investment advice. Investors should consult with their financial professional before making any investment decisions based on this information.
The material may contain “forward-looking” information that is not purely historical in nature. Such information may include, among other things, projections, forecasts, estimates of market returns, and proposed or expected portfolio composition. Day Hagan Asset Management, its affiliates, employees, or third-party data providers shall not be liable for any loss sustained by any person relying on this information. All opinions and views expressed are subject to change without notice and may differ from those of other investment professionals within Day Hagan Asset Management or Ashton Thomas Private Wealth, LLC.
Accounts managed by Day Hagan Asset Management or its affiliates may hold positions in the securities discussed and may trade such securities without notice.
Day Hagan Asset Management is a division of and doing business as (DBA) Ashton Thomas Private Wealth, LLC, an SEC-registered investment adviser. Registration with the SEC does not imply a certain level of skill or training.
There is no guarantee that any investment strategy will achieve its objectives, generate dividends, or avoid losses.
This material is for educational purposes only. Further distribution is prohibited without prior permission. Please see the information on Disclosures and Fact Sheets here: https://dhfunds.com/literature. Charts with models and return information use indices for performance testing to extend the model histories, and they should be considered hypothetical. All hypothetical results are presented for illustrative purposes only. Back-testing and other statistical analysis is provided in use simulated analysis and hypothetical circumstances to estimate how it may have performed prior to its actual existence. The results obtained from "back-testing" information should not be considered indicative of the actual results that might be obtained from an investment or participation in a financial instrument or transaction referencing the Index. The Firm provides no assurance or guarantee that the products/securities linked to the strategy will operate or would have operated in the past in a manner consistent with these materials. The hypothetical historical levels have inherent limitations. Alternative simulations, techniques, modeling or assumptions might produce significantly different results and prove to be more appropriate. Actual results will vary, perhaps materially, from the simulated returns presented.
Sector Definitions:
Communication Services sector: The Communication Services Sector includes telecom and media & entertainment companies including producers of interactive gaming products and companies engaged in content and information creation or distribution through proprietary platforms.
Consumer Discretionary sector: The Consumer Discretionary sector's manufacturing segment includes automobiles & components, household durable goods, leisure products and textiles & apparel. The services segment includes hotels, restaurants, and other leisure facilities. It also includes distributors and retailers of consumer discretionary products.
Consumer Staples sector: The Consumer Staples sector includes manufacturers and distributors of food, beverages and tobacco and producers of non-durable household goods and personal products. It also includes distributors and retailers of consumer staples products including food & drug retailing companies.
Energy sector: The Energy sector includes companies that operate in the areas of exploration & production, refining & marketing, and storage & transportation of oil & gas and coal & consumable fuels. It also includes companies that offer oil & gas equipment and services.
Financials sector: The Financials sector includes banking, financial services, consumer finance, capital markets and insurance activities. It also includes Financial Exchanges & Data and Mortgage REITs.
Health Care sector: The Health Care sector includes health care providers & services, health care equipment & supplies, and health care technology companies. It also includes companies involved in the research, development, production and marketing of pharmaceuticals and biotechnology products.
Industrials sector: The Industrials sector includes aerospace & defense, building products, electrical equipment and machinery and companies that offer construction & engineering services. It also includes providers of commercial & professional services including printing, environmental and facilities services, office services & supplies, security & alarm services, human resource & employment services, research & consulting services. It also includes companies that provide transportation services.
Information Technology sector: The Information Technology sector includes software and information technology services, manufacturers and distributors of technology hardware & equipment such as communications equipment, cellular phones, computers & peripherals, electronic equipment and related instruments, and semiconductors and related equipment & materials.
Materials sector: The Materials sector includes chemicals, construction materials, forest products, glass, paper and related packaging products, and metals, minerals and mining companies, including producers of steel.
Real Estate sector: The Real Estate sector includes companies engaged in real estate development and operation. It also includes companies offering real estate related services and Equity Real Estate Investment Trusts (REITs).
Utilities sector: The Utilities sector covers utility companies such as electric, gas and water utilities. It also includes independent power producers, energy traders and renewable sources.
All Rights Reserved. (© Copyright 2026 Day Hagan Asset Management.)
© 2026 Day Hagan Asset Management
