
Day Hagan Smart Sector® Fixed Income Strategy Update March 2026
A downloadable PDF copy of the Article:
Day Hagan Smart Sector® Fixed Income Strategy Update March 2026 (pdf)
Executive Summary
In February, rates markets were driven by a mix of softer inflation data, a slower but still expanding labor market, and heavy Treasury supply. The January CPI report, released on February 13, showed a 0.2% month-over-month rise and 2.4% year-over-year inflation, keeping the disinflation narrative intact. The January jobs report, released February 11, showed payrolls up 130,000 and unemployment at 4.3%, enough to keep the Federal Reserve cautious but not alarmed. Against that backdrop, long-end yields declined into late month, with the 10-year Treasury yield near 4.02% as mortgage rates followed it lower.
Auction digestion mattered. Treasury’s quarterly refunding schedule included $58 billion of 3-year notes (Feb. 10), $42 billion of 10-year notes (Feb. 11), and $25 billion of 30-year bonds (Feb. 12), settling Feb. 17. Real rates stayed attractive: the Feb. 19 new 30-year TIPS priced with a 2.473% high real yield. Floating Rate Notes continued to appeal to investors seeking carry with less duration risk amid policy uncertainty.
Agency MBS benefited from the broader rally and a notable shift in demand. Freddie Mac’s 30-year mortgage rate averaged 5.98% in late February, the first sub-6% print since 2022, and Reuters reported a recent order for $200 billion in mortgage bond purchases that helped compress MBS yields versus Treasuries, even as “rate-lock” kept housing turnover muted.
Credit was more mixed. Public markets stayed open, but spreads moved wider at the margin as investors re-priced idiosyncratic risk: the ICE BofA U.S. Corporate OAS was about 0.82% and U.S. High Yield about 2.98% on Feb. 26, while EM corporate spreads were about 1.54%. International corporate bonds tracked U.S. moves, with currency hedging costs shaping returns for dollar-based buyers. CDS hedging demand increased amid private-credit stress: Morningstar DBRS flagged a February default rate of around 4% in its private-credit universe and a rising downgrade pace, and Reuters highlighted turmoil tied to Blue Owl that added to concerns.
The recent turmoil in private credit markets, including higher default rates and several fund-level restructurings during February, has tightened lending standards and pushed investors to reassess liquidity risk. Public corporate bonds have seen modest spread widening as credit default swap activity picked up, particularly in lower-rated issuers. For private lenders, capital calls and slower fundraising could curb deal flow. The result may be higher borrowing costs and more selective underwriting across both markets in the coming quarters.
Near term, the next CPI (for February inflation) arrives on March 11, 2026, and investors will be watching whether spreads stabilize as new issue calendars reset.
Holdings
Fixed Income Sector
US 1-3 Month T-bill
US 3-7 Year Treasury
US 10-20 Year Treasury
TIPS (short-term)
US Mortgage-Backed
US Floating Rate
US Corporate
US High Yield
International Corporate Bond
Emerging Market Bond
Outlook (relative to benchmark)
Overweight
Neutral
Neutral
Overweight
Overweight
Underweight
Underweight
Underweight
Overweight
Overweight
Position Details
U.S. Treasuries: In February, several indicators painted encouraging signals for U.S. Treasury fixed-income markets. The relative strength of long-dated Treasuries versus the equity market trend was positive, reflecting investor demand for safer assets amid AI-related volatility and tariff uncertainty. Treasuries also showed strength relative to credit default swaps, suggesting that market participants favored sovereign risk over corporate credit during episodes of private credit stress in the month. Economic data such as moderating inflation (with January CPI at 2.4%) and cooling but still expansionary PMI readings supported demand for core government bonds, helping yields on 10- to 20-year notes drift lower to near multi-month lows around 3.95% later in the month. Short bills remained anchored by the Federal Reserve’s steady policy stance, with 1-3 month T-bill rates around the high-3% area earlier in the month, as the central bank showed little inclination to move before key inflation gauges are updated. Sentiment toward longer maturities also found support from softer GDP momentum late in 2025 and slower business activity in early 2026, nudging investors toward duration. On the downside, several technical and fundamental factors weighed on Treasuries. Relative strength versus technical cross and momentum metrics were bearish, indicating short-term price action lacked clear upside follow-through. Treasuries lagged inflation expectations as producer prices posted stronger-than-expected gains, complicating real-return prospects and weighing on breakevens. Additionally, ongoing uncertainty around trade policy and geopolitical headlines pressured markets unevenly, and softer macro readings challenged conviction in extended rallies. Together, these dynamics kept investors cautious, particularly in the 3-7 year intermediate sector, where rate anticipation remained a key driver.
Figure 1: The increase in CDS rates hasn’t been enough to generate a sell signal as of this writing.
U.S. TIPS: TIPS markets saw a compelling mix of supportive and challenging signals. On the positive side, TIPS exhibited strong relative strength against technical RSI measures, which often signal oversold conditions reversing or ongoing underlying demand from real-money investors seeking inflation protection. Commodity price trends, particularly industrial materials returning toward year-earlier levels, reduced one source of inflation volatility, buoying real yield appetite amid fears of goods inflation. Relative strength against high-yield option-adjusted spreads also helped, as widening corporate credit spreads amid private credit stress and risk-off positioning made sovereign real returns comparatively attractive. Importantly, TIPS held up well relative to broader inflation expectations data: both one- and three-year inflation expectation surveys showed moderation in expected price gains, adding to the justification for inflation-linked bonds as a diversifier when nominal yields were volatile. On the negative side, momentum mean-reversion and moving-average cross indicators were weak, signaling that recent price trends lacked the upward follow-through that quantitative trend-based models look for. February’s mixed macroeconomic backdrop played into this: while core CPI eased to near multi-year lows, underlying producer price strength and persistence in service inflation complicated the narrative for real yields. Inflation data showed slowing headlines and core consumer prices, but wholesale and producer inflation surprised to the upside late in the month, suggesting pass-through pressures remain. These inflation dynamics dampened TIPS momentum as markets struggled to quantify the extent to which inflation was transitory versus entrenched. Together, this blend of signals made TIPS positioning nuanced in February, with fundamental inflation data and market technicals pulling in different directions.
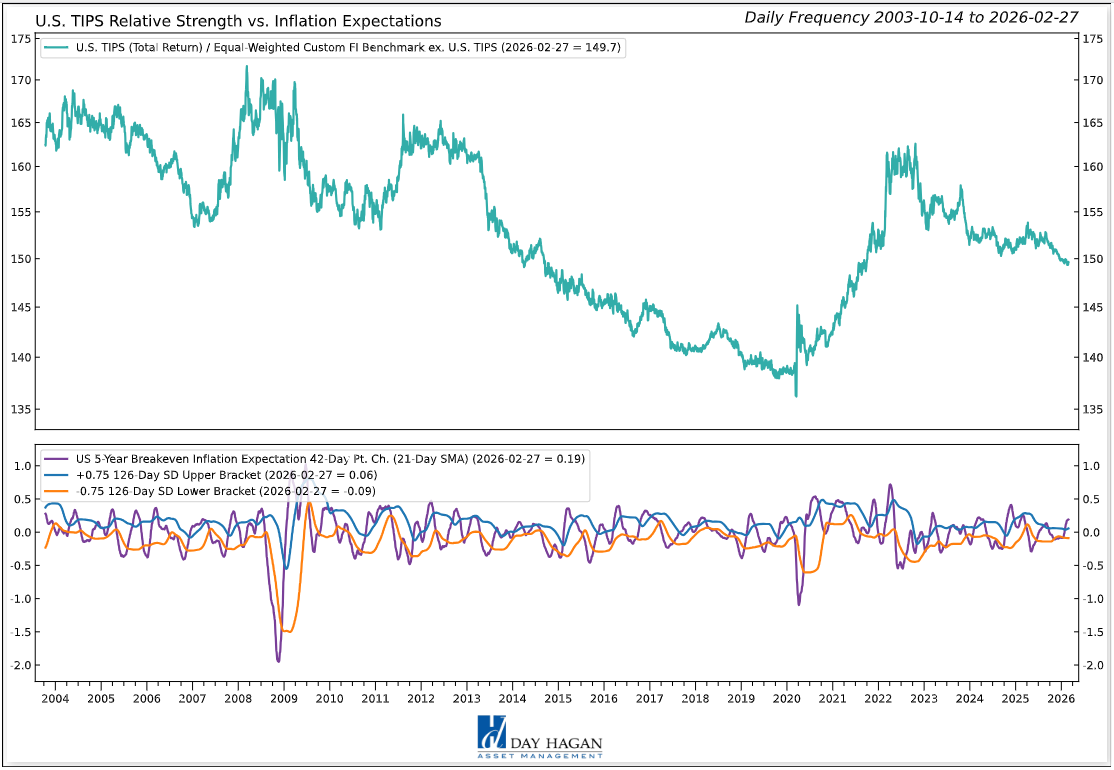
Figure 2: The increase in inflation expectations is constructive for TIPS.
U.S. Mortgage-Backed Securities: Several technical and fundamental indicators aligned with encouraging sector themes. Across technical indicators, MBS relative strength versus moving average cross and RSI was strong, implying a positive trend backdrop and short-term buying interest as mortgage spreads tightened alongside a rally in long Treasuries and easing nominal yields. The relative performance versus the 10-year yield was also favorable, reflecting that 30-year mortgage rates dropped to their lowest levels since late 2022, averaging around 5.98% by month’s end, tracking lower 10-year Treasury yields near 4.0%. Relative strength versus the slope of returns and high-yield OAS reinforced the narrative of MBS outperforming riskier credit in a cautious environment, where corporate bond spreads widened modestly amid private credit headwinds. Inflation expectations also supported MBS positioning as both headline and core CPI data suggested moderation, which helped real yields and made mortgage coupons attractive in spread terms. On the negative side, while tangentially captured in the positive indicators, broader housing market headwinds and still-soft economic demand dynamics tempered outright bullishness. Despite lower rates, mortgage applications and purchase activity remained weak, with only modest improvements in weekly application volumes that hinted at tentative demand rather than a robust rebound — illustrating that MBS flows were influenced as much by technical positioning and rate moves as by underlying home-buying fundamentals.
Figure 3: Lower rates, including mortgage rates, are initially positive for MBS.
U.S. Floating Rate Notes: Floating Rate Notes (FRNs) reflected a market caught between steady front-end policy rates and shifting risk sentiment. On the positive side, FRNs showed constructive relative strength versus VIX extremes, underscoring their appeal during pockets of equity volatility and credit stress tied to private credit dislocations. With the Federal Reserve holding its policy rate steady and the effective fed funds rate hovering in the mid-4% range, FRNs continued to deliver attractive carry with minimal duration exposure. January CPI, reported in February, eased to roughly 2.4% year-over-year, while unemployment ticked up toward 4.3%, reinforcing expectations that policy would remain on hold in the near term. In that environment, floating coupons linked to short-term benchmarks remained compelling for liquidity-focused investors. On the negative side, several technical measures were weak. Relative strength versus technical crossovers, momentum, and slope percentage all pointed to fading upside participation as longer-duration Treasuries rallied and investors extended out the curve. FRNs also lagged relative to OIS swap rates, reflecting tighter front-end rate volatility and a modest decline in short-term yield expectations as Treasury bill yields edged lower through the month. The 3-month Treasury bill yield drifted from earlier highs, compressing incremental carry advantages. As risk appetite stabilized late in the month and longer maturities gained on softer growth indicators and moderating inflation prints, FRNs underperformed on a relative basis. In short, February favored duration extension over pure rate reset exposure, even as FRNs continued to serve as a low-volatility income tool within diversified portfolios.
Figure 4: Floating Rate Securities do not do well when equity volatility is moving higher from low levels. It can be interpreted as investors becoming more concerned about equity valuations. FLRNs (non-Treasury) are often issued by lower-quality companies.
U.S. IG Corporates: During February, U.S. investment-grade corporates navigated a market defined by moderating inflation, stable policy rates, and selective credit repricing. On the positive side, relative strength versus implied bond volatility was constructive, as rate volatility eased alongside softer inflation data. U.S. CPI at roughly 2.4% year-over-year for January (released in February), while the 10-year Treasury yield drifted toward the 4.0% area, helping stabilize duration-sensitive assets. Technical cross indicators also turned favorable, suggesting improved trend participation as primary issuance was absorbed smoothly, and investors extended duration after a strong start to the year, with equities faltering mid-month. Against a backdrop of steady Federal Reserve policy and still-expansionary PMIs near the 50 threshold, high-quality balance sheets remained attractive to total-return investors seeking incremental spread over Treasuries. On the negative side, relative strength versus option-adjusted spreads was weak, reflecting modest spread widening amid private credit stress and select earnings disappointments, prompting a reassessment of corporate risk. CDS levels were broadly stable, producing a neutral read, but relative performance versus the U.S. dollar lagged as the dollar firmed during periods of global uncertainty, reducing the appeal of dollar corporates to some foreign buyers. Mean-reversion signals were also unfavorable, indicating stretched valuations following January gains and limited room for further tightening without a stronger growth impulse. In short, February rewarded disciplined carry and high-quality exposure, but widening spreads and currency dynamics capped upside for investment-grade credit.
Figure 5: A weaker U.S. dollar, or expectations of such, can negatively impact fund flows from U.S. and foreign investors. Nonetheless, a reversal in this indicator back above the lower bracket would generate a buy signal.
U.S. High Yield: U.S. high yield bonds traded in a more selective and technically fragile environment. On the positive side, relative strength versus the U.S. small-cap equity trend was constructive, reflecting that risk appetite did not fully collapse even as volatility picked up mid-month. There were also encouraging signals from option-adjusted spread reversal measures, suggesting that spread widening episodes attracted buyers rather than triggering disorderly repricing. Macro data offered some support: January CPI at roughly 2.4% year-over-year and unemployment at nearly 4.3%, suggesting slower but still positive growth. With the Federal Reserve holding policy steady and the 10-year Treasury yield easing toward 4.0%, the carry profile of high yield remained compelling on an absolute basis. That said, most technical indicators leaned negative. Relative strength versus technical crossovers, bond breadth, and total return moving averages all signaled weakening internal momentum. Fewer issues participated in rallies, a classic late-cycle characteristic. Performance relative to the VIX moving average was also unfavorable, as equity volatility tied to private credit stress and uneven earnings reports weighed on sentiment. Data showed manufacturing PMIs hovering near the contraction threshold around 50, reinforcing concerns about earnings durability for lower-rated issuers. While spreads did not gap dramatically wider, the tone shifted from broad tightening to more discriminating credit selection. In short, February rewarded tactical buyers of weakness but penalized passive exposure, as dispersion increased and technical undercurrents softened beneath the surface of still-attractive yields.
Figure 6: Rising equity volatility has historically been negative for High-Yield bonds.
International IG Bonds: International investment-grade corporates reflected a steady but nuanced cross-current between improving technicals and uneven global risk sentiment. On the positive side, relative strength versus moving average crossovers and relative strength slope turned constructive, signaling that price trends were stabilizing after January volatility. Relative performance versus option-adjusted spreads was also favorable, as spreads in parts of Europe and Asia tightened modestly while U.S. credit markets digested private credit stress. Euro area inflation eased toward 2.5% year-over-year, and manufacturing PMIs are stabilizing just below 50, reinforcing expectations that the European Central Bank would maintain a cautious but steady policy path. Lower Bund yields during the month supported duration exposure and improved technical breadth in global bond indices helped international corporates participate in the broader fixed income rally. On the negative side, relative strength versus equity risk and VIX trends were weak, reflecting bouts of volatility in global equities tied to uneven earnings and geopolitical tensions. The U.S. dollar firmed modestly at points in February, tightening financial conditions for some emerging Europe and Asia issuers and tempering foreign demand for dollar-denominated credit. Credit default swap indicators were broadly neutral, suggesting no systemic stress but also no strong catalyst for aggressive spread tightening. With global growth data mixed — China PMIs hovering near contraction territory and euro area GDP momentum subdued — international investment-grade markets moved higher primarily on technical improvements and lower sovereign yields rather than on a broad upswing in global risk appetite.
Figure 7: This MACD trend indicator is currently positive, but the uptrend appears to be waning. Watching for a cross below.
Emerging Market Bonds: Emerging market (EM) sovereign and corporate bonds are supported by a broadly constructive technical profile amid improving cross-asset dynamics. Relative strength versus the EM currency index was positive, reflecting more stable FX conditions as the dollar softened intermittently during the month. The U.S. dollar index eased from earlier highs while several Latin American currencies firmed, helping USD-denominated EM debt. Relative performance versus emerging equity momentum was also favorable, suggesting that fixed-income investors captured carry without taking on full equity beta risk. Commodity market strength added another tailwind: oil prices hovered in the mid-$70s (Brent) per barrel range, and industrial metals stabilized, supporting fiscal outlooks for commodity exporters. Technically, both absolute moving average crossovers and the slope of relative strength trends were positive, indicating steady price participation and improving breadth across the asset class. On the cautionary side, the supportive indicators were largely technical and externally driven rather than rooted in a clear acceleration of EM growth. China’s manufacturing PMI remained near the 50 threshold in February, signaling only marginal expansion, while broader global PMIs were mixed. U.S. inflation, reported at roughly 2.4% year-over-year for January, and a steady Federal Reserve stance kept global rate expectations anchored, but any renewed dollar strength or Treasury yield backup would pose sensitivity risks. In short, February rewarded EM bond investors through favorable technical alignment and commodity stability, though the macro foundation remains dependent on global liquidity conditions and disciplined fiscal management across key issuers.
Figure 8: Strengthening commodity prices continue to support EM bonds. A reversal back below the longer-term moving average would generate a sell signal for this indicator.
Catastrophic Stop Model
The Catastrophic Stop model combines time-tested, objective indicators to identify high-risk periods for equities and fixed-income assets that are highly correlated with the equity market. The model entered March recommending a fully invested allocation relative to the benchmark for credit sectors with high correlations to equities.
The weight of the evidence suggests that any equity weakness is unlikely to extend to a significant downtrend at this time. Of course, if our model triggers a sell signal (below 40% for two consecutive days), indicating more substantial problems, we will reduce exposure.
Figure 9: The Catastrophic Stop model recommends a fully invested fixed-income position (relative to the benchmark). Because the model uses indices to extend its history, it is considered hypothetical.
Hypothetical and historical past performance is not indicative of future results. There can be no assurance that any investment or strategy will achieve its objectives or avoid substantial losses or have comparable results. This information is provided for illustrative purposes only and is not a prediction, projection or guarantee of future performance. Hypothetical results do not reflect actual trading, were derived using the benefit of hindsight, and may not reflect material economic and market events. Actual results vary and depend on many factors and subject to risk and uncertainties.
The Day Hagan Daily Market Sentiment Composite (part of the Catastrophic Stop Model) is neutral, indicating investors are neither overly bullish nor overly bearish.
Figure 10: Should the Sentiment Composite move back above the 70 level, we would view it as a negative development and a potential short-term headwind.
Our goal is to stay on the right side of the prevailing trend and introduce risk management when conditions deteriorate. Currently, the uptrend remains intact. The broader-based composite models calling U.S. economic growth, international economic growth, inflation trends, liquidity, and equity demand remain broadly constructive. The Catastrophic Stop model is positive, and we are aligned with the message. If our models shift to bearish levels, we will raise cash.
This strategy uses measures of price, valuation, economic trends, liquidity, and market sentiment to make objective, rational, and unemotional decisions about how much capital to risk and where to allocate it.
For more information, please contact us at:
Day Hagan Asset Management
1000 S. Tamiami Trl
Sarasota, FL 34236
Toll Free: (800) 594-7930
Office Phone: (941) 330-1702
Website: https://dayhagan.com or https://dhfunds.com
© 2026 Day Hagan Asset Management
This material is for educational purposes only. Further distribution is prohibited without prior permission. Please see the information on Disclosures and Fact Sheets here: https://dhfunds.com/literature. Charts with models and return information use indices for performance testing to extend the model histories, and they should be considered hypothetical. All Rights Reserved. (© Copyright 2026 Day Hagan Asset Management.)
Day Hagan Smart Sector® Fixed Income ETF
Symbol: SSFI
Disclosures
The data and analysis contained within are provided “as is” and without warranty of any kind, either express or implied. The information is based on data believed to be reliable, but it is not guaranteed. Day Hagan DISCLAIMS ANY AND ALL EXPRESS OR IMPLIED WARRANTIES, INCLUDING, BUT NOT LIMITED TO, ANY WARRANTIES OF MERCHANTABILITY, SUITABILITY, OR FITNESS FOR A PARTICULAR PURPOSE OR USE. All performance measures do not reflect tax consequences, execution, commissions, and other trading costs, and as such, investors should consult their tax advisors before making investment decisions, as well as realize that the past performance and results of the model are not a guarantee of future results. The Smart Sector® Strategy is not intended to be the primary basis for investment decisions, and the usage of the model does not address the suitability of any particular investment for any particular investor.
Using any graph, chart, formula, model, or other device to assist in deciding which securities to trade or when to trade them presents many difficulties, and their effectiveness has significant limitations, including that prior patterns may not repeat themselves continuously or on any particular occasion. In addition, market participants using such devices can impact the market in a way that changes the effectiveness of such devices. Day Hagan believes no individual graph, chart, formula, model, or other device should be used as the sole basis for any investment decision and suggests that all market participants consider differing viewpoints and use a weight-of-the-evidence approach that fits their investment needs.
Past performance does not guarantee future results. No current or prospective client should assume future performance of any specific investment or strategy will be profitable or equal to past performance levels. All investment strategies have the potential for profit or loss. Changes in investment strategies, contributions or withdrawals, and economic conditions may materially alter the performance of your portfolio. Different types of investments involve varying degrees of risk, and there can be no assurance that any specific investment or strategy will be suitable or profitable for a client’s portfolio. Historical performance results for investment indexes and/or categories generally do not reflect the deduction of transaction and/or custodial charges or the deduction of an investment management fee, the incurrence of which would have the effect of decreasing historical performance results. There can be no assurances that a portfolio will match or outperform any particular benchmark. Comparisons to indices are inherently unreliable indicators of future performance. The strategies used to generate the performance vary from those used to generate the returns depicted in the benchmarks. Investors cannot directly invest in an index.
The information contained herein is provided for informational purposes only and should not be construed as investment advice or a recommendation to buy or sell any security. The securities, instruments, or strategies described may not be suitable for all investors, and their value and income may fluctuate. Past performance is not indicative of future results, and there is no guarantee that any investment strategy will achieve its objectives, generate profits, or avoid losses.
This material is intended to provide general market commentary and should not be relied upon as individualized investment advice. Investors should consult with their financial professional before making any investment decisions based on this information.
The material may contain “forward-looking” information that is not purely historical in nature. Such information may include, among other things, projections, forecasts, estimates of market returns, and proposed or expected portfolio composition. Day Hagan Asset Management, its affiliates, employees, or third-party data providers shall not be liable for any loss sustained by any person relying on this information. All opinions and views expressed are subject to change without notice and may differ from those of other investment professionals within Day Hagan Asset Management or Ashton Thomas Private Wealth, LLC.
Accounts managed by Day Hagan Asset Management or its affiliates may hold positions in the securities discussed and may trade such securities without notice.
Day Hagan Asset Management is a division of and doing business as (DBA) Ashton Thomas Private Wealth, LLC, an SEC-registered investment adviser. Registration with the SEC does not imply a certain level of skill or training.
There is no guarantee that any investment strategy will achieve its objectives, generate dividends, or avoid losses.
This material is for educational purposes only. Further distribution is prohibited without prior permission. Please see the information on Disclosures and Fact Sheets here: https://dhfunds.com/literature. Charts with models and return information use indices for performance testing to extend the model histories, and they should be considered hypothetical. All Rights Reserved.
All hypothetical results are presented for illustrative purposes only. Back testing and other statistical analysis is provided in use simulated analysis and hypothetical circumstances to estimate how it may have performed prior to its actual existence. The results obtained from "back-testing" information should not be considered indicative of the actual results that might be obtained from an investment or participation in a financial instrument or transaction referencing the Index. The Firm provides no assurance or guarantee that the products/securities linked to the strategy will operate or would have operated in the past in a manner consistent with these materials. The hypothetical historical levels have inherent limitations. Alternative simulations, techniques, modeling or assumptions might produce significantly different results and prove to be more appropriate. Actual results will vary, perhaps materially, from the simulated returns presented.
© 2026 Day Hagan Asset ManagementFuture Online Events
