
Day Hagan Smart Sector® International Strategy Update July 2026
A downloadable PDF copy of the Article:
Day Hagan Smart Sector® International Strategy Update July 2026 (pdf)
Executive Summary
With this month’s rebalance, we are expanding the Smart Sector International opportunity set by adding South Korea, Taiwan, India, and the Netherlands to the Developed Market lineup. This is not a cosmetic change. It reflects how global market leadership has changed.
Several markets that were once viewed mostly through an “emerging market” lens now represent large, liquid, institutionally relevant equity markets with meaningful global influence. Taiwan is now the index's second-largest country exposure at 8.95%, behind Japan at 13.79%. South Korea is now the fifth-largest country exposure at 7.89%, ahead of China, France, Switzerland, Germany, Australia, India, and the Netherlands. India and the Netherlands also broaden the lineup by adding exposure to domestic-demand growth, semiconductor supply chains, global industrial leadership, and high-quality multinational earnings streams.
This wider net is important. International investing is no longer just a choice between Europe, Japan, Canada, and a broad emerging-market bucket. Global equity leadership has become more specialized. Semiconductors, automation, advanced manufacturing, energy security, capital discipline, financial strength, and currency trends are increasingly determining relative performance. Taiwan and South Korea bring critical exposure to the global technology supply chain. India adds one of the world’s strongest structural growth stories. The Netherlands adds a high-quality European market with meaningful exposure to the semiconductor and global trade sectors.
Importantly, these additions were not made by judgment alone. Each new country composite was built using the same weight-of-the-evidence process used across our existing models. The indicators were constructed, tested, and evaluated consistently across technical, macroeconomic, valuation, currency, sentiment, and earnings-based inputs. That allows us to compare markets with a common framework rather than relying on headlines, narratives, or static index classifications.
Including the new countries also increases diversification by sector. Financials represent 24.15% of the benchmark, Information Technology 22.36%, Industrials 13.99%, and Consumer Discretionary 7.53%. That sector mix reflects the broader international opportunity set we are trying to capture. The goal is not simply to own more countries. The goal is to own the right countries, at the right time, using a disciplined process that can adapt as global leadership shifts.
June gave international investors a market that felt investable, but not easy. The best opportunities were no longer tied simply to cheap valuations or broad regional exposure. They were tied to countries where earnings visibility, currency support, policy flexibility, and sector leadership aligned simultaneously. The June data releases showed a world still growing, but with sharper differences beneath the surface. AI demand, energy prices, currency swings, and central bank caution became the main forces separating winners from laggards.
The most important shift was that Asia looked more attractive than Europe. China’s official manufacturing PMI returned to expansion at 50.3 in June, helped by AI-linked exports and front-loaded shipments, but household demand and property activity remained weak. Japan’s flash composite PMI rose to 52.5, supported by stronger manufacturing and a services rebound. South Korea and Taiwan continued to benefit from semiconductor demand, though both remained exposed to China and currency volatility.
Europe improved around the edges, but not enough to eliminate growth concerns. France’s June composite PMI rose to 47.6, which was better than May but still contractionary. Germany’s composite PMI fell to 48.0 as services weakened. Euro-area inflation pressure cooled late in June, which helped the policy outlook, but weak domestic demand remained the bigger market issue. The Netherlands looked better because its model signals, valuation support relative to growth expectations, and technology exposure were more favorable than in the broader region.
Australia and Canada both remained underweights, but for different reasons. Australia faced sticky underlying inflation, an RBA still on hold at 4.35%, and softer growth. Canada’s April GDP rebound of 0.5% was encouraging, but the Canadian dollar weakened sharply in June, and the model signals remained broadly negative. Both markets still have useful commodity exposure, but neither offered enough confirmation to justify a broad overweight.
India earned a new overweight rating because its relative case improved despite a higher valuation. The NDR valuation table shows MSCI India at 20.3 times forward earnings, which is not cheap, but the model signals are helped by forward earnings growth, leading indicators, currency behavior, and lower crude sensitivity. India remains a domestic-demand and reform story, with policy credibility and earnings breadth helping offset valuation risk.
The U.K. also remained an overweight despite uneven activity. Inflation stayed at 2.8% in the May report released in June, below expectations, while first-quarter GDP was confirmed at 0.6%. The market’s low valuation, global revenue exposure, energy, banks, defense, miners, and dividend income still make it useful. The pound is a swing factor. A stable or firmer pound helps U.S. dollar investors, while renewed currency weakness would reduce the appeal.
Emerging market selections continued to favor a mix of valuation, currency behavior, commodities, and mean reversion. Malaysia offers balance and low inflation. Brazil offers deep value, but fiscal and inflation risks remain real. Peru replaced the Philippines, adding copper, precious metals, and a relatively firm currency profile. Hong Kong remains a China-linked recovery option. Mexico offers nearshoring exposure, but softer manufacturing means the peso and inflation path still matter.
Holdings
Core: Developed Market Positions (approximately 65% of equity holdings)
Country
Australia
Canada
China
France
Germany
India
Japan
Netherlands
South Korea
Switzerland
Taiwan
United Kingdom
Outlook
Underweight
Underweight
Underweight
Underweight
Underweight
Overweight
Overweight
Overweight
Overweight
Neutral
Underweight
Overweight
Explore: Emerging Market Positions (approximately 35% of equity holdings)
Malaysia
Brazil
Peru
Hong Kong
Mexico
Position Details
Core: Developed Market Commentary
Approximately 85% of the strategy is allocated across 12 large, liquid non-U.S. equity markets. The fund overweights and underweights these markets based on macro, fundamental, behavioral, currency, and technical indicators.
Australia remains underweight because the model still warns against confusing commodity exposure with a broad country opportunity. Trend, interest-rate sensitivity, moving-average signals, and the ACWI technical scorecard are negative. Beta and selected commodity exposure help, and gold is neutral, but the stronger parts of the market are not enough to offset weak confirmation. The MSCI Australia index is trading at around 17.2 times forward earnings, 2.5 times book value, and 11.6 times cash flow, which is not cheap enough to offset the macro risk.
June data reinforced that view. The RBA held the cash rate at 4.35% after earlier tightening, while May headline inflation fell to 4.0% largely due to petrol relief, and trimmed mean inflation rose to 3.6%. That is the wrong kind of disinflation for investors because the headline looks better while underlying pressure remains sticky. Australia still offers miners, banks, energy exposure, and dividend payers, but softer growth and rate risk argue for selectivity. We would emphasize balance sheets, global resource demand, and companies less dependent on domestic housing or discretionary spending.
Figure 1: Lower gold prices have historically been a headwind for Australia’s equity index.
Canada remains underweight even after a better June. The model is broadly negative across moving-average diffusion, mean reversion, absolute trend, the ACWI technical scorecard, leading indicators, and the Canadian dollar. Relative earnings yield is the main positive. MSCI Canada is currently trading at 15.6 times forward earnings, 2.7 times book value, and 12.6 times cash flow. That is reasonable, but not enough on its own when the currency and trend signals are not confirming.
April GDP, released in June, rose 0.5% from the prior month, the largest gain in nine months, and the advance estimate pointed to modest May growth. That helped ease recession fears. However, the Canadian dollar weakened about 2.9% in June as Canadian yields moved further below U.S. yields and USMCA uncertainty approached. Canada still has constructive exposure to energy, pipelines, banks, materials, gold, and infrastructure. The issue is that currency weakness, housing risk, and softer leading indicators keep the equity case narrow. We would own quality in commodities and financials rather than the whole market.
Figure 2: Canada’s OECD Composite of Leading Indicators showing signs of deterioration.
China is now underweighted despite a better June PMI release. The model is split, but the negative signals matter. Relative price momentum and the absolute moving-average cross are bearish, while mean reversion and bear-market-bounce signals are neutral. PMI and the emerging-market currency basket are bullish. High-yield credit spread sensitivity is bearish. The latest valuations indicate that MSCI China is trading around 10.0 times forward earnings, 1.3 times book value, and 10.7 times cash flow, which is inexpensive but not the full picture.
China’s official manufacturing PMI rose to 50.3 in June from 50.0, and the composite PMI edged up to 50.6. The improvement was helped by AI-related exports and front-loaded shipments. That is encouraging, but the recovery still looks uneven. Domestic demand, property, employment, and consumer confidence remain weak, while exports and advanced manufacturing are doing more of the heavy lifting. China can produce sharp rallies when valuation, policy, and sentiment align. For now, we would keep exposure focused on advanced manufacturing, technology self-sufficiency, electric vehicles, and companies less tied to property or weak household demand.
Figure 3: China’s relative price momentum remains in a downtrend.
France remains underweight. The model has one useful bright spot in dividend yield and another in ETF fund flows, but trend, cross-sectional momentum, leading indicators, the technical scorecard, and the valuation scorecard are bearish. The MSCI France index is trading around 14.4 times forward earnings, 2.1 times book value, and 10.9 times cash flow. Those valuations are not demanding, but they are not compelling enough when activity is still contracting.
The June PMI release was better, but still not good. France’s composite PMI rose to 47.6 from 44.9, manufacturing improved to 50.7, and services rose to 47.4. The direction was better, but the level still points to a private-sector contraction. Inflation cooled late in June, which helped the ECB backdrop, yet weak demand remains a problem. France has global champions in luxury, healthcare, aerospace, consumer brands, and industrials. The portfolio message is to own globally competitive companies with margin power, not to assume the domestic economy has turned.
Figure 4: France’s OECD Composite of Leading Economic Indicators is also in a downtrend.
Germany remains underweight because the June data undercut the improving narrative. Breadth is positive, and the euro signal is bullish, but the ACWI technical scorecard, relative moving-average cross, dividend yield, and manufacturing confidence are bearish. ETF flows are neutral. MSCI Germany is trading at 13.9 times forward earnings, 1.8 times book value, and 8.0 times cash flow, making it one of the more reasonably valued developed markets.
Valuation is helpful, but Germany still needs confirmation of growth. The June composite PMI fell to 48.0 from 48.8, the weakest reading in 18 months, while services dropped to 46.8 and manufacturing barely held at 50.0. Inflation eased, which could help policy expectations, but activity remains fragile. Germany has attractive exposure to automation, defense, electrification, infrastructure, and global industrial upgrades. The challenge is timing. We would wait for stronger orders, better manufacturing confidence, and firmer export momentum before leaning harder into the market.
Figure 5: Germany’s short-term trend indicators showing signs of improvement.
India is a new overweight and one of the cleaner growth stories in the developed-market sleeve. The model is not uniformly positive, because absolute trend and the ACWI technical scorecard are bearish, while mean reversion is neutral. The positives are important. The rupee signal, crude oil sensitivity, forward earnings growth, and OECD leading indicators are bullish. The MSCI India index is trading around 20.3 times forward earnings, 3.4 times book value, and 18.8 times cash flow. That is expensive, but the market is being valued for growth, policy credibility, and domestic demand.
India’s June data releases continued to support the idea that activity is stronger than in many other major markets. Manufacturing momentum remained firm, according to data released in June, even as cost pressures persisted. India also benefits when crude oil behaves, because lower or stable oil prices reduce import pressure and help the current account. The portfolio case is not that India is cheap. It is that earnings growth, domestic consumption, infrastructure, digitalization, and supply-chain diversification give the market multiple ways to keep compounding. We would emphasize financials, industrials, consumer leaders, infrastructure, and technology services while remaining mindful of valuation risk.
Figure 6: India’s Composite Model has moved out of bearish territory.
Netherlands is overweight due to broad indicator confirmation. Absolute trend, mean reversion, the ACWI technical scorecard, the euro signal, forward earnings growth, and OECD leading indicators are all bullish. Semiconductor sensitivity is the main bearish input. The MSCI Netherlands index is now at 22.4 times forward earnings, 4.6 times book value, and 24.5 times cash flow. That is a premium valuation, but it reflects the market’s concentration in high-quality global businesses and technology supply-chain exposure.
The June euro-area data were not strong, but the Netherlands is less about the local economy and more about globally competitive companies. Euro-area composite PMI improved to 49.5 in June, while manufacturing remained in expansion at 51.3. That helps the backdrop, even though services remained weak. The euro is also important for dollar-based investors. A firmer euro can support returns, while a reversal would be a headwind. Overweight companies with pricing power, global demand, semiconductor infrastructure, payments, and strong free cash flow, rather than broad domestic cyclicals.
Figure 7: The Netherlands Composite Model is in bullish territory.
South Korea is overweight, but it is not a simple call. The model has bearish absolute trend and mean reversion signals, while the ACWI technical scorecard, won-dollar signal, crude oil sensitivity, and OECD leading indicators are bullish. Forward earnings growth is bearish and warrants attention. The MSCI South Korea index is trading at 8.3 times forward earnings, 3.3 times book value, and 15.0 times cash flow. The forward P/E is low, but the book and cash-flow multiples show that investors are already differentiating between winners and laggards.
The July case for South Korea rests on semiconductors, AI infrastructure, memory demand, autos, defense, and policy support. Asian factory surveys released in June showed that South Korea’s manufacturing PMI reached its strongest level since 2021 in the prior month, helped by efforts to secure supply ahead of potential disruptions. The won matters because currency strength supports dollar-based returns, while weakness can quickly offset local-market gains. We would emphasize semiconductor leaders, autos with global pricing power, defense, and shareholder-return reform while avoiding areas tied to weak domestic demand.
Figure 8: South Korea’s Composite Model remains positive, but is showing signs of potential fatigue.
Taiwan is underweighted despite its obvious importance in AI and semiconductors. The model is mixed but not strong enough. The ACWI technical scorecard, valuation scorecard, and Taiwan dollar signal are bullish, while the absolute trend, mean reversion, semiconductor index sensitivity, and China PMI sensitivity are bearish. The MSCI Taiwan index is trading at 22.3 times forward earnings, 5.7 times book value, and 23.2 times cash flow. That is one of the most expensive profiles in the table.
The issue is not quality. Taiwan has world-class semiconductor exposure, high-margin exporters, and direct linkage to AI capital spending. The issue is price and concentration. Asia factory data released in June showed Taiwan’s manufacturing PMI remained strong in the prior month, but the model’s semiconductor sensitivity had turned bearish, suggesting expectations may already be high. The Taiwan dollar is a positive if it remains firm, but China sensitivity and geopolitical risk should not be ignored. We would keep exposure selective and focus on companies turning AI demand into cash flow, not simply revenue excitement.
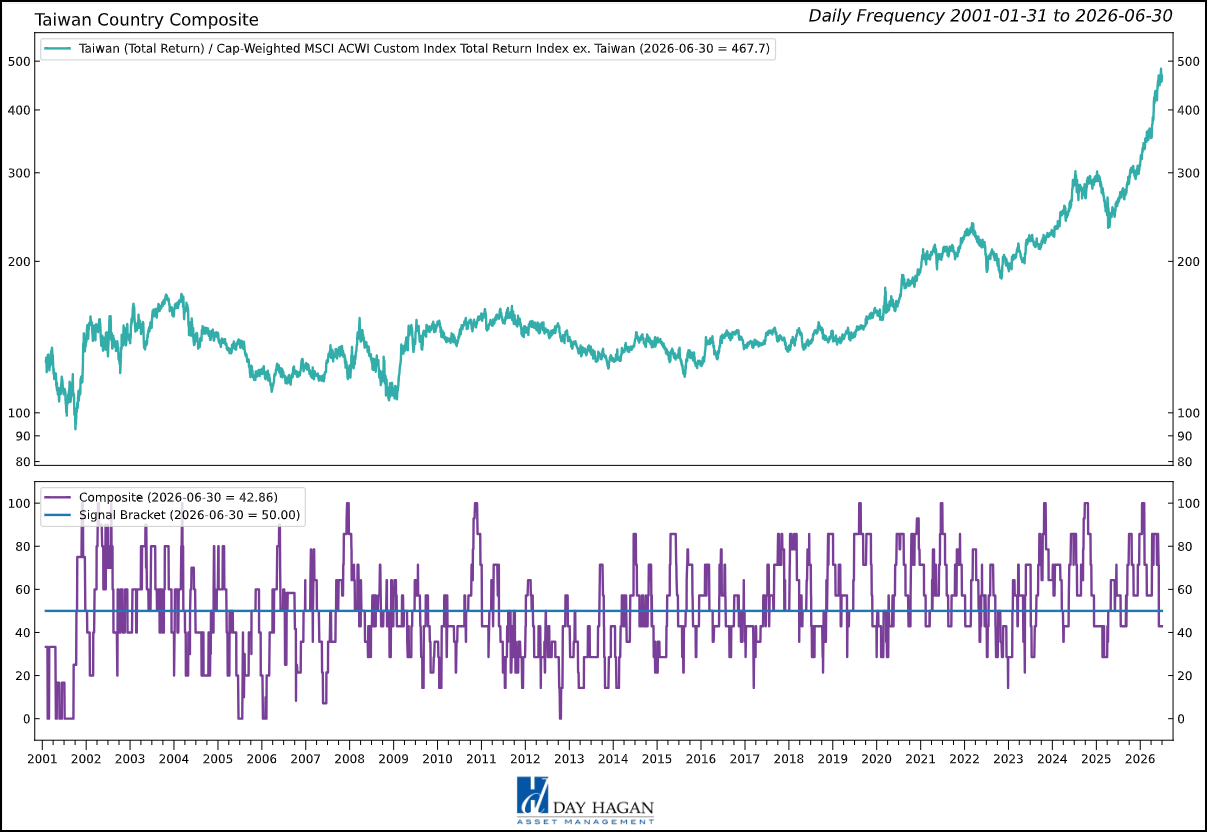
Figure 9: Taiwan’s Composite Model has turned negative, primarily due to mean reversion and trend reversals.
Japan remains overweight. The model has bullish readings from the absolute moving-average cross, relative moving-average cross, valuation, and the yen signal. The main negatives are China sensitivity, forward earnings growth, sentiment reversals, and the ACWI technical scorecard. The MSCI Japan index is at 17.4 times forward earnings, 2.0 times book value, and 12.6 times cash flow. That is not a deep-value market, but it is still potentially reasonable given governance reform, buybacks, and improving capital discipline.
June data supported the overweight. Japan’s flash manufacturing PMI rose to 54.9, services improved to 51.8, and the composite PMI rose to 52.5. The weak yen remains central to the story. It helps exporters and overseas earnings translation, but it also raises import costs for households and businesses. The Bank of Japan still has to move carefully. For investors, Japan continues to offer automation, industrial technology, exporters, financial reform, and shareholder-return momentum. The risk is crowding, yen volatility, and a reversal in China-linked demand.
Figure 10: Forward earnings growth expectations recently showing signs of improvement
Switzerland remains neutral. The country still has a high-quality equity market, but the model is not strong enough for an overweight. Breadth and dividend yield are bullish, moving-average slope and ETF flows are neutral, while trend, short-term momentum, and relative yield are bearish. The MSCI Switzerland index is around 18.4 times forward earnings, 4.2 times book value, and 15.3 times cash flow. Investors are already paying a premium for quality.
Switzerland’s macro profile is steadier than most, but not exciting. Low inflation gives the Swiss National Bank more flexibility than many peers, while the franc remains important for U.S. dollar investors and exporters. The market is driven by healthcare, consumer staples, industrial quality, wealth management, and global revenue exposure. That mix can be valuable when investors want lower cyclicality, but earnings delivery must justify the premium in valuation. A neutral stance keeps exposure to quality without overpaying for defense.
Figure 11: Equity market breadth is constructive. However, a reversal back below the top bracket would generate a sell signal.
United Kingdom remains overweight, though the model is showing signs of stress. The moving-average and price-momentum signals are bearish, but the pound-dollar signal, sentiment, and U.K. OAS readings are bullish. The MSCI U.K. is at 12.3 times forward earnings, 2.3 times book value, and 9.2 times cash flow. Among developed markets, that valuation still stands out.
The June releases were mixed but constructive enough. U.K. inflation held at 2.8% in May, below expectations, while first-quarter GDP was confirmed at 0.6%. That combination keeps the Bank of England cautious, but it also reduces the immediate risk of another inflation surprise. The U.K. offers energy, banks, defense, miners, healthcare, global consumer companies, and dividend income. The pound matters. Currency stability would improve dollar-based returns, while renewed sterling weakness would reduce the appeal. We would stay overweight but focus on global earners and cash-generative franchises.
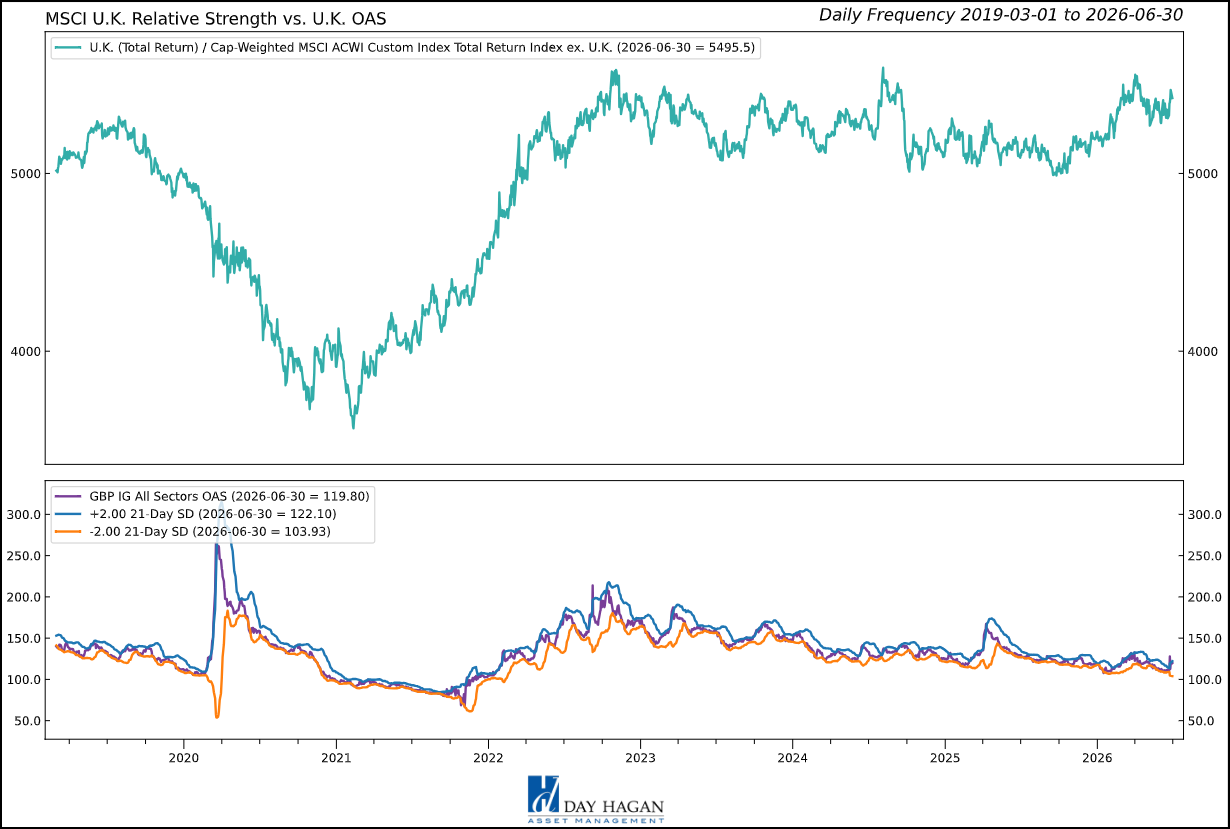
Figure 12: Credit spreads (OAS) widened recently amid rising geopolitical tensions. However, those spreads are potentially reverting, which would be positive for the region.
Emerging Market Positions
Approximately 35% of the strategy is allocated across five markets from a pool of more than 20 smaller markets. Selection is based on a multifactor technical ranking system that uses trend and mean-reversion indicators. The process seeks to identify oversold opportunities in global equity markets that are likely to mean-revert from lower levels and to exhibit mild pullbacks from long-term uptrends.
Current Holdings
Malaysia
Brazil
Peru
Hong Kong
Mexico
Explore Emerging Market Commentary
Malaysia:
Malaysia remains attractive for short-term exposure because it combines reasonable valuation, low inflation, and technology supply-chain exposure without requiring a heroic global growth forecast. The MSCI Malaysia index is at 13.5 times forward earnings, 1.6 times book value, and 10.2 times cash flow. Banks, semiconductors, utilities, energy, and domestic consumer companies give the market a balanced profile.
Data released in June continued to show a steady backdrop. Manufacturing momentum had improved in the latest PMI releases, inflation remained comparatively contained, and Bank Negara Malaysia maintained a steady policy stance. The ringgit is important for U.S. dollar investors because currency stability can turn modest local gains into more useful dollar returns. Malaysia is not a high-beta growth story. It is an EM allocation with potential earnings stability, supply-chain optionality, and lower macro drama than many peers.
Brazil:
Brazil remains one of the more interesting value opportunities, but the June data argued for selectivity rather than enthusiasm. The MSCI Brazil index is at a relatively low 8.0 times forward earnings, 1.8 times book value, and 5.3 times cash flow, making it one of the cheapest markets in the valuation table. That discount can matter if inflation cools, rates move lower, and commodity-linked earnings hold.
The June data showed why the market still deserves a risk premium. Mid-June inflation rose 4.80% from a year earlier, above the central bank target range, while public debt and interest costs remained a concern. The central bank cut the Selic rate again, but policy remains tight. Brazil has strong exposure to banks, energy, materials, utilities, agriculture, and domestic financials. The real is a key swing factor. Currency weakness would reduce the value case for dollar-based investors, while stability could unlock more of the valuation discount.
Peru:
Peru replaces the Philippines in the current Explore holdings. The appeal is different. Peru is not a broad consumer story. It is a valuation, currency, and commodity-sensitive allocation with meaningful exposure to copper, gold, financials, utilities, and domestic infrastructure. The MSCI Peru index is trading at 13.7 times forward earnings, 3.4 times book value, and 17.6 times cash flow. That is not as cheap as Brazil, but the market offers a potentially cleaner commodity linkage.
The June backdrop favored countries with credible policy, low inflation relative to many peers, and exposure to metals tied to electrification and infrastructure. Peru’s sol also matters. A stable currency helps U.S. dollar investors capture local-market gains, while currency weakness can quickly erase them. The main risks are political uncertainty, liquidity risk, commodity price volatility, and dependence on China-linked demand. Peru fits best as a tactical Explore position for portfolios seeking copper and precious-metals sensitivity without making a larger call on Latin American equities.
Hong Kong:
Hong Kong remains a China-linked recovery and valuation option. The MSCI Hong Kong index is trading at 8.7 times forward earnings, 1.5 times book value, and 4.8 times cash flow. That is inexpensive, especially for a market with exposure to banks, insurers, property, exchanges, travel, and China-facing financial activity. The low multiple reflects real concerns, but it also lowers the hurdle for positive surprises.
June data from China were important for Hong Kong. China’s manufacturing PMI returned to expansion at 50.3, and the composite PMI improved to 50.6, helped by AI-linked exports. That can support sentiment toward Hong Kong, but it does not solve the property and domestic-demand problem. Hong Kong’s dollar peg limits currency volatility, which can be useful for U.S. dollar investors, but it also imports U.S.-linked financial conditions. The opportunity is in financial activity, tourism, depressed valuations, and China policy optionality. The risk is that the recovery remains narrow.
Mexico:
Mexico remains in the Explore allocation because the nearshoring story is still valuable, even though the June data were mixed. The MSCI Mexico index is trading at 12.5 times forward earnings, 2.4 times book value, and 9.2 times cash flow. That is a potentially reasonable valuation for exposure to banks, airports, consumer staples, telecom, materials, infrastructure, and North American supply-chain realignment.
The best June data point was inflation. Mexico’s annual inflation slowed to 3.55% in the first half of June, below expectations, while core inflation eased to 4.12%. That gives Banxico more flexibility, though not a green light to turn aggressive. Manufacturing remains the concern. Softer export demand and slower U.S. growth would challenge the nearshoring theme. The peso is critical. A firm peso can improve dollar returns and validate policy credibility, while a weaker peso would raise the bar for local equities. We would favor high-quality banks, airports, consumer franchises, and infrastructure beneficiaries.
Catastrophic Stop Model
The Catastrophic Stop model combines time-tested, objective indicators designed to identify high-risk periods for the equity market. The model entered July recommending a fully invested equity allocation relative to the benchmark.
The weight of the evidence suggests that international equity exposure can remain selective and fully invested at this time. If the model triggers a sell signal below 40% for two consecutive days, indicating more substantial problems, we will raise cash immediately.
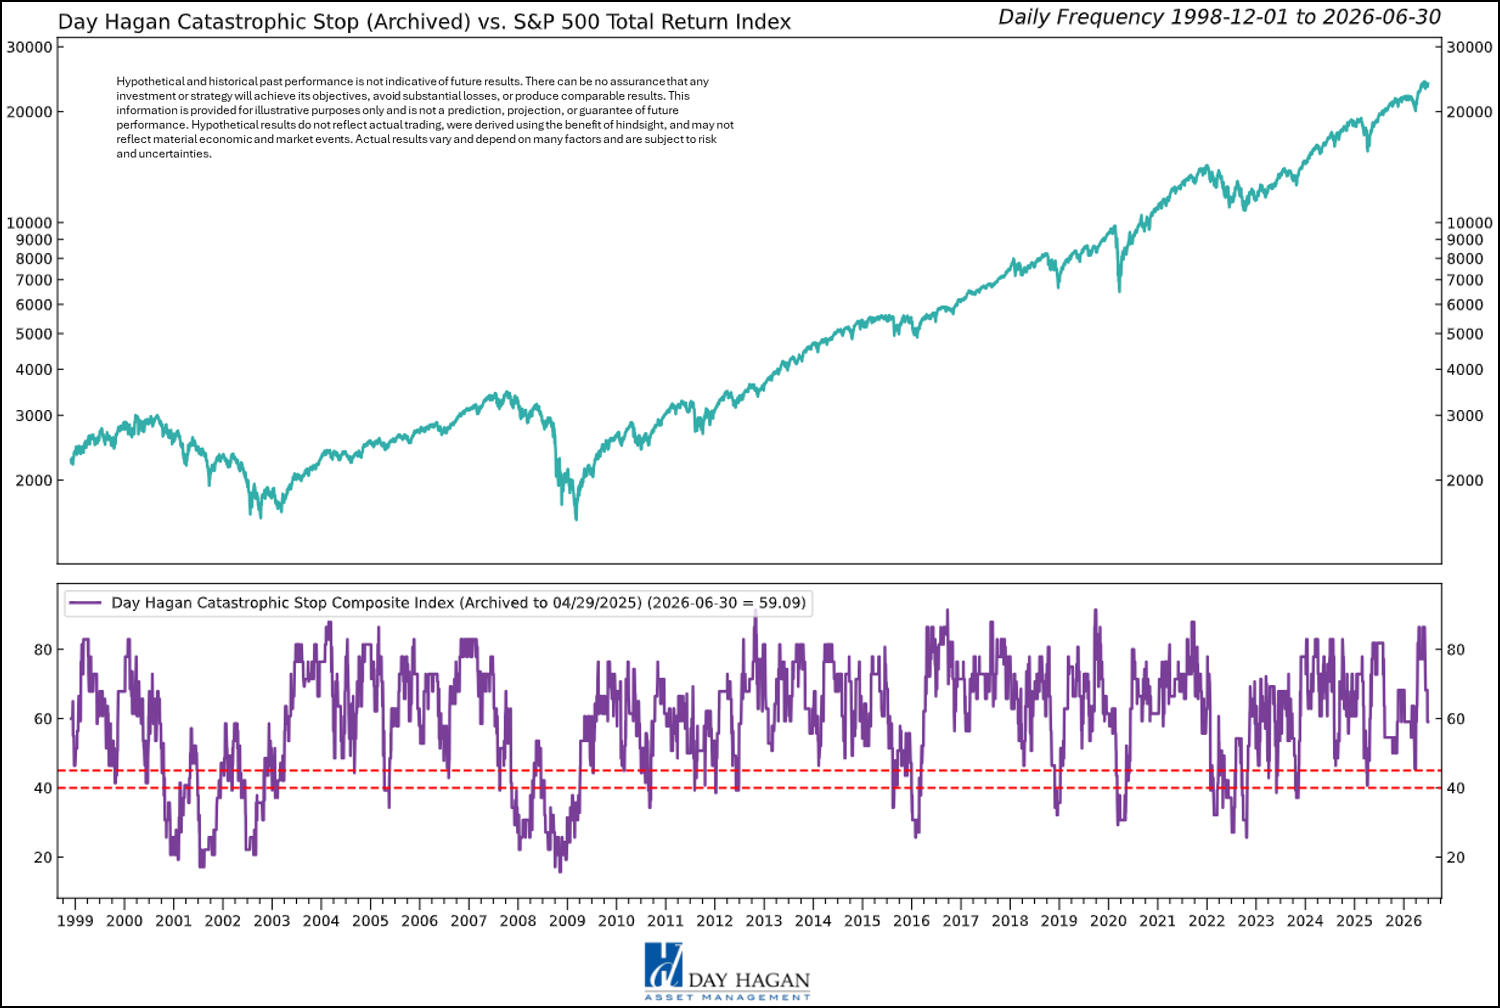
Figure 13: The Catastrophic Stop model recommends a fully invested equity position (relative to the benchmark). Because the model uses indices to extend its history, it is considered hypothetical.
This strategy uses measures of price, valuation, economic trends, liquidity, and market sentiment to make objective, rational, and unemotional decisions about how much capital to risk and where to allocate it.
For more information, please contact us at:
Day Hagan Asset Management
1000 S. Tamiami Trl
Sarasota, FL 34236
Toll Free: (800) 594-7930
Office Phone: (941) 330-1702
Website: https://dayhagan.com or https://dhfunds.com
© 2026 Day Hagan Asset Management
This material is for educational purposes only. Further distribution is prohibited without prior permission. Please see the information on Disclosures and Fact Sheets here: https://dhfunds.com/literature. Charts with models and return information use indices for performance testing to extend the model histories, and they should be considered hypothetical. All Rights Reserved. (© Copyright 2026 Day Hagan Asset Management.)
Day Hagan Smart Sector® International ETF
Symbol: SSXU
Strategy Description
The Smart Sector® International strategy combines three quantitative investment strategies: Core International, Explore International, and Catastrophic Stop.
The Process Is Based On The Weight Of The Evidence
Core Allocation
The fund begins by overweighting and underweighting the largest non-U.S. equity markets based on proprietary models.
Each of the models utilizes market-specific, weight-of-the-evidence composites of fundamental, economic, technical, and behavioral indicators to determine each area’s probability of outperforming the ACWI, for example. U.S. Markets are weighted accordingly relative to benchmark weightings.
Explore Allocation
To select smaller markets, the fund uses a multi-factor technical ranking system to choose the top markets. The markets with the highest rankings split the non-core model allocation equally.
When Market Risks Become Extraordinarily High — Reduce Your Portfolio Risk
The model remains fully invested unless the Catastrophic model is triggered, whereupon the equity-invested position may be trimmed by up to 50%.
The Catastrophic Stop model combines time-tested, objective indicators designed to identify periods of high risk for the broad U.S. equity market. The model uses price-based, breadth, deviation from trend, fundamental, economic, interest rate, behavioral, and volatility-based indicator composites.
When Market Risks Return To Normal — Put Your Money Back To Work
When the Catastrophic Stop model moves back to bullish levels, indicating lower risk, the strategy will reverse toward being fully invested.
Disclosures
The data and analysis contained within are provided “as is” and without warranty of any kind, either express or implied. The information is based on data believed to be reliable, but it is not guaranteed. Day Hagan DISCLAIMS ANY AND ALL EXPRESS OR IMPLIED WARRANTIES, INCLUDING, BUT NOT LIMITED TO, ANY WARRANTIES OF MERCHANTABILITY, SUITABILITY, OR FITNESS FOR A PARTICULAR PURPOSE OR USE. All performance measures do not reflect tax consequences, execution, commissions, and other trading costs, and as such, investors should consult their tax advisors before making investment decisions, as well as realize that the past performance and results of the model are not a guarantee of future results. The Smart Sector® Strategy is not intended to be the primary basis for investment decisions, and the usage of the model does not address the suitability of any particular investment for any particular investor.
Using any graph, chart, formula, model, or other device to assist in deciding which securities to trade or when to trade them presents many difficulties, and their effectiveness has significant limitations, including that prior patterns may not repeat themselves continuously or on any particular occasion. In addition, market participants using such devices can impact the market in a way that changes the effectiveness of such devices. Day Hagan believes no individual graph, chart, formula, model, or other device should be used as the sole basis for any investment decision and suggests that all market participants consider differing viewpoints and use a weight-of-the-evidence approach that fits their investment needs.
Past performance does not guarantee future results. No current or prospective client should assume future performance of any specific investment or strategy will be profitable or equal to past performance levels. All investment strategies have the potential for profit or loss. Changes in investment strategies, contributions or withdrawals, and economic conditions may materially alter the performance of your portfolio. Different types of investments involve varying degrees of risk, and there can be no assurance that any specific investment or strategy will be suitable or profitable for a client’s portfolio. Historical performance results for investment indexes and/or categories generally do not reflect the deduction of transaction and/or custodial charges or the deduction of an investment management fee, the incurrence of which would have the effect of decreasing historical performance results. There can be no assurances that a portfolio will match or outperform any particular benchmark. Comparisons to indices are inherently unreliable indicators of future performance. The strategies used to generate the performance vary from those used to generate the returns depicted in the benchmarks. Investors cannot directly invest in an index.
The information contained herein is provided for informational purposes only and should not be construed as investment advice or a recommendation to buy or sell any security. The securities, instruments, or strategies described may not be suitable for all investors, and their value and income may fluctuate. Past performance is not indicative of future results, and there is no guarantee that any investment strategy will achieve its objectives, generate profits, or avoid losses.
This material is intended to provide general market commentary and should not be relied upon as individualized investment advice. Investors should consult with their financial professional before making any investment decisions based on this information.
The material may contain “forward-looking” information that is not purely historical in nature. Such information may include, among other things, projections, forecasts, estimates of market returns, and proposed or expected portfolio composition. Day Hagan Asset Management, its affiliates, employees, or third-party data providers shall not be liable for any loss sustained by any person relying on this information. All opinions and views expressed are subject to change without notice and may differ from those of other investment professionals within Day Hagan Asset Management or Ashton Thomas Private Wealth, LLC.
Accounts managed by Day Hagan Asset Management or its affiliates may hold positions in the securities discussed and may trade such securities without notice.
Day Hagan Asset Management is a division of and doing business as (DBA) Ashton Thomas Private Wealth, LLC, an SEC-registered investment adviser. Registration with the SEC does not imply a certain level of skill or training.
This material is for educational purposes only. Further distribution is prohibited without prior permission. Please see the information on Disclosures and Fact Sheets here: https://dhfunds.com/literature. Charts with models and return information use indices for performance testing to extend the model histories, and they should be considered hypothetical. All Rights Reserved. (© Copyright 2026 Day Hagan Asset Management.)
All hypothetical results are presented for illustrative purposes only. Back-testing and other statistical analysis is provided in use simulated analysis and hypothetical circumstances to estimate how it may have performed prior to its actual existence. The results obtained from "back-testing" information should not be considered indicative of the actual results that might be obtained from an investment or participation in a financial instrument or transaction referencing the Index. The Firm provides no assurance or guarantee that the products/securities linked to the strategy will operate or would have operated in the past in a manner consistent with these materials. The hypothetical historical levels have inherent limitations. Alternative simulations, techniques, modeling or assumptions might produce significantly different results and prove to be more appropriate. Actual results will vary, perhaps materially, from the simulated returns presented.
© 2026 Day Hagan Asset Management
Definitions:
S&P/ASX 200 – Designed to measure the performance of the 200 largest index-eligible stocks listed on the Australian Securities Exchange by float-adjusted market capitalization.
PMI — A survey-based economic indicator that measures business activity in sectors such as manufacturing and services; readings above 50 generally indicate expansion, while readings below 50 indicate contraction.
CPI — A measure of inflation that tracks changes in the prices consumers pay for goods and services over time.
Core Inflation — Inflation excluding more volatile items, typically food and energy, used to gauge underlying price trends.
Federal Reserve (Fed) — The central bank of the United States, responsible for monetary policy, interest rates, and financial stability.
ECB — The European Central Bank, responsible for setting monetary policy for countries that use the euro.
Bank of Japan (BoJ) — Japan’s central bank, responsible for monetary policy, interest rates, and financial conditions in Japan.
Bank of Canada (BoC) — Canada’s central bank, responsible for setting policy rates and managing inflation and economic stability.
Bank of England (BoE) — The United Kingdom’s central bank, responsible for monetary policy and financial stability.
SNB — The Swiss National Bank, responsible for monetary policy and maintaining price stability in Switzerland.
PBoC — The People’s Bank of China, which manages monetary policy, liquidity, and key lending benchmarks in China.
S&P 500 — A major U.S. stock market index tracking 500 large publicly traded U.S. companies; widely used as a benchmark for the U.S. equity market.
DJIA — The Dow Jones Industrial Average, a price-weighted stock index of 30 large U.S. companies, often used as a headline indicator of the U.S. stock market.
Nasdaq Composite — A stock market index composed largely of companies listed on the Nasdaq exchange, with especially heavy representation from technology and growth stocks.
STOXX 600 — A broad European stock index that tracks 600 large, mid, and small companies across Europe.
Nikkei 225 — A major Japanese stock market index tracking 225 prominent Japanese companies.
TSX — Canada’s main stock market benchmark, often referring to the S&P/TSX Composite Index.
CAC 40 — France’s main stock market index, tracking 40 major French companies.
DAX — Germany’s main stock market index, tracking major German listed companies.
FTSE 100 — The leading U.K. stock market index, tracking 100 large companies listed in London.
Shanghai Composite — A major Chinese stock index tracking stocks listed on the Shanghai Stock Exchange.
Shenzhen Component — A major Chinese stock index tracking companies listed on the Shenzhen Stock Exchange.
ACWI ex-U.S. Index — The MSCI All Country World Index excluding the United States; a benchmark for developed and emerging equity markets outside the U.S.
10-Year Yield — The interest rate paid on a 10-year government bond; a key benchmark for long-term borrowing costs and valuation.
Bund Yield — The yield on German government bonds, often used as a benchmark for euro-area sovereign debt.
Gilt Yield — The yield on U.K. government bonds, commonly called gilts.
OAT Yield — The yield on French government bonds.
Policy Rate — The benchmark interest rate set by a central bank to influence borrowing costs, inflation, and economic activity.
Basis Point (bp) — One one-hundredth of a percentage point; 25 basis points equals 0.25%.
Relative Strength — A measure of how a market, sector, or asset performs compared with another market or benchmark.
Overweight / Underweight / Neutral — Portfolio positioning terms: overweight means above benchmark allocation, underweight means below benchmark allocation, and neutral means roughly in line with the benchmark.
