
Day Hagan Smart Sector® with Catastrophic Stop Strategy Update July 2026
A downloadable PDF copy of the Article:
Day Hagan Smart Sector® with Catastrophic Stop Strategy Update July 2026 (pdf)
Executive Summary
In June, the U.S. equity market became more selective. The first half still belonged to earnings, AI infrastructure, power demand, defense spending, and companies able to protect margins in a higher-cost world. Yet the month also showed that leadership can rotate quickly when rates rise, inflation data firm up, and investors question whether the most crowded growth trades have already been priced in. Health Care and Industrials improved, while Technology remained a core earnings engine but carried more valuation scrutiny.
The data released in June made the bull case more demanding, not weaker. Final first-quarter GDP was revised up to a 2.1% annualized pace, May retail sales rose 0.9%, and S&P Global's June Manufacturing PMI increased to 55.7, the strongest reading since May 2022. Those are not recession numbers. They do, however, describe an economy in which nominal growth, energy costs, supply-chain caution, and AI capital spending are doing much of the work.
Inflation remained the main complication. May CPI, released in June, accelerated to 4.2% year over year from 3.8% in April. Energy inflation rose 23.5%, gasoline surged 40.5%, shelter inflation moved to 3.4%, and core CPI edged up to 2.9%. The May PCE price index rose 4.1% year over year, while core PCE rose 3.4%. The message for markets is straightforward. Earnings are doing enough to support equities, but inflation is doing enough to keep the Fed from helping valuations.
The Federal Reserve held the federal funds target range at 3.50% to 3.75% in June. The new projections were more hawkish than investors wanted, with several officials seeing possible rate hikes rather than cuts. The 10-year Treasury yield finished June near 4.42%, while the 30-year ended near 4.90%. That rate backdrop keeps the strategy focused on sectors where earnings visibility, cash flow quality, pricing power, and durable demand are strong enough to carry their own weight.
Sector
Consumer Discretionary
Consumer Staples
Communication Services
Energy
Financials
Health Care
Industrials
Information Technology
Materials
Real Estate
Utilities
Outlook (relative to benchmark weighting)
Underweight
Underweight
Underweight
Neutral
Underweight
Neutral
Overweight
Overweight
Underweight
Neutral
Overweight
Sector Review
The sector weightings indicate a portfolio built for a narrower, more demanding market. The overweights in Information Technology, Industrials, and Utilities reflect three different sources of support. Technology remains the strongest earnings and AI capital spending engine. Industrials benefit from factory momentum, aerospace, electrical equipment, reshoring, and grid investment. Utilities add income, lower economic sensitivity, and direct exposure to rising power demand from data centers and electrification.
The neutral weights in Energy, Health Care, and Real Estate recognize useful but incomplete setups. Energy has improving relative strength and crude support, but commodity volatility can cut both ways. Health Care has better tactical signals and attractive upside potential, but policy risk and earnings dispersion remain high. Real Estate could respond well to lower yields, but the June rate backdrop and uneven property fundamentals argue against a stronger stance.
The underweights in Consumer Discretionary, Consumer Staples, Communication Services, Financials, and Materials reflect a preference for confirmation over hope. Discretionary faces a consumer whose spending is still positive but increasingly distorted by gasoline and necessities. Staples look defensive but lack enough earnings excitement. Communication Services is powerful but concentrated. Financials remain tied to a difficult yield curve and credit picture. Materials need stronger confirmation of commodity and global demand.
Consumer Discretionary - Underweight
Consumer Discretionary has moved to an underweight. The June indicator mix is mostly negative, with bearish readings in short-term moving averages, price deviation from trend, relative momentum, overbought and oversold measures, net new highs, and forward valuation. Intermediate moving averages, consumer credit, and the 30-year Treasury yield provide some support, but the weight of evidence argues for caution rather than a cyclical chase.
The May retail sales report, released in June, looked strong on the surface with a 0.9% monthly gain. The details were less clean. Gasoline station sales rose 3.4% as energy prices stayed elevated, and retail sales are reported in nominal terms. That means some of the spending strength reflects higher prices rather than a broad improvement in real household demand. Online trade, autos, furniture, and health and personal care were positive, while restaurants and electronics were soft.
This sector can still produce winners, especially companies tied to affluent consumers, digital platforms, travel, and recurring services. The problem is that the sector needs healthier consumers and less pressure from rate increases to justify a larger allocation. With Michigan sentiment still low at 49.5 in June and one-year inflation expectations at 4.6%, we would keep exposure selective and avoid sectors that depend on lower financing costs or gasoline prices.
Figure 1: The Consumer Discretionary sector’s net new highs indicate a negative divergence. (Note: All charts are proprietary to Day Hagan Asset Management.)
Consumer Staples - Underweight
Consumer Staples remain underweight. The sector still offers defensive characteristics, but the indicator mix does not provide enough support for a larger allocation. Relative price momentum and breadth are positive, while the moving-average cross, deviation from trend, net new highs, food sales, food CPI, short interest, and sales-yield signals remain bearish. That is a difficult setup for a sector that usually needs either falling rates, broad risk aversion, or clear pricing power to lead.
June inflation data did not solve the Staples problem. Food inflation moved to 3.1% year over year in May, while the broader CPI accelerated to 4.2%. Those figures can help reported revenues, but they also keep households focused on price and value. Branded food and household product companies may protect margins in the near term, yet volume risk rises when consumers trade down, shift to private label, or reduce basket size.
Staples can still play a stabilizing role during market stress, but the current underweight reflects opportunity cost. In a market rewarding earnings acceleration, capital spending visibility, and productivity themes, the sector lacks enough upward revision power. We would favor companies with clean balance sheets, strong category share, and proven pricing discipline, while avoiding names where sales growth is driven more by inflation than by unit demand.
Figure 2: The Consumer Staples sector is approaching oversold levels.
Communication Services - Underweight
Communication Services moves to underweight. The sector still has important long-term winners, but the June indicator set is clearly negative. The moving-average cross, deviation from trend, yield-curve sensitivity, relative earnings yield, and one overbought/oversold measure are bearish. Only one overbought/oversold signal is positive. That imbalance argues for reducing broad exposure even though select companies remain high-quality compounders.
The main issue is concentration. A large part of the sector's earnings story remains tied to a small number of mega-cap platforms in digital advertising, AI, streaming, and cloud-adjacent businesses. These companies may generate cash flow, but the group is vulnerable when investors question valuations, advertising cyclicality, or the return on AI spending. June market action showed that even dominant franchises can lag when leadership rotates.
A smaller allocation does not mean abandoning the sector. We would emphasize platforms with durable ad share, disciplined content spending, subscription pricing power, and visible free cash flow. We would be more careful with businesses where revenue depends heavily on cyclical ad budgets, weak consumer sentiment, or expensive growth assumptions.
Figure 3: The Communications Services sector has reversed from overbought levels.
Energy - Neutral
Energy is now neutral. The indicator profile is better than many other sectors, with bullish readings from relative strength, overbought and oversold measures, sector breadth, moving-average crossovers, rig counts, crude oil days of supply, and spot price trends. Bearish signals in volatility, crude price bands, and free cash flow yield momentum keep the allocation from moving above benchmark. The sector has support, but it also carries event risk.
The June macro backdrop made Energy more complicated. May CPI showed energy inflation up 23.5% year over year and gasoline up 40.5%, confirming that the sector was still benefiting from the oil shock. By month-end, however, WTI crude had fallen back near $70 as traders priced better supply conditions and reduced war premium. That swing is exactly why a neutral weight makes sense.
Energy can help portfolios if inflation, geopolitical risk, and supply discipline remain central market issues. The offset is that lower oil from extreme levels can quickly remove the revenue tailwind and improve sentiment for other sectors. We would focus on companies with low leverage, strong capital discipline, shareholder return programs, and assets that can generate cash at lower crude prices. Neutral keeps the hedge without overcommitting to a commodity call.
Figure 4: The Energy Sector continues to be supported by low crude inventories.
Financials - Underweight
Financials remain underweight. The sector's indicator profile is mixed but still not attractive enough for a larger allocation. Relative price trend, overbought and oversold conditions, volatility, maximum drawdown, business credit conditions, investment-grade financial spreads, forward earnings yield, and the yield curve are bearish. Momentum, total return trend, economic surprises, the dollar, and loan growth are positive but not enough to lift the sector above the benchmark.
Banks and capital markets firms have solid nominal growth to work with, but June data also reinforced the challenge. The Fed held rates steady at 3.50%-3.75%; several officials saw the possibility of further hikes, and the yield curve signal remained unfavorable. Higher-for-longer policy can help asset yields, but it also raises deposit costs, credit risk, and refinancing pressure for borrowers.
The sector is inexpensive relative to the market, which keeps it interesting at the stock level. The problem is timing. Financials need either a healthier yield curve, better credit confirmation, or stronger capital-market activity to justify a broad overweight. Until then, we would favor high-quality banks with diversified fee income, insurers with pricing power, and exchanges or data businesses with less balance-sheet sensitivity.
Figure 5: The NFIB Small Business Credit Conditions Index shows preliminary signs of tighter credit conditions.
Health Care moves to neutral.
The indicator set is no longer one-sided. Relative strength momentum, momentum reversals, sector trend, maximum relative drawdown, and book yield are bullish. Relative price trend, 100-day breadth, medical CPI, and health-care personal expenditures remain bearish, while health care construction measures are neutral. That mix supports benchmark exposure rather than a defensive underweight.
The June market backdrop improved the relative case. Health Care performed better as investors looked beyond the crowded AI trade and sought earnings quality at more reasonable valuations. The sector also benefits from demand that is less tied to short-term confidence. Even so, the broad group still faces policy risk, reimbursement debates, utilization pressure, and wide dispersion between innovators and challenged service providers.
A neutral weight is a balanced stance. GLP-1s, specialty pharma, tools, select devices, and companies with visible product cycles can still lead. Managed care and lower-margin services require more caution. The sector has enough tactical improvement to warrant a full benchmark position, but not yet enough earnings breadth to justify an overweight.
Figure 6: The Health Care sector is showing signs of renewed upside relative momentum.
Industrials - Overweight
Industrials move to overweight. The June indicator mix turned more supportive, with bullish readings in relative price momentum, relative price trend, sector new lows, cash flow yield, oil sensitivity, and U.S. industrial production. Volatility, RSI, sales yield, commodity momentum, and the dollar remain offsets, while consumer confidence is neutral. The balance now favors participation in the stronger parts of the sector.
The macro data released in June strengthened the case. The final Q1 GDP revision showed real growth at 2.1%, while the June S&P Global Manufacturing PMI rose to 55.7. Production growth accelerated, new orders improved, and factory conditions reached their strongest level since May 2022. This points to a better backdrop for aerospace, electrical equipment, automation, infrastructure suppliers, and companies tied to AI power needs.
The overweight does not require a blanket cyclical view. We would favor aerospace backlogs, defense, grid equipment, power systems, industrial automation, and high-quality reshoring beneficiaries. We would be more careful with transportation, low-margin machinery, and companies exposed to weak consumer confidence or high fuel costs. Industrials now offer one of the cleaner ways to own the physical buildout behind AI and domestic capital spending.
Figure 7: Improving U.S. Industrial Production data supports the Industrials sector.
Information Technology - Overweight
Information Technology remains overweight, but the tone is more disciplined. The sector still has the strongest long-term earnings engine in the market, supported by bullish readings in relative price momentum, one overbought/oversold measure, sales yield, short interest, and earnings revision breadth. Inflation expectations and a second overbought/oversold measure are the main offsets. The sector is still in leadership, but leadership is no longer cheap.
June reinforced both sides of the Technology case. AI infrastructure spending, semiconductors, memory, cloud, networking, and power management remain central to earnings growth. At the same time, higher inflation and a 10-year Treasury yield near 4.42% put more pressure on long-duration growth valuations. The market is increasingly separating companies that convert AI demand into revenue and free cash flow from companies that only attach AI language to the story.
The overweight should be focused, not indiscriminate. Semiconductors, data center infrastructure, profitable software, cybersecurity, and firms with visible productivity gains deserve attention. We would be less tolerant of crowded names where estimates are already stretched or where free cash flow does not keep pace with valuation. Technology remains the portfolio's main growth engine, but it should be owned with valuation discipline.
Figure 8: The Information Technology sector is overbought based on longer-term indicators. A reversal back below the upper bracket would generate a sell signal.
Materials - Underweight
Materials remain underweight. The sector has some encouraging signals, including volatility, emerging-versus-developed equity momentum, natural gas mean reversion, sales yield, and industrial production. The larger problem is that relative price moving averages, price trend, momentum, deviation from trend, copper, silver, gold, and earnings yield are bearish. That mix does not support broad exposure yet.
June's manufacturing data helps, but it does not fully change the conclusion. The S&P Global Manufacturing PMI rose to 55.7, which is constructive for chemicals, packaging, metals, and industrial materials. Still, commodity-linked stocks need stronger confirmation from China demand, global trade, and raw material prices. The June data from China showed factory activity returning to expansion, but the improvement still seemed more tied to AI-related exports than to broad domestic demand.
We would keep Materials exposure selective. Copper, electrification inputs, specialty chemicals, and cost-disciplined producers can work if manufacturing strength persists. The sector as a whole still faces margin risk from energy costs, a strong dollar, uneven global demand, and a weak relative trend. Underweight remains appropriate until price momentum and earnings confirmation improve together.
Figure 9: The Materials sector’s price trend remains subdued.
Real Estate - Neutral
Real Estate is now neutral. The indicator mix is balanced enough to avoid an underweight, but not strong enough to support an overweight. Relative price trend, positive days, deviation from trend, homebuilding, and small-business credit conditions are bearish. Breadth, unemployment data, the 30-year Treasury yield, construction supplies, and the Citi Economic Surprise Index are bullish. The sector is still mostly a rate and balance sheet story.
The June data were mixed. New-home sales data released in June showed the housing market still wrestling with affordability and elevated mortgage rates. At the same time, the 10-year Treasury finished June near 4.42% and the 30-year near 4.90%, which continues to put pressure on REIT discount rates and financing costs. A sharp rate decline would help, but the inflation backdrop makes that harder to count on.
Neutral is the right compromise. Data centers, industrial logistics, select necessity retail, and well-capitalized REITs with contractual rent growth remain attractive. Office, highly leveraged balance sheets, and assets needing near-term refinancing remain vulnerable. The sector can rebound quickly if yields fall, but June's rate and inflation data do not yet justify a larger allocation.
Figure 10: The Real Estate sector is supported by better-than-expected U.S. economic releases (on average) over the last three months.
Utilities - Overweight
Utilities remain overweight. The indicator mix is constructive enough to support the allocation, with bullish readings from relative moving averages, reversals, relative momentum, one overbought/oversold measure, deviation from trend, capacity utilization, and dividend yield. Crude oil, earnings yield relative to the 10-year Treasury, manufacturing PMI, and one breadth measure are the offsets. The sector has become more than a defensive bond proxy.
The fundamental story is increasingly tied to power demand. AI data centers, electrification, grid hardening, and regulated capital spending create a long runway for electric load growth. Capacity utilization remains supportive, and investors continue to reward utilities that can translate higher investment needs into regulated earnings growth. Higher rates are a real headwind, but the earnings visibility is better than in many traditional defensive sectors.
We would favor utilities with constructive regulation, visible rate-base growth, manageable balance sheets, and exposure to regions with data center or industrial power demand. The overweight also adds ballast if market leadership continues to rotate away from crowded growth names. In this environment, Utilities offer a rare combination of income, visibility, and structural growth.
Figure 11: The Utilities sector is showing signs of a relative price reversal.
Catastrophic Stop Update
The Catastrophic Stop model combines time-tested, objective indicators designed to identify high-risk periods for the equity market. The model entered July recommending a fully invested equity allocation relative to the benchmark.
The weight of the evidence suggests that any weakness is unlikely to extend into a significant downtrend at this time. If our model triggers a sell signal (below 40% for two consecutive days), indicating more substantial problems, we will raise cash immediately.
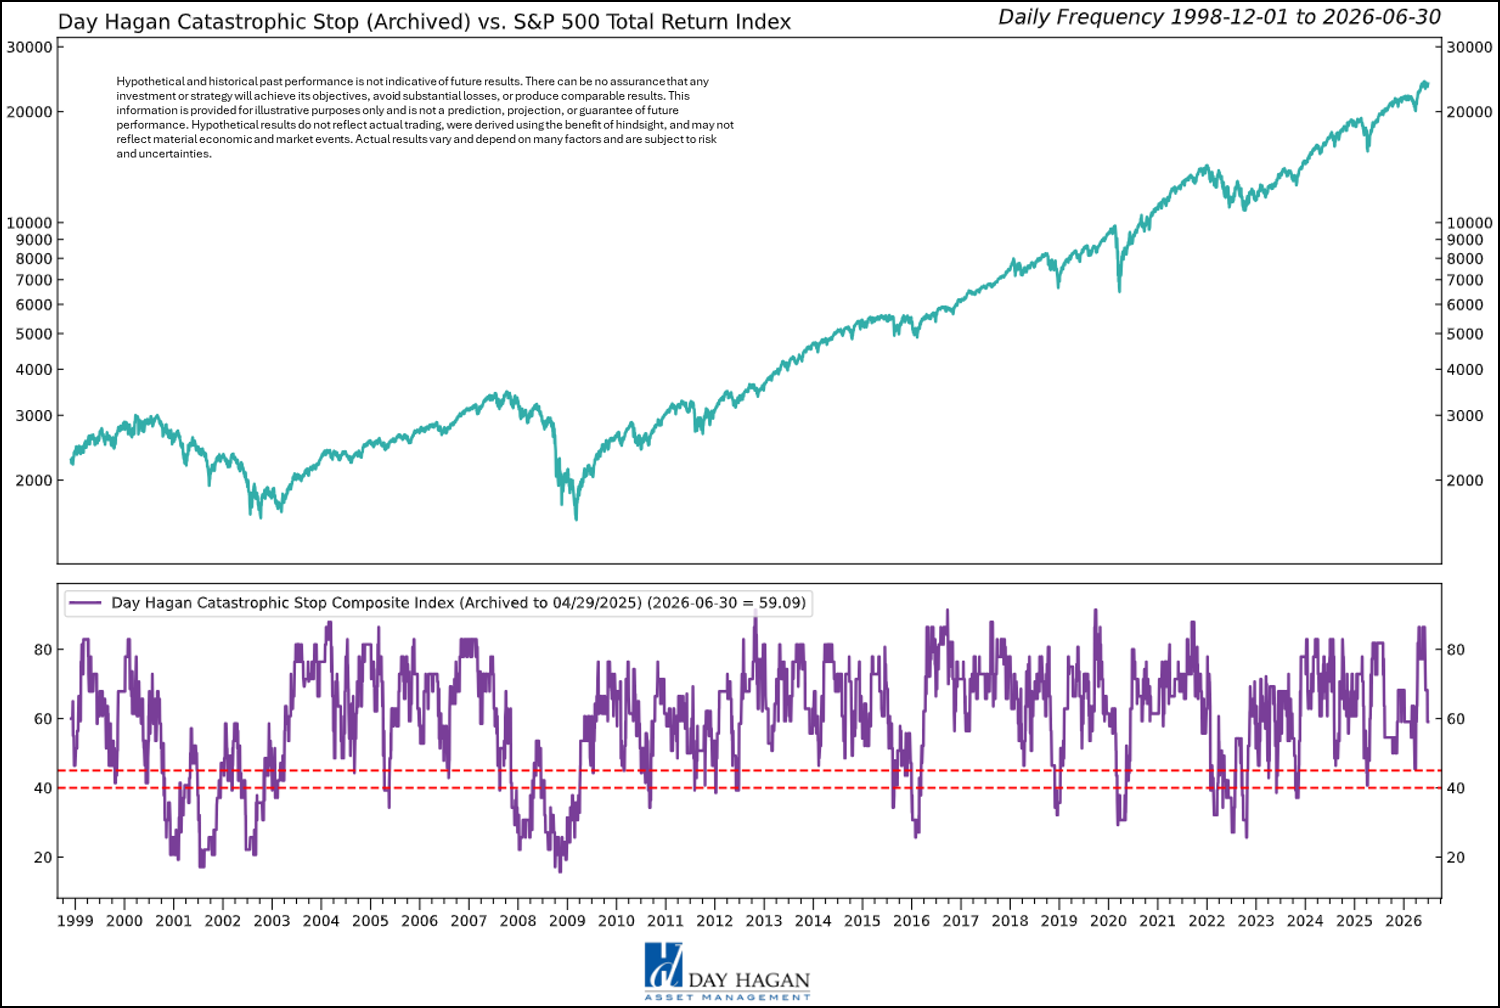
Figure 12: The Catastrophic Stop model recommends a fully invested equity position (relative to the benchmark). Because the model uses indices to extend its history, it is considered hypothetical.
Hypothetical and historical past performance is not indicative of future results. There can be no assurance that any investment or strategy will achieve its objectives or avoid substantial losses or have comparable results. This information is provided for illustrative purposes only and is not a prediction, projection, or guarantee of future performance. Hypothetical results do not reflect actual trading, were derived using the benefit of hindsight, and may not reflect material economic and market events. Actual results vary and depend on many factors and subject to risk and uncertainties.
Our goal is to stay on the right side of the prevailing trend and introduce risk management when conditions deteriorate. Currently, the uptrend remains intact. The broader-based composite models, which call for U.S. and international economic growth, inflation trends, liquidity, and equity demand, remain constructive. The Catastrophic Stop model is positive, and we are aligned with its message. If our models shift to bearish levels, we will raise cash.
This strategy uses measures of price, valuation, economic trends, liquidity, and market sentiment to make objective, rational, and unemotional decisions about how much capital to allocate and where to invest it.
Day Hagan Asset Management
1000 S. Tamiami Trl
Sarasota, FL 34236
Toll Free: (800) 594-7930
Office Phone: (941) 330-1702
Website: https://dayhagan.com or https://dhfunds.com
This material is for educational purposes only. Further distribution is prohibited without prior permission. Please see the information on Disclosures and Fact Sheets here: https://dhfunds.com/literature. Charts with models and return information use indices for performance testing to extend the model histories, and they should be considered hypothetical. All Rights Reserved. (© Copyright 2026 Day Hagan Asset Management.)
Day HaganSmart Sector®
With Catastrophic Stop ETF
Symbol: SSUS
Disclosures
The data and analysis contained within are provided “as is” and without warranty of any kind, either express or implied. The information is based on data believed to be reliable, but it is not guaranteed. Day Hagan DISCLAIMS ANY AND ALL EXPRESS OR IMPLIED WARRANTIES, INCLUDING, BUT NOT LIMITED TO, ANY WARRANTIES OF MERCHANTABILITY, SUITABILITY, OR FITNESS FOR A PARTICULAR PURPOSE OR USE. All performance measures do not reflect tax consequences, execution, commissions, and other trading costs, and as such, investors should consult their tax advisors before making investment decisions, as well as realize that the past performance and results of the model are not a guarantee of future results. The Smart Sector® Strategy is not intended to be the primary basis for investment decisions, and the usage of the model does not address the suitability of any particular investment for any particular investor.
Using any graph, chart, formula, model, or other device to assist in deciding which securities to trade or when to trade them presents many difficulties, and their effectiveness has significant limitations, including that prior patterns may not repeat themselves continuously or on any particular occasion. In addition, market participants using such devices can impact the market in a way that changes the effectiveness of such devices. Day Hagan believes no individual graph, chart, formula, model, or other device should be used as the sole basis for any investment decision and suggests that all market participants consider differing viewpoints and use a weight-of-the-evidence approach that fits their investment needs.
Past performance does not guarantee future results. No current or prospective client should assume future performance of any specific investment or strategy will be profitable or equal to past performance levels. All investment strategies have the potential for profit or loss. Changes in investment strategies, contributions or withdrawals, and economic conditions may materially alter the performance of your portfolio. Different types of investments involve varying degrees of risk, and there can be no assurance that any specific investment or strategy will be suitable or profitable for a client’s portfolio. Historical performance results for investment indexes and/or categories generally do not reflect the deduction of transaction and/or custodial charges or the deduction of an investment management fee, the incurrence of which would have the effect of decreasing historical performance results. There can be no assurances that a portfolio will match or outperform any particular benchmark. Comparisons to indices are inherently unreliable indicators of future performance. The strategies used to generate the performance vary from those used to generate the returns depicted in the benchmarks. Investors cannot directly invest in an index.
The information contained herein is provided for informational purposes only and should not be construed as investment advice or a recommendation to buy or sell any security. The securities, instruments, or strategies described may not be suitable for all investors, and their value and income may fluctuate. Past performance is not indicative of future results, and there is no guarantee that any investment strategy will achieve its objectives, generate profits, or avoid losses.
This material is intended to provide general market commentary and should not be relied upon as individualized investment advice. Investors should consult with their financial professional before making any investment decisions based on this information.
Data and analysis are provided “as is” without warranty of any kind, either express or implied. Day Hagan Asset Management, its affiliates, employees, or third-party data providers shall not be liable for any loss sustained by any person relying on this information. All opinions and views expressed are subject to change without notice and may differ from those of other investment professionals within Day Hagan Asset Management or Ashton Thomas Private Wealth, LLC.
Accounts managed by Day Hagan Asset Management or its affiliates may hold positions in the securities discussed and may trade such securities without notice.
Day Hagan Asset Management is a division of and doing business as (DBA) Ashton Thomas Private Wealth, LLC, an SEC-registered investment adviser. Registration with the SEC does not imply a certain level of skill or training.
There is no guarantee that any investment strategy will achieve its objectives, generate dividends, or avoid losses.
This material is for educational purposes only. Further distribution is prohibited without prior permission. Please see the information on Disclosures and Fact Sheets here: https://dhfunds.com/literature. Charts with models and return information use indices for performance testing to extend the model histories, and they should be considered hypothetical. All Rights Reserved. (© Copyright 2026 Day Hagan Asset Management.)
Definitions
Sector Composite Models — Day Hagan Sector Composite Models use quantitative, rules-based indicators to evaluate relative sector conditions across trend, momentum, valuation, breadth, macroeconomic, and sentiment inputs. The models are designed to support disciplined sector allocation decisions. Hypothetical and historical past performance is not indicative of future results. There can be no assurance that any investment or strategy will achieve its objectives, avoid substantial losses, or have comparable results. This information is provided for illustrative purposes only and is not a prediction, projection, or guarantee of future performance. Hypothetical results do not reflect actual trading, were derived using the benefit of hindsight, and may not reflect material economic and market events. Actual results vary and depend on many factors and are subject to risks and uncertainties.
S&P 500 — A stock market index tracking 500 of the largest publicly traded U.S. companies; commonly used as a benchmark for the overall U.S. equity market.
Dow Jones Industrial Average (DJIA) — A price-weighted stock index of 30 large U.S. companies, often used as a headline measure of the stock market.
Nasdaq Composite — A stock market index that includes thousands of stocks listed on the Nasdaq exchange, with heavy exposure to technology companies.
PMI (Purchasing Managers’ Index) — A survey-based economic indicator that measures business activity; readings above 50 generally indicate expansion, while readings below 50 indicate contraction.
ISM (Institute for Supply Management) Index — A widely followed U.S. manufacturing activity index based on purchasing manager surveys; used to gauge economic momentum.
CPI (Consumer Price Index) — A measure of inflation that tracks changes in the prices consumers pay for goods and services.
Medical CPI — A CPI subcategory that measures inflation specifically in medical care goods and services.
Federal Reserve (the Fed) — The central bank of the United States, responsible for setting monetary policy and influencing interest rates and financial conditions.
Benchmark weighting — The percentage weight a sector or asset has in a benchmark index, used as a reference point for portfolio positioning.
Overweight — A portfolio position above the benchmark weighting, reflecting a more favorable view of that sector or asset.
Underweight — A portfolio position below the benchmark weighting, reflecting a less favorable view of that sector or asset.
Neutral — A portfolio position roughly in line with the benchmark weighting, indicating no strong directional preference.
Sector rotation — A market dynamic in which investors shift money between sectors based on changing economic, interest-rate, or earnings expectations.
Relative strength — A measure of how a stock, sector, or asset performs compared with a benchmark or another asset.
Breadth — A technical measure showing how broadly market participation is spread, such as how many stocks in a sector are advancing or hitting new highs/lows.
RSI (Relative Strength Index) — A technical momentum indicator used to assess whether an asset may be overbought or oversold.
Yield curve — The relationship between yields on short- and long-term Treasury securities; changes in its shape can signal shifts in economic expectations.
10Y-2Y spread — The difference between the 10-year and 2-year U.S. Treasury yields, often used as a quick measure of the yield curve’s steepness.
WTI crude — West Texas Intermediate crude oil, a key U.S. benchmark price for oil.
REITs (Real Estate Investment Trusts) — Companies that own, operate, or finance income-producing real estate and typically trade like stocks.
Communication Services sector: The Communication Services Sector includes telecom and media & entertainment companies, including producers of interactive gaming products and companies engaged in content and information creation or distribution through proprietary platforms.
Consumer Discretionary sector: The Consumer Discretionary sector's manufacturing segment includes automobiles & components, household durable goods, leisure products, and textiles & apparel. The services segment includes hotels, restaurants, and other leisure facilities. It also includes distributors and retailers of consumer discretionary products.
Consumer Staples sector: The Consumer Staples sector includes manufacturers and distributors of food, beverages, and tobacco, as well as producers of non-durable household goods and personal products. It also includes distributors and retailers of consumer staples, including food & drug retailers.
Energy sector: The Energy sector includes companies that operate in the areas of exploration & production, refining & marketing, and storage & transportation of oil & gas and coal & consumable fuels. It also includes companies that offer oil & gas equipment and services.
Financials sector: The Financials sector includes banking, financial services, consumer finance, capital markets, and insurance activities. It also includes Financial Exchanges & Data and Mortgage REITs.
Fixed Income sector: The Fixed Income sector includes investment securities that pay investors fixed interest payments until the maturity date. Designed for income generation and capital preservation, this sector includes government, corporate, and municipal bonds, as well as certificates of deposit (CDs).
Health Care sector: The Health Care sector includes health care providers & services, health care equipment & supplies, and health care technology companies. It also includes companies involved in the research, development, production, and marketing of pharmaceuticals and biotechnology products.
Industrials sector: The Industrials sector includes aerospace & defense, building products, electrical equipment and machinery, and companies that offer construction & engineering services. It also includes providers of commercial & professional services including printing, environmental and facilities services, office services & supplies, security & alarm services, human resource & employment services, research & consulting services. It also includes companies that provide transportation services.
Information Technology sector: The Information Technology sector includes software and information technology services, manufacturers and distributors of technology hardware & equipment such as communications equipment, cellular phones, computers & peripherals, electronic equipment and related instruments, and semiconductors and related equipment & materials.
Materials sector: The Materials sector includes chemicals, construction materials, forest products, glass, paper and related packaging products, and metals, minerals and mining companies, including producers of steel.
Real Estate sector: The Real Estate sector includes companies engaged in real estate development and operation. It also includes companies offering real estate-related services and Equity Real Estate Investment Trusts (REITs).
© 2026 Day Hagan Asset Management