
Day Hagan Smart Sector® Fixed Income Strategy Update July 2026
A downloadable PDF copy of the Article:
Day Hagan Smart Sector® Fixed Income Strategy Update July 2026 (pdf)
Executive Summary
June turned fixed income into a contest between income and inflation. May payrolls, released in June, rose by 172,000, unemployment held at 4.3%, and wage growth cooled to 3.4%. Growth was firm enough to support credit, but not weak enough to make duration an easy call. Inflation was the problem. May CPI rose 4.2%, PCE rose 4.1%, and core PCE climbed to 3.4%.
The June Fed meeting kept the target range at 3.50% to 3.75%. The bigger message came from the projections, where several officials now saw the possibility of hikes this year. That shifted the conversation from when cuts begin to how long policy can stay restrictive. Oil, tariffs, wages, and Middle East risk all remained part of the rate debate.
Treasury yields reflected that tension. The 10-year Treasury ended June near 4.43%, while the 20-year and 30-year Treasuries were near 4.92%. We remain neutral on intermediate and long Treasuries. We still favor U.S. 1-3 Month T-bills because the front end offers attractive income with limited duration risk.
Short-term TIPS remain underweight because inflation protection is useful, but much of the near-term shock may already be priced in. U.S. Mortgage-Backed Securities are overweight as the indicator mix improved and income looks more compelling if rate volatility calms. Floating-rate notes remain underweight because trend readings weakened and the upside from high short rates is less compelling.
Credit remains the more interesting side of fixed income, but the distinction between carry and cushion matters. High-yield remains overweight because risk-appetite and spread-reversal signals still support selective exposure. U.S. corporate bonds remain underweight because aggregate indicators have not confirmed enough strength to offset tight spreads and rate volatility. International corporates remain underweight. Emerging-market USD bonds remain overweight, supported by carry, improving technicals, and better emerging equity momentum.
Holdings
Fixed Income Sector
US 1-3 Month T-bill
US 3-7 Year Treasury
US 10-20 Year Treasury
TIPS (short-term)
US Mortgage-Backed
US Floating Rate
US Corporate
US High Yield
International Corporate Bond
Emerging Market Bond
Outlook (relative to benchmark)
Overweight
Neutral
Neutral
Underweight
Overweight
Underweight
Underweight
Overweight
Underweight
Overweight
Position Details
U.S. Treasuries - The Treasury indicator backdrop remains mixed, which supports a neutral stance across 3-7-year and 10-20-year Treasuries. The U.S. Long Treasury model shows bearish readings from the technical cross and credit default swap signals, a neutral technical momentum reading, and bullish readings from equity-market trend and inflation expectations. Treasuries still matter as portfolio ballast, especially if risk assets stumble, but they are not compelling enough for a broad overweight while fiscal supply, inflation uncertainty, and long-end volatility remain unresolved.
Data released in June sharpened the Treasury debate. May CPI rose 4.2% from a year earlier, core CPI rose 2.9%, May PCE rose 4.1%, and core PCE reached 3.4%. The Fed then held rates at 3.50%-3.75%, while the new projections showed that several officials now see a possible hike this year. That is a very different setup from a classic duration rally. Yields provide income, but the market is still being asked to digest higher inflation, a sticky policy stance, and the possibility that the easing window has moved further away.
The yield curve also tells a story. The 3-month bill ended June near 3.82%, the 5-year near 4.20%, the 10-year near 4.43%, and the 20-year and 30-year at near 4.92%. We still like the front end because it pays investors to wait without taking much duration risk. Intermediate Treasuries warrant a neutral stance because income is useful, but the yield is not cheap enough to ignore inflation risk. Long Treasuries can rally if growth breaks, but that is not our base case. The neutral weight respects both the defensive value and the still-meaningful term-premium risk.
Going forward, watch June payrolls and CPI when released in July, Fed communication, oil prices, breakeven inflation, and auction demand across the long end. A sustained drop in inflation expectations would make duration more attractive. A fresh rise in oil prices, wages, or the term premium would argue for patience.
Figure 1 - A continuation of the reversal lower in inflation expectations could support fixed-income holdings.
U.S. TIPS - The short-term TIPS indicator set remains unfavorable. RSI and high-yield OAS are bullish, but commodity price trends, momentum mean reversion, the moving average cross, and inflation expectations are bearish. That combination argues that inflation protection still has a role, but the timing is not attractive enough for an overweight. The market has already had to price a lot of bad inflation news.
The macro case is real. May CPI rose 4.2% year over year when reported in June, with energy prices up 23.5%, gasoline up 40.5%, and fuel oil up 58.9%. May PCE also moved higher to 4.1%, while core PCE rose to 3.4%. Those numbers are uncomfortable, and they keep inflation protection in the conversation. The issue is that short-term TIPS depend on realized inflation exceeding what is already embedded in breakevens, and that hurdle has moved higher.
Fed policy adds another complication. The June meeting kept rates unchanged, but the dot plot became less friendly to bonds as more officials saw possible hikes. If oil continues to fall after its late-June break, near-term inflation compensation could soften. If inflation remains high, real yields may stay elevated, limiting total returns. TIPS are therefore not a simple buy just because inflation is high. The entry point matters.
For clients, short-term TIPS remain a useful hedge, but not our preferred inflation-sensitive exposure today. We would look for a better setup if breakevens cheapen, real yields stabilize, or the indicator profile improves.
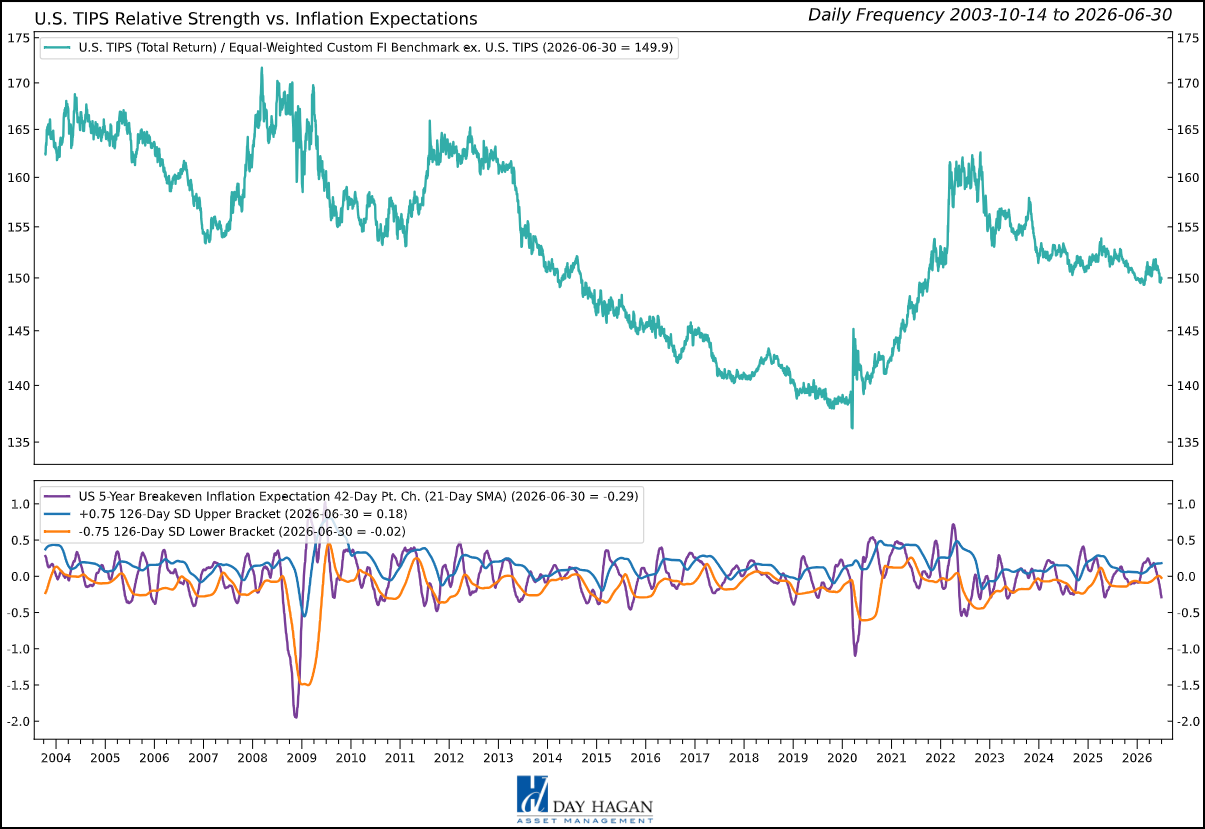
Figure 2 – The reduction in inflation expectations is a potential headwind for TIPS.
U.S. Mortgage-Backed Securities - The MBS indicator set improved enough to support the current overweight. Moving average cross, RSI, the 10-year yield signal, and high-yield OAS are bullish. Relative-strength slope remains bearish, and inflation expectations are neutral. The message is not that MBS are risk-free. It is that the compensation has become more interesting if rate volatility continues to ease and spreads hold in.
The fundamental backdrop is still complicated. Mortgage rates remained high in June, with the MBA 30-year mortgage rate near 6.59% in the week ended June 19. That keeps affordability strained and housing turnover low. At the same time, slower transaction activity can support agency MBS prepayment behavior because fewer borrowers have an incentive or ability to refinance. Higher-quality carry is more valuable when credit spreads are tight, and investors want income without taking deep credit risk.
Rate volatility remains the main watchpoint. The 10-year Treasury finished June near 4.43%, while the 30-year was near 4.92%. If inflation and Fed uncertainty keep long rates jumpy, MBS can still struggle with duration extension and convexity. If oil stabilizes, inflation expectations ease, and Treasury volatility falls, agency MBS could benefit from both income and spread normalization. The overweight is therefore tactical and risk-aware rather than a call that housing has healed.
The sector offers potentially high-quality credit, attractive income relative to Treasuries, and a more constructive mix of indicators. We favor liquid agency exposure and would monitor mortgage rates, MOVE volatility, the Fed's balance sheet policy, prepayment expectations, and housing demand.
Figure 3 – Shorter-term technical improvement evidenced by the 5/50 MACD indicator.
U.S. Floating Rate Notes - The floating-rate note indicators now argue for an underweight. The technical cross, technical momentum, and relative-strength slope are bearish. The OIS swap rate is bullish, and VIX extremes are neutral, but that is not enough to offset the weakening trend. Floating-rate notes still generate income while short rates are high, yet the relative advantage has narrowed as investors can earn attractive yields elsewhere in higher-quality fixed income.
The macro backdrop still supports carry, but it no longer argues for adding aggressively. The Fed held the target range at 3.50% to 3.75% in June, and May inflation data released during the month kept the front end anchored. That helps coupons reset at attractive levels. The challenge is that floating-rate notes may offer less upside if markets begin to price slower growth or if the Fed eventually pauses long enough for rate-cut expectations to return. They hedge against higher front-end rates, but they do not offer much convexity if the cycle turns.
Investor demand for short-duration income remains healthy, but we prefer to be selective. T-bills provide cleaner liquidity, while some spread sectors offer better return potential. Going forward, the key issues are whether energy-driven inflation fades, whether the Fed keeps a hiking bias, and whether the front end continues to compensate investors for limited upside.
Figure 4 - Technical momentum has reversed from previous overbought levels.
U.S. Investment-Grade Corporate Bonds - The U.S. aggregate indicator mix suggests underweighting U.S. corporate exposure. Implied bond volatility and option-adjusted spreads are bearish. Credit default swaps and the technical cross are bullish. The U.S. dollar is neutral, while price mean reversion is bearish. The result is a market with decent income, but not enough spread cushion if rates or growth expectations move against investors.
Corporate fundamentals are not the problem. Large U.S. issuers still benefit from healthy earnings, access to capital, and solid cash-flow coverage. The issue is price. Spreads remain tight relative to late-cycle risk, and the June data did not give the Fed enough confidence to turn dovish. May CPI at 4.2% and core PCE at 3.4% keep all-in yields attractive, but they also keep rate volatility alive. That combination argues for higher-quality exposure rather than a broad reach for spread.
The market is paying investors but offering little room for disappointment. If oil prices remain low and inflation expectations fall, investment-grade corporates could perform well as yield buyers return. If Treasury volatility rises or earnings revisions broaden lower, tight spreads could become a problem quickly. The underweight reflects that asymmetry.
For clients, we prefer issuers with earnings visibility, conservative balance sheets, and maturities that do not depend on a perfect refinancing window. Monitor Treasury yields, primary-market concessions, oil prices, spread volatility, and any deterioration in credit default swap spreads.
Figure 5 – OAS levels have increased over the past 10 days, creating a headwind for U.S. IG Corporates.
U.S. High Yield - High yield remains overweight, but the signal is less one-sided than it was. The technical cross and high-yield bond breadth are bearish. The small-cap equity trend, absolute total-return moving-average cross, VIX moving-average cross, and OAS reversal signals are bullish. That mix still favors income and selective risk-taking, but it also warns against ignoring the narrowing of participation beneath the surface.
Fundamentals remain supportive enough for an overweight. May payrolls, released in June, rose by 172,000, and unemployment held at 4.3%, potentially reducing near-term default risk. Equity markets also continued to support risk appetite, particularly areas tied to AI capital spending and stronger earnings. Higher-quality, high-yield still offers attractive carry in a market where investors want income, and the Catastrophic Stop backdrop remains supportive.
The macro risk is that inflation is not fully cooperating. May CPI rose to 4.2%, May PCE rose to 4.1%, and the Fed held rates steady while some officials projected possible hikes. That matters because refinancing costs remain high for weaker issuers. Private credit stress and payment-in-kind income also deserve attention because they can reveal pressure before it shows in public high-yield spreads.
We remain overweight because income, risk appetite, and several market-based signals remain favorable. We would emphasize higher-quality, high-yield, stronger free cash flow, and issuers with manageable maturity walls. Watch high-yield breadth, small-cap equity trends, default expectations, private credit spillover risk, and whether oil or inflation forces the Fed to stay restrictive.
Figure 6 – Small-cap stock strength is constructive for High-Yield bonds.
International Investment-Grade Corporate Bonds - The indicator set’s message is underweight. Equity risk and VIX are bullish, but the relative-strength slope, moving average cross, option-adjusted spread, and credit default swap signals are bearish. That is a difficult mix for international corporate bonds, especially for U.S.-based investors who must also consider currency moves, hedging costs, and policy divergence.
Europe remains the main caution point. June data showed inflation pressures cooling in some large economies, which helped sentiment, but growth signals remain too narrow to make the credit case compelling. Earlier PMI weakness, energy sensitivity, and uneven demand keep the backdrop fragile. Even if the ECB gains more flexibility later, investors still need better compensation for currency risk and slower regional growth.
The United Kingdom and Japan also add complexity. U.K. gilts remain sensitive to inflation and fiscal expectations, while Japan is dealing with higher domestic yields and currency weakness. For U.S.-based clients, a bond can look attractive in local terms but can deliver a different result once hedging and dollar moves are accounted for. That is why we continue to require stronger confirmation before adding exposure.
We remain underweight international corporate bonds until indicators improve, PMIs stabilize, spreads offer better compensation, and currency risk becomes less of a headwind.
Figure 7 – Credit spreads edging higher indicates some stress may be building.
Emerging Market Bonds - EM USD bonds remain overweight. The indicator mix is supportive, but not without crosscurrents. Emerging equity momentum, the absolute moving-average cross, and the relative-strength moving-average slope are bullish. The EM currency index versus the dollar and commodity strength are bearish. That combination favors USD-denominated EM debt over local-currency exposure because investors can pursue carry while reducing direct currency risk.
Macro conditions are mixed but still investable. Stronger U.S. hiring and sticky U.S. inflation can keep real yields and the dollar firm, which is a headwind for EM. At the same time, the late-June drop in oil prices toward $70 may ease inflationary pressure on importers, while selected exporters still benefit from elevated year-over-year commodity prices. The best opportunities are likely in countries with credible policy, manageable external financing needs, and current-account improvement.
Flows and technicals remain important. Investors continue to seek carry, and EM USD debt can be attractive when developed-market yields are high, but credit conditions are not deteriorating. The risk is that a stronger dollar, weaker demand from China, or renewed geopolitical stress could quickly put pressure on spreads. That is why the overweight should be diversified and disciplined rather than concentrated in the highest-yielding names.
The main risks are U.S. real yields, dollar strength, China-linked demand, commodity weakness, and geopolitical shocks. We favor a diversified EM USD approach, with emphasis on policy credibility, liquidity, and improving external balances.
Figure 8 - Positive EM equity performance often supports EM bond performance.
Catastrophic Stop Model
The Catastrophic Stop model combines time-tested, objective indicators to identify high-risk periods for equities and fixed-income assets that are highly correlated with the equity market. The model entered July recommending a fully invested allocation relative to the benchmark for credit sectors that are highly correlated with equities.
The weight of the evidence suggests that any weakness in equity is unlikely to extend into a significant downtrend at this time. If our model triggers a sell signal (below 40% for two consecutive days), indicating potentially more substantial problems, we will reduce exposure.
Figure 9 - The Catastrophic Stop model recommends a fully invested position (relative to the benchmark). Because the model uses indices to extend its history, it is considered hypothetical.
Hypothetical and historical past performance is not indicative of future results. There can be no assurance that any investment or strategy will achieve its objectives or avoid substantial losses or have comparable results. This information is provided for illustrative purposes only and is not a prediction, projection, or guarantee of future performance. Hypothetical results do not reflect actual trading, were derived using the benefit of hindsight, and may not reflect material economic and market events. Actual results vary and depend on many factors and subject to risk and uncertainties.
Our goal is to stay on the right side of the prevailing trend and introduce risk management when conditions deteriorate. Currently, the uptrend remains intact. The broader-based composite models calling U.S. economic growth, international economic growth, inflation trends, liquidity, and equity demand remain broadly constructive. The Catastrophic Stop model is positive, and we are aligned with the message. If our models shift to bearish levels, we will raise cash and lower exposure to risk-on fixed-income sectors.
This strategy uses measures of price, valuation, economic trends, liquidity, and market sentiment to make objective, rational, and unemotional decisions about how much capital to risk and where to allocate it.
For more information, please contact us at:
Day Hagan Asset Management
1000 S. Tamiami Trl
Sarasota, FL 34236
Toll Free: (800) 594-7930
Office Phone: (941) 330-1702
Website: https://dayhagan.com or https://dhfunds.com
© 2026 Day Hagan Asset Management
This material is for educational purposes only. Further distribution is prohibited without prior permission. Please see the information on Disclosures and Fact Sheets here: https://dhfunds.com/literature. Charts with models and return information use indices for performance testing to extend the model histories, and they should be considered hypothetical. All Rights Reserved. (© Copyright 2026 Day Hagan Asset Management.)
Day Hagan Smart Sector® Fixed Income ETF
Symbol: SSFI
Disclosures
The data and analysis contained within are provided “as is” and without warranty of any kind, either express or implied. The information is based on data believed to be reliable, but it is not guaranteed. Day Hagan DISCLAIMS ANY AND ALL EXPRESS OR IMPLIED WARRANTIES, INCLUDING, BUT NOT LIMITED TO, ANY WARRANTIES OF MERCHANTABILITY, SUITABILITY, OR FITNESS FOR A PARTICULAR PURPOSE OR USE. All performance measures do not reflect tax consequences, execution, commissions, and other trading costs, and as such, investors should consult their tax advisors before making investment decisions, as well as realize that the past performance and results of the model are not a guarantee of future results. The Smart Sector® Strategy is not intended to be the primary basis for investment decisions, and the usage of the model does not address the suitability of any particular investment for any particular investor.
Using any graph, chart, formula, model, or other device to assist in deciding which securities to trade or when to trade them presents many difficulties, and their effectiveness has significant limitations, including that prior patterns may not repeat themselves continuously or on any particular occasion. In addition, market participants using such devices can impact the market in a way that changes the effectiveness of such devices. Day Hagan believes no individual graph, chart, formula, model, or other device should be used as the sole basis for any investment decision and suggests that all market participants consider differing viewpoints and use a weight-of-the-evidence approach that fits their investment needs.
Past performance does not guarantee future results. No current or prospective client should assume future performance of any specific investment or strategy will be profitable or equal to past performance levels. All investment strategies have the potential for profit or loss. Changes in investment strategies, contributions or withdrawals, and economic conditions may materially alter the performance of your portfolio. Different types of investments involve varying degrees of risk, and there can be no assurance that any specific investment or strategy will be suitable or profitable for a client’s portfolio. Historical performance results for investment indexes and/or categories generally do not reflect the deduction of transaction and/or custodial charges or the deduction of an investment management fee, the incurrence of which would have the effect of decreasing historical performance results. There can be no assurances that a portfolio will match or outperform any particular benchmark. Comparisons to indices are inherently unreliable indicators of future performance. The strategies used to generate the performance vary from those used to generate the returns depicted in the benchmarks. Investors cannot directly invest in an index.
The information contained herein is provided for informational purposes only and should not be construed as investment advice or a recommendation to buy or sell any security. The securities, instruments, or strategies described may not be suitable for all investors, and their value and income may fluctuate. Past performance is not indicative of future results, and there is no guarantee that any investment strategy will achieve its objectives, generate profits, or avoid losses.
This material is intended to provide general market commentary and should not be relied upon as individualized investment advice. Investors should consult with their financial professional before making any investment decisions based on this information.
The material may contain “forward-looking” information that is not purely historical in nature. Such information may include, among other things, projections, forecasts, estimates of market returns, and proposed or expected portfolio composition. Day Hagan Asset Management, its affiliates, employees, or third-party data providers shall not be liable for any loss sustained by any person relying on this information. All opinions and views expressed are subject to change without notice and may differ from those of other investment professionals within Day Hagan Asset Management or Ashton Thomas Private Wealth, LLC.
Accounts managed by Day Hagan Asset Management or its affiliates may hold positions in the securities discussed and may trade such securities without notice.
Day Hagan Asset Management is a division of and doing business as (DBA) Ashton Thomas Private Wealth, LLC, an SEC-registered investment adviser. Registration with the SEC does not imply a certain level of skill or training.
This material is for educational purposes only. Further distribution is prohibited without prior permission. Please see the information on Disclosures and Fact Sheets here: https://dhfunds.com/literature. Charts with models and return information use indices for performance testing to extend the model histories, and they should be considered hypothetical. All Rights Reserved.
All hypothetical results are presented for illustrative purposes only. Back testing and other statistical analysis is provided in use simulated analysis and hypothetical circumstances to estimate how it may have performed prior to its actual existence. The results obtained from "back-testing" information should not be considered indicative of the actual results that might be obtained from an investment or participation in a financial instrument or transaction referencing the Index. The Firm provides no assurance or guarantee that the products/securities linked to the strategy will operate or would have operated in the past in a manner consistent with these materials. The hypothetical historical levels have inherent limitations. Alternative simulations, techniques, modeling or assumptions might produce significantly different results and prove to be more appropriate. Actual results will vary, perhaps materially, from the simulated returns presented.
© 2026 Day Hagan Asset Management
Disclosure
Federal Reserve (Fed) — The central bank of the United States, responsible for setting monetary policy and short-term interest rates.
U.S. Treasuries — Bonds issued by the U.S. government; they are widely used as benchmarks for interest rates and as defensive assets in portfolios.
T-bill (Treasury bill) — A short-term U.S. government security, typically maturing in one year or less.
Duration — A measure of a bond’s sensitivity to changes in interest rates; higher duration usually means greater price movement when yields change.
Yield — The income return on a bond, usually expressed as an annual percentage of its price.
Investment-Grade (IG) Corporate Bonds — Corporate bonds with relatively high credit quality and lower default risk than high-yield bonds.
High-Yield (HY) Bonds — Lower-rated corporate bonds that offer higher yields because they carry higher credit risk.
Private Credit — Non-bank lending, often directly to companies, outside the public bond markets.
TIPS (Treasury Inflation-Protected Securities) — U.S. government bonds designed to protect investors from inflation by adjusting principal based on inflation.
Breakeven Inflation Rate — The market’s implied inflation expectation, calculated as the difference between nominal Treasury yields and TIPS yields.
Real Yield — A bond yield after adjusting for inflation; often referenced in connection with TIPS.
Nominal Yield — A bond yield not adjusted for inflation.
Inflation Expectations — The market’s view of future inflation, which influences both bond yields and asset prices.
Mortgage-Backed Securities (MBS) — Bonds backed by pools of home mortgages; investors receive cash flows from underlying mortgage payments.
Agency MBS — Mortgage-backed securities issued or guaranteed by U.S. government-related agencies, generally viewed as having high credit quality.
Floating Rate Notes (FRNs) — Bonds whose interest payments reset periodically based on a short-term reference rate, reducing interest-rate sensitivity.
SOFR (Secured Overnight Financing Rate) — A key U.S. benchmark short-term interest rate used in loans, derivatives, and floating-rate instruments.
OIS (Overnight Index Swap) Rate — A rate derived from swaps tied to overnight interest rates, often used to gauge policy-rate expectations.
Primary Issuance — The sale of new bonds into the market by governments or companies.
Spread — The yield difference between one bond and a benchmark, often used to measure compensation for credit risk.
Option-Adjusted Spread (OAS) — A spread measure that adjusts for embedded bond options, commonly used in corporate bonds and mortgage-backed securities.
Credit Default Swap (CDS) — A derivative contract used to insure against bond default risk; rising CDS levels often signal greater credit concern.
Carry — The return earned from holding a bond or credit asset, assuming market conditions remain stable.
Refinancing Risk — The risk that a borrower will face higher costs or difficulty when replacing maturing debt with new debt.
Emerging Market (EM) Bonds — Debt issued by governments or companies in developing economies.
Hard-Currency Debt — Emerging-market debt issued in a major foreign currency, usually U.S. dollars or euros.
Local-Currency Debt — Emerging-market debt issued in the borrower’s domestic currency, making returns more sensitive to exchange-rate movements.
Risk-On / Risk-Off — Market environments where investors are either more willing to buy riskier assets (“risk-on”) or prefer safer assets (“risk-off”).
RSI (Relative Strength Index) — A technical indicator used to assess whether an asset may be overbought or oversold.
VIX — A widely followed measure of U.S. equity market volatility, often called the market’s “fear gauge.”
