
Day Hagan Smart Sector® International Strategy Update December 2025
A downloadable PDF copy of the Article:
Day Hagan Smart Sector® International Strategy Update December 2025 (pdf)
Executive Summary
Global Equity Performance: A Regional Snapshot
In November, global equity performance diverged across developed markets, driven by varying domestic macroeconomic conditions and central bank policies.
In Europe, performance was mixed. German equities underperformed their French counterparts. German industrial data, including lower factory orders and a sharper rate of manufacturing job cuts, weighed on performance. The European Central Bank (ECB) maintained its focus on combating inflation, with Eurozone Composite PMI data showing output price inflation easing at a slower pace than input costs. French equities demonstrated resilience, outperforming regional peers as its services sector expanded for the first time in over a year, though manufacturing remained a drag. The United Kingdom equity market underperformed most G10 nations, reflecting persistent concerns over sticky domestic inflation and a less accommodative Bank of England posture. The BOE voted 5–4 to maintain the Bank Rate at 4% in early November, balancing risks between inflation persistence and weaker demand. Swiss equities lagged the U.S. market’s performance due to caution, despite a Swiss National Bank board member indicating satisfaction with current rates amid flat inflation.
In the Asia-Pacific region, performance varied significantly. Japanese equities were a strong outperformer within developed Asia, benefiting from a weaker JPY and strong equity momentum. The Bank of Japan (BOJ) had previously shifted its stance away from "ultra-loose" policy, ending negative interest rates in March 2024 and raising rates to 0.5% by January 2025. However, comments from BOJ Governor Ueda hinting at a possible December rate hike further impacted markets, though the overall policy stance remained one of gradual normalization. Chinese equities lagged, underperforming amid ongoing property-sector issues and concerns about softening consumption growth. Australian and Canadian equities offered solid performance, generally outperforming European indices. Both benefited from resilient economic growth despite mixed PMI data, with the Reserve Bank of Australia (RBA) and the Bank of Canada (BoC) holding policy rates steady.
Across the Atlantic, the U.S. equity market showed notable resilience, marginally outperforming several European and Asian benchmarks despite significant mid-month volatility tied to tech sector rotation. Expectations of a potential U.S. Federal Reserve rate cut in December buoyed sentiment late in the month. Overall, countries with favorable monetary policy dynamics or strong commodity exposure tended to outperform, while markets struggling with persistent inflation or idiosyncratic structural issues (China, UK) tended to underperform the broader global equity index. The dispersion in Purchasing Managers' Index (PMI) data across nations highlighted differing economic momentum going into year-end.
Conclusion
In November, global equities' performance was fragmented. The US market showed resilience despite sector rotations. Japan's equities outperformed due to currency trends and central bank normalization, not "ultra-loose" policy. Conversely, the UK and China underperformed due to persistent inflation concerns and structural economic issues, respectively. Commodity-linked markets like Australia and Canada performed solidly. Overall, central bank actions and domestic data divergences were key drivers of relative market performance across G10 nations.
Holdings
Core: Developed Market Positions (approximately 65% of equity holdings)
Country
Australia
Canada
China
France
Germany
Japan
Switzerland
United Kingdom
Outlook
Underweight
Overweight
Overweight
Underweight
Underweight
Overweight
Underweight
Overweight
Explore: Emerging Market Positions (approximately 35% of equity holdings)
Poland
Italy
Singapore
New Zealand
India
Position Details
Core: Developed Market Commentary
Approximately 65% of the strategy is allocated across eight of the largest markets in the ACWI ex-U.S. Index. The fund overweights and underweights the largest non-U.S. equity markets based on macro, fundamental, behavioral, and technical indicators.
Australia: From a quantitative perspective, the MSCI Australia index presents a predominantly bearish technical picture, balanced by some fundamental and tactical strengths. Multiple technical indicators signal caution, including a bearish relative strength index against the adaptive moving average and an absolute moving average cross signal, indicating persistent underperformance relative to the U.S. market. The negative Australian/US interest rate differential further reinforces this bearish relative stance. The overall ACWI technical scorecard also suggests a challenging environment. However, several bullish factors offer counterpoints. The positive relationship between Australian equities and gold prices provides a historical haven correlation that is currently favorable. A bullish reading on beta relative to the ACWI suggests a potential for upside capture in a "risk-on" environment. Fundamentally, a bullish relative earnings yield indicates the market may be undervalued compared to the ACWI, offering a value proposition. The neutral reading of bear-market bounces suggests a lack of extreme oversold conditions. The data suggests a cautious technical outlook, with potential for value-driven recovery if commodity prices remain supportive.
Commentary: The Australian stock market, represented by the ASX, delivered a solid performance, generally outperforming European indices and tracking closely with North American markets. The Reserve Bank of Australia (RBA) maintained its accommodative, though stable, policy stance, keeping interest rates unchanged through the month. This provided a supportive backdrop for equities. GDP growth data indicated a resilient domestic economy, avoiding a sharp slowdown seen in some developed peers. Key drivers included strong performance in commodity-related sectors, which benefited from a stabilization and slight rise in global commodity prices. This contrasted favorably with energy markets, where crude oil futures were generally weak. The Australian dollar (AUD) remained relatively stable against the USD. While some domestic PMI data showed mixed signals in the manufacturing sector, overall consumer and business confidence remained intact. The market's performance was also bolstered by positive domestic labor market data, pointing to ongoing economic strength. Compared to the underperformance in the UK and German markets, Australia presented a more favorable investment profile in November.
Figure 1: Gold stalled last month, which was negative for Australia’s stock market. It now looks to be reversing from oversold lows.
Canada: The MSCI Canada index is leaning toward a bullish technical picture. The majority of technical indicators are positive. The triple moving average diffusion index, mean reversion metrics, absolute moving average cross, and the positive ACWI technical scorecard all suggest strong relative performance and robust market dynamics. However, several external and fundamental factors introduce a bearish counterpoint. The OECD Composite Leading Indicator is bearish, suggesting macroeconomic headwinds or a slowing growth trajectory for Canada's trade partners. The CAD-USD FX rate is also a bearish factor, indicating potential currency weakness that may impact returns for international investors or pressure margins for importers. Furthermore, a bearish relative earnings yield suggests the market may be fully valued compared to the broader ACWI index. This data indicates that while the current technical momentum is strong, fundamental and macroeconomic caution is warranted.
Commentary: The Canadian stock market delivered a solid performance relative to many international peers, particularly European indices. This occurred despite significant intra-month volatility, partially driven by broader tech-sector movements and softening commodity prices. Positive domestic economic signals provided a supportive foundation. The Bank of Canada (BoC) reduced its overnight rate to 2.25% in October, signaling that the easing cycle was nearing its end, which was well received by the market. Late in the month, a strong Q3 GDP report (2.6% annualized) exceeded expectations, shifting market sentiment towards a more cautious BoC approach and supporting the Canadian dollar (CAD). The CAD also tracked the USD higher against other currencies, supported by stabilizing fundamentals. Corporate earnings were mixed, with substantial profits in the financial sector, but other industries faced pressure from moderating demand and persistent trade uncertainties. The overall market outperformed amid underlying economic resilience, with commodity-linked sectors like energy and materials showing strength despite mid-month declines in oil prices. However, PMI data indicated a private sector contraction in November, driven by the service sector and falling new business volumes. Overall, the market navigated mixed signals to post positive relative performance.
Figure 2: Canada’s leading economic indicators are showing signs of improvement.
China: The overall picture is mixed. The negative Purchasing Managers' Index (PMI) reading acts as a strong fundamental headwind, reflecting ongoing economic slowdown concerns and caution among businesses. However, several bullish counter-indicators suggest potential tactical opportunities for mean reversion. The mean reversion indicator is bullish, suggesting the market is oversold. Supportive factors include a bullish reading on the emerging markets currency basket and tightening high-yield credit spreads, which hint at improving credit conditions and risk appetite within the region. The neutral reading of bear-market bounces suggests the market is not in an extreme oversold state. This data indicates a modestly positive stance is warranted, but improving credit conditions and technical oversold signals should be monitored for a potential trend reversal into a risk-on regime.
Commentary: Chinese equities significantly underperformed many global developed and emerging markets in November. The market faced persistent headwinds driven by ongoing structural economic challenges. The People's Bank of China (PBOC) maintained a relatively accommodative monetary policy stance, but specific actions were viewed by markets as insufficient to counteract the prevailing negative sentiment. GDP growth data points continued to soften, amplifying investor concerns about the trajectory of the national economic recovery. The Chinese Yuan (CNY) remained under pressure against the strengthening US dollar. Key performance drags included the ongoing difficulties within the property sector and weaker-than-expected domestic consumption. PMI data released during the month underscored these issues, with both manufacturing and services indices showing contractions or only marginal expansions, indicating softening demand and business confidence. Corporate earnings reports were generally subdued, lacking the robust growth seen in the US or Japanese tech sectors. Compared with resilient performances in the US, Australia, and Canada, the Chinese market lagged considerably, reflecting cautious investor sentiment and a challenging operating environment marked by deflationary pressures and targeted regulatory uncertainty.
Figure 3: Tighter high-yield credit spreads are constructive for risk-on assets, including EM.
France: The MSCI France index presents a predominantly bearish profile, driven by weak technicals and unfavorable valuation metrics relative to the broader ACWI index. The majority of indicators point to caution. Bearish signals include a moving-average cross indicating a downward trend, negative 200-day moving-average breadth, and a low ACWI technical scorecard reading. Furthermore, fundamental and sentiment indicators are also negative: the relative dividend yield is bearish, as are the ACWI valuation scorecard and relative ETF fund flows, suggesting limited investor appetite and potential overvaluation. A few counter-indicators offer minor support. A bullish reading of cross-sectional 50-day price momentum suggests underlying short-term strength or tactical rotation in the market. Additionally, the OECD Composite Leading Indicators reading is neutral, suggesting external economic conditions are not an immediate headwind. Overall, the data imply a challenging environment for French equities relative to global peers, dominated by technical weakness and negative sentiment.
Commentary: The French stock market demonstrated relative strength compared to other major European indices, particularly Germany and the UK. While initial market jitters related to tech stock valuations caused a dip, the CAC 40 ultimately posted marginal gains for the month. Domestic PMI data showed a notable stabilization, with the services sector expanding for the first time in 15 months, offsetting continued weakness in manufacturing. Eurozone inflation remained subdued in France at 0.8%, well below the broader Eurozone average, providing a more favorable environment for consumer spending. The ECB maintained a steady policy rate, and the strengthening euro against the US dollar helped ease inflationary pressures from imported goods. Despite some specific earnings reports triggering selling in individual stocks, the overall CAC 40 performance was stable, benefiting from a modest GDP growth rebound in Q3 2025. This performance profile contrasts with Germany's industrial weakness and the UK's persistent inflation challenges.
Figure 4: International ETF flows have slowed.
Germany: Multiple indicators signal caution. Bearish readings include the ACWI technical scorecard, which indicates a weak overall position, and a negative relative moving-average cross, which confirms a prevailing downward trend against global peers. Fundamentally, low manufacturing confidence suggests ongoing domestic economic challenges, and a bearish relative dividend yield points to lower attractiveness compared to other markets. However, a few factors offer balance. The bullish EUR-USD FX rate could provide a tailwind for German exporters. Several indicators, including 200-day moving-average breadth, bear-market bounces, and ETF fund flows, are neutral, suggesting neither extreme positioning nor a clear directional signal in these areas. Overall, the data imply a challenging environment for German equities, with technical weakness and fundamental concerns outweighing the currency tailwind, warranting a cautious allocation approach.
Commentary: The German stock market, represented by the DAX index, generally underperformed its French and US counterparts. Germany’s performance was constrained mainly by persistent weakness in its export-oriented industrial base. Data released during the month showed a sharp contraction in industrial production and a significant decline in new factory orders, driven by softening global demand. The HCOB Germany Manufacturing PMI remained firmly in contraction territory for the entire month. Inflation data were more favorable, continuing a downward trend that eased pressure on the European Central Bank (ECB) to raise rates, thus providing some stability to the Euro currency. Corporate earnings reports were mixed; while some domestic cyclicals struggled, large multinational exporters leveraged operational efficiencies. Compared to France and the US, the German market lagged, reflecting cautious investor sentiment driven by a lack of clear GDP growth momentum and ongoing concerns about the health of its core manufacturing engine.
Figure 5: German manufacturing confidence rolling over.
Japan: The MSCI Japan index is supported by strong technicals, attractive valuations, and favorable currency dynamics. The majority of indicators signal positive momentum. Bullish signals include a decisive absolute and relative moving average cross, indicating a confirmed uptrend against both its history and global peers. A strong ACWI technical scorecard, attractive valuation metrics, positive sentiment reversals, and a favorable USD/JPY FX rate all contribute to a constructive outlook, which benefits the nation's large, export-oriented economy. However, two key factors warrant caution. A bearish reading on forward earnings growth suggests potential deceleration in future profitability, which could pressure valuations later. Additionally, the negative signal from the China PMI highlights a significant external risk, as a slowdown in China could impact Japanese trade and industrial demand. Overall, the data imply strong current momentum, but a disciplined monitoring of earnings trajectory and external trade conditions is necessary.
Commentary: In November, the Japanese equity market was a standout performer within developed Asia, generally outperforming European and Chinese indices and tracking closely with U.S. markets. The market was significantly driven by positive corporate earnings, which showed strength particularly among large exporters leveraging a relatively weaker Japanese Yen (JPY). The Bank of Japan (BOJ) maintained its short-term policy rate at 0.5%, having exited the ultra-loose policy earlier in the year. BOJ Governor Ueda's comments near month-end, hinting at a potential December rate hike amid persistent inflation above the 2% target, added volatility but confirmed the central bank's commitment to normalization. The currency trend was a key factor, as JPY's performance boosted the competitiveness of major Japanese corporations. Positive GDP data confirmed the economy was on track. The Jibun Bank Japan Composite PMI indicated sustained private-sector expansion, further supporting bullish sentiment. This performance profile contrasted sharply with the more subdued German and UK markets, highlighting Japan's favorable monetary and economic cycle in November.
Figure 6: The Japan sentiment index reversed from pessimism and is now in the optimism zone. We’re monitoring closely for a negative reversal.
Switzerland: Bearish signals dominate the long-term view, including a negative moving average cross signal and a bearish slope in relative strength momentum, indicating a lack of sustained outperformance against global peers. Furthermore, fundamental pressures are evident with bearish readings on the relative dividend yield and the relative nominal 10-year yield, suggesting unattractive valuation or interest rate comparisons. Conversely, several internal metrics are bullish, indicating underlying market strength. A positive 200-day moving average breadth and strong cross-sectional 50-day price momentum suggest a broad-based participation in recent positive price movements. Relative ETF fund flows are neutral, implying no strong immediate directional bias from institutional capital. Overall, the data suggest a market with robust internal dynamics but challenged by valuation and macro factors, warranting a selective and cautious approach to allocation.
Commentary: The Swiss stock market, represented by the SMI, delivered a stable but relatively subdued performance, ultimately lagging the gains seen in the U.S. and Japanese markets. The Swiss National Bank (SNB) maintained its policy rate at 1.5%, providing a steady hand to price stability. Switzerland continued to report very low inflation metrics compared to the broader Eurozone and UK, a key factor in the SNB's neutral stance. The Swiss Franc (CHF) remained firm against the Euro and other G10 currencies, a traditional safe-haven trend that slightly pressured the competitiveness of certain Swiss exporters. Domestic economic data was solid; PMI figures indicated stable, albeit not spectacular, growth. Corporate earnings reports were mainly in line with expectations, with strength in the defensive healthcare and financial sectors offsetting some weakness in cyclicals. Compared to the strong performance dynamics driven by AI momentum in the U.S., the Swiss market's defensive characteristics meant it did not capture the same upside volatility. Its performance profile was more stable and less volatile than that of other European peers, making it a reliable, quality-oriented equity exposure rather than a growth driver.
Figure 7: The relative rise in Switzerland’s nominal 10-year yield is negative.
United Kingdom: The MSCI U.K. index presents a mixed quantitative profile, balancing technical weakness and valuation concerns with several positive sentiment and currency indicators. A primary bearish signal is a relative-strength moving-average cross, indicating persistent underperformance relative to global peers. This is reinforced by a bearish reading on the ACWI Valuation Scorecard, suggesting the market may be less attractively priced compared to other regions. Several bullish counter-signals offer support. Positive cross-sectional price momentum suggests underlying strength within specific market segments. The bullish GBP-USD FX rate provides a currency tailwind for international investors. Favorable readings in the DSI Sentiment index and the U.K. OAS (Option-Adjusted Spread) indicators point to an improving investor mood and stabilizing credit conditions. Overall, the data suggests that while the long-term trend remains challenging, improving sentiment and currency dynamics may provide short-term tactical opportunities or signal a potential inflection point.
Commentary: The United Kingdom equity market generally underperformed most G10 nations, including the US, Japan, and European peers like France. Persistent domestic inflation concerns and a cautious central bank stance heavily influenced performance. The Bank of England (BoE) maintained a firm grip on monetary policy, holding the Bank Rate steady amid stubbornly high inflation. This policy stance supported the Pound Sterling (GBP) but increased pressure on rate-sensitive domestic companies. Economic data points were subdued. The S&P Global/CIPS UK Composite PMI data for November indicated a private sector contraction, driven by both manufacturing and services. This suggested a fragile economic environment with declining new business volumes. Corporate earnings across domestically focused firms were mixed to negative, contrasting sharply with the robust results seen in US technology. The market's overall relative underperformance reflected investor caution regarding the UK's GDP growth trajectory and the ongoing challenge of high operational costs for businesses, making it one of the weaker-performing developed markets for the month.
Figure 8: U.K. technical showing initial signs of improvement.
Emerging Market Positions
Approximately 30% of the strategy is allocated across five markets from a pool of more than 20 smaller markets. Selection is based on a multifactor technical ranking system that uses trend and mean-reversion indicators. The process seeks to identify oversold opportunities within the global equity markets that are likely to mean-revert from lower levels and exhibit mild pullbacks from long-term uptrends.
Current Holdings:
Poland
Italy
Singapore
New Zealand
India
Explore: Emerging Market Commentary
Poland continued to outperform many European and EM peers, supported by substantial recent gains, rising exchange turnover, easing inflation, and earlier rate cuts as growth expectations remained solid. Italy also outperformed euro-area averages, helped by narrowing sovereign spreads and resilient services PMIs against a backdrop of low, stable inflation and steady ECB policy signals. Singapore modestly outperformed regional Asian markets as the MAS maintained an unchanged currency stance, while growth and core inflation showed gradual improvement. New Zealand underperformed developed-market peers, with the NZX50 consolidating after prior gains amid another RBNZ rate cut to support activity and inflation returning toward target. India lagged broader EM benchmarks amid weaker earnings momentum, foreign equity outflows, and currency pressure, offsetting strong GDP growth and elevated PMIs.
Looking ahead to December, several catalysts could shape relative performance across these markets. India’s RBI decision on December 5—expected to be a rate cut—may support sentiment if seen as growth-positive. Euro-area data and the mid-December ECB meeting could influence equity and bond flows into both Italy and Poland. Singapore’s outlook remains tied to currency conditions and regional trade trends, while New Zealand’s equity positioning is sensitive to additional rate-path guidance. Currency movements—particularly if driven by shifting global rate expectations—remain a key factor, especially for India and New Zealand, where foreign-investor flows are more volatile.
Catastrophic Stop Model
The Catastrophic Stop model combines time-tested, objective indicators designed to identify high-risk periods for the equity market. The model entered December recommending a fully invested equity allocation relative to the benchmark.
Based on current model inputs, the strategy does not presently indicate a sustained downturn. Of course, if our model triggers a sell signal (below 40% for two consecutive days), indicating more substantial problems, we will raise cash immediately.
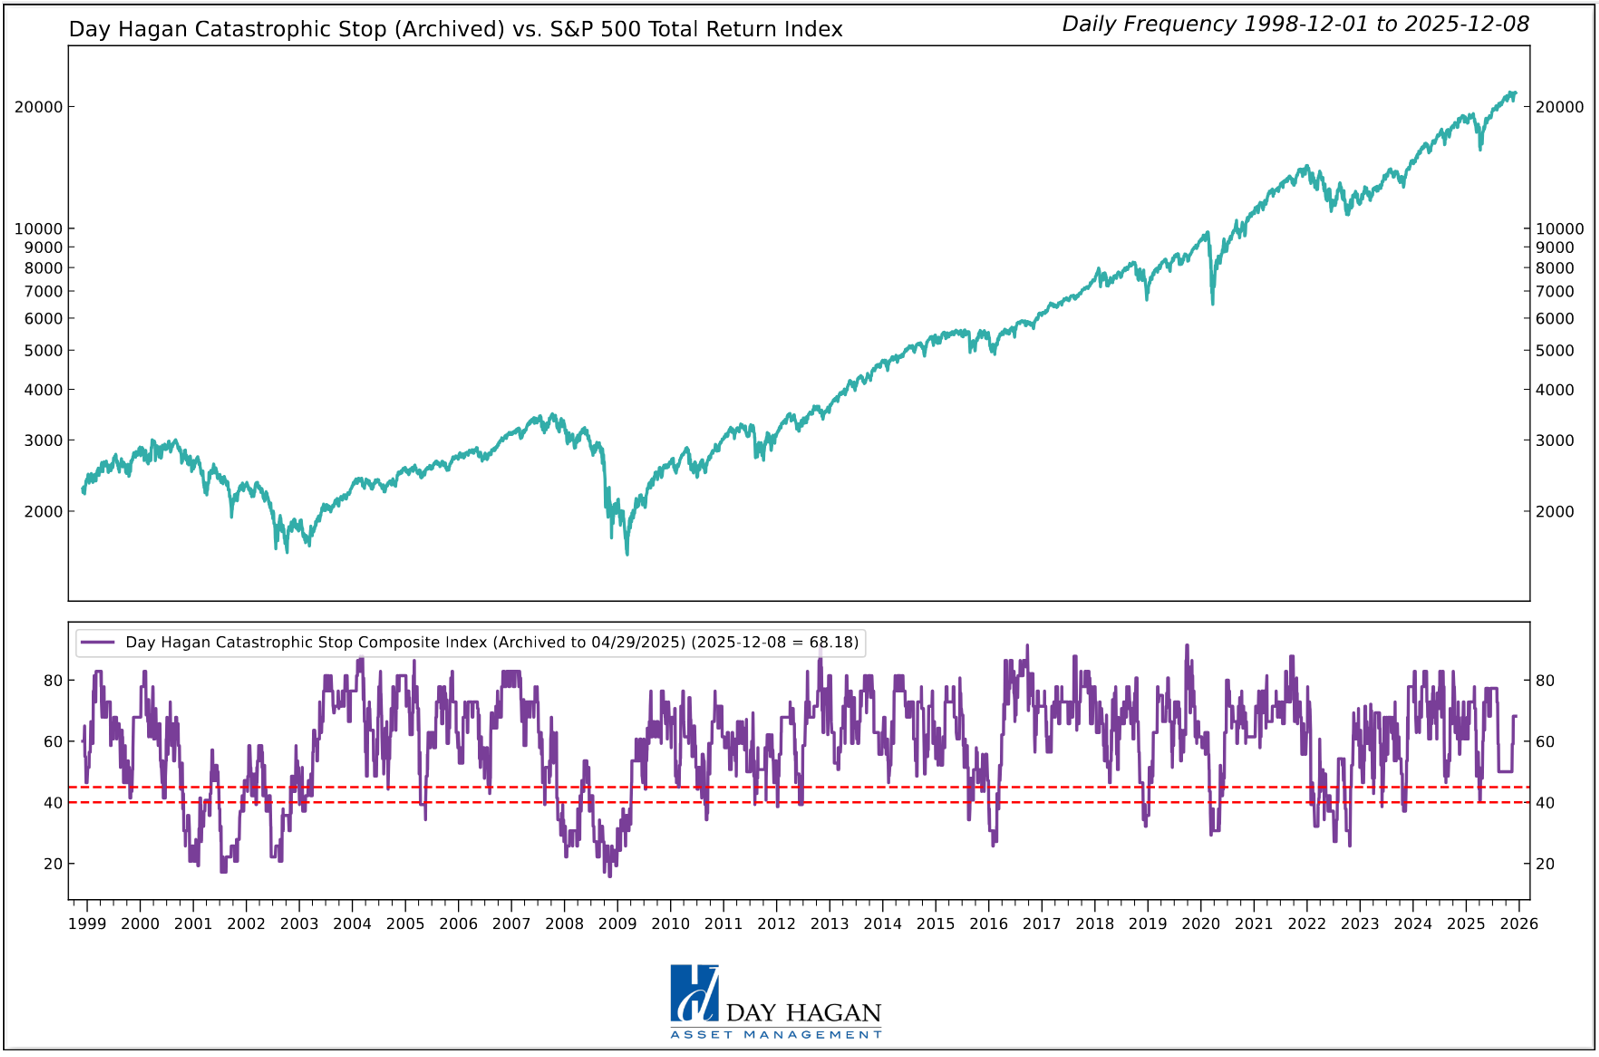
Figure 9: The Catastrophic Stop model recommends a fully invested equity position (relative to the benchmark). Because the model uses indices to extend its history, it is considered hypothetical.
Past performance is not indicative of future results. There can be no assurance that any investment or strategy will achieve its objectives or avoid substantial losses. This information is provided for illustrative purposes only and is not a prediction, projection or guarantee of future performance. Hypothetical results do not reflect actual trading, were derived using the benefit of hindsight, and may not reflect material economic and market events.
The Day Hagan Daily Market Sentiment Composite (part of the Catastrophic Stop Model) remains in the “Excessive Pessimism” zone, reflecting a notable rise in investor caution. Sentiment remains excessively pessimistic based on our short-term model. This is viewed as a net positive from a contrary opinion perspective.
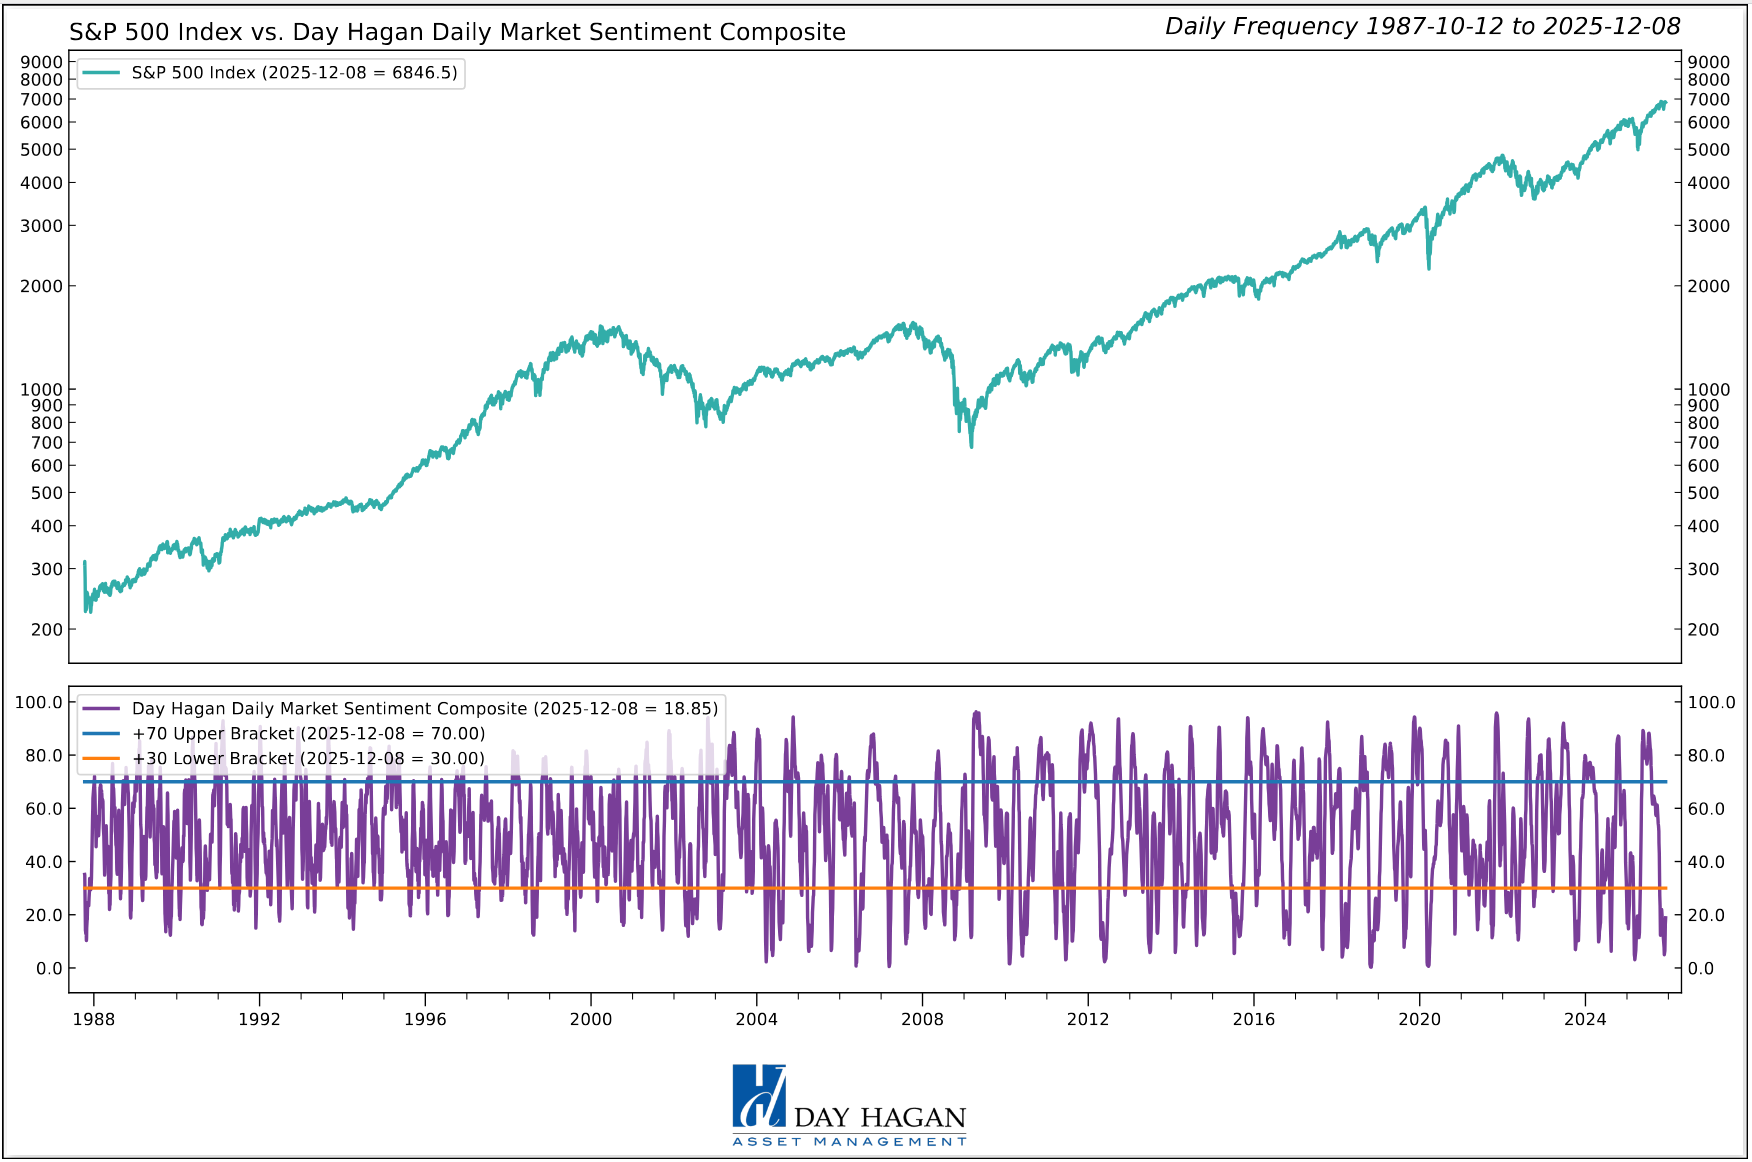
Figure 10: Investor sentiment is being reset, as illustrated by the DH Daily Market Sentiment Composite declining below 70. A reversal back above 30% would enhance the potential for a rally.
This strategy utilizes measures of price, valuation, economic trends, monetary liquidity, and market sentiment to make objective, rational, and unemotional decisions about how much capital to place at risk and where to allocate that capital.
For more information, please contact us at:
Day Hagan Asset Management
1000 S. Tamiami Trl
Sarasota, FL 34236
Toll Free: (800) 594-7930
Office Phone: (941) 330-1702
Website: https://dayhagan.com or https://dhfunds.com
© 2025 Day Hagan Asset Management
This material is for educational purposes only. Further distribution is prohibited without prior permission. Please see the information on Disclosures and Fact Sheets here: https://dhfunds.com/literature. Charts with models and return information use indices for performance testing to extend the model histories, and they should be considered hypothetical. All Rights Reserved. (© Copyright 2025 Day Hagan Asset Management.)
Day Hagan Smart Sector® International ETF
Symbol: SSXU
Strategy Description
The Smart Sector® International strategy combines three quantitative investment strategies: Core International, Explore International, and Catastrophic Stop.
The Process Is Based On The Weight Of The Evidence
Core Allocation
The fund begins by overweighting and underweighting the largest non-U.S. equity markets based on proprietary models.
Each of the models utilizes market-specific, weight-of-the-evidence composites of fundamental, economic, technical, and behavioral indicators to determine each area’s probability of outperforming the ACWI, for example. U.S. Markets are weighted accordingly relative to benchmark weightings.
Explore Allocation
To select smaller markets, the fund uses a multi-factor technical ranking system to choose the top markets. The markets with the highest rankings split the non-core model allocation equally.
When Market Risks Become Extraordinarily High — Reduce Your Portfolio Risk
The model remains fully invested unless the Catastrophic model is triggered, whereupon the equity-invested position may be trimmed by up to 50%.
The Catastrophic Stop model combines time-tested, objective indicators designed to identify periods of high risk for the broad U.S. equity market. The model uses price-based, breadth, deviation from trend, fundamental, economic, interest rate, behavioral, and volatility-based indicator composites.
When Market Risks Return To Normal — Put Your Money Back To Work
When the Catastrophic Stop model moves back to bullish levels, indicating lower risk, the strategy will reverse toward being fully invested.
Disclosures
The data and analysis contained within are provided “as is” and without warranty of any kind, either express or implied. The information is based on data believed to be reliable, but it is not guaranteed. Day Hagan DISCLAIMS ANY AND ALL EXPRESS OR IMPLIED WARRANTIES, INCLUDING, BUT NOT LIMITED TO, ANY WARRANTIES OF MERCHANTABILITY, SUITABILITY, OR FITNESS FOR A PARTICULAR PURPOSE OR USE. All performance measures do not reflect tax consequences, execution, commissions, and other trading costs, and as such, investors should consult their tax advisors before making investment decisions, as well as realize that the past performance and results of the model are not a guarantee of future results. The Smart Sector® Strategy is not intended to be the primary basis for investment decisions, and the usage of the model does not address the suitability of any particular investment for any particular investor.
Using any graph, chart, formula, model, or other device to assist in deciding which securities to trade or when to trade them presents many difficulties, and their effectiveness has significant limitations, including that prior patterns may not repeat themselves continuously or on any particular occasion. In addition, market participants using such devices can impact the market in a way that changes the effectiveness of such devices. Day Hagan believes no individual graph, chart, formula, model, or other device should be used as the sole basis for any investment decision and suggests that all market participants consider differing viewpoints and use a weight-of-the-evidence approach that fits their investment needs.
Past performance does not guarantee future results. No current or prospective client should assume future performance of any specific investment or strategy will be profitable or equal to past performance levels. All investment strategies have the potential for profit or loss. Changes in investment strategies, contributions or withdrawals, and economic conditions may materially alter the performance of your portfolio. Different types of investments involve varying degrees of risk, and there can be no assurance that any specific investment or strategy will be suitable or profitable for a client’s portfolio. Historical performance results for investment indexes and/or categories generally do not reflect the deduction of transaction and/or custodial charges or the deduction of an investment management fee, the incurrence of which would have the effect of decreasing historical performance results. There can be no assurances that a portfolio will match or outperform any particular benchmark. Comparisons to indices are inherently unreliable indicators of future performance. The strategies used to generate the performance vary from those used to generate the returns depicted in the benchmarks. Investors cannot directly invest in an index.
The information contained herein is provided for informational purposes only and should not be construed as investment advice or a recommendation to buy or sell any security. The securities, instruments, or strategies described may not be suitable for all investors, and their value and income may fluctuate. Past performance is not indicative of future results, and there is no guarantee that any investment strategy will achieve its objectives, generate profits, or avoid losses.
This material is intended to provide general market commentary and should not be relied upon as individualized investment advice. Investors should consult with their financial professional before making any investment decisions based on this information.
The material may contain “forward-looking” information that is not purely historical in nature. Such information may include, among other things, projections, forecasts, estimates of market returns, and proposed or expected portfolio composition. Day Hagan Asset Management, its affiliates, employees, or third-party data providers shall not be liable for any loss sustained by any person relying on this information. All opinions and views expressed are subject to change without notice and may differ from those of other investment professionals within Day Hagan Asset Management or Ashton Thomas Private Wealth, LLC.
Accounts managed by Day Hagan Asset Management or its affiliates may hold positions in the securities discussed and may trade such securities without notice.
Day Hagan Asset Management is a division of and doing business as (DBA) Ashton Thomas Private Wealth, LLC, an SEC-registered investment adviser. Registration with the SEC does not imply a certain level of skill or training.
There is no guarantee that any investment strategy will achieve its objectives, generate dividends, or avoid losses.
This material is for educational purposes only. Further distribution is prohibited without prior permission. Please see the information on Disclosures and Fact Sheets here: https://dhfunds.com/literature. Charts with models and return information use indices for performance testing to extend the model histories, and they should be considered hypothetical. All Rights Reserved. (© Copyright 2025 Day Hagan Asset Management.)
All hypothetical results are presented for illustrative purposes only. Back-testing and other statistical analysis is provided in use simulated analysis and hypothetical circumstances to estimate how it may have performed prior to its actual existence. The results obtained from "back-testing" information should not be considered indicative of the actual results that might be obtained from an investment or participation in a financial instrument or transaction referencing the Index. The Firm provides no assurance or guarantee that the products/securities linked to the strategy will operate or would have operated in the past in a manner consistent with these materials. The hypothetical historical levels have inherent limitations. Alternative simulations, techniques, modeling or assumptions might produce significantly different results and prove to be more appropriate. Actual results will vary, perhaps materially, from the simulated returns presented.
© 2025 Day Hagan Asset Management
