
Day Hagan Smart Sector® Fixed Income Strategy Update December 2025
A downloadable PDF copy of the Article:
Day Hagan Smart Sector® Fixed Income Strategy Update December 2025 (pdf)
Executive Summary
In November, global fixed-income markets saw modest gains, with bond prices generally rising and yields falling in response to continued central bank rate cuts. For instance, the Bloomberg US Aggregate Bond Index gained 0.6% as the 10-year Treasury yield dropped from 4.16% to 4.11%. This positive momentum was built on a year of significant policy shifts, including over 120 rate cuts by global central banks, signaling a focus on growth. Investment-grade and high-yield corporate bonds outperformed, supported by solid corporate fundamentals and supportive financing conditions. Meanwhile, geopolitical and trade tensions, along with fiscal deficits, heightened volatility and contributed to inflation, particularly in Europe.
Looking ahead to December, several key factors will influence global fixed-income markets. Investors will be keenly watching for the Federal Reserve's December meeting. Following rate cuts in September and October, markets are anticipating another potential cut, though officials have suggested it is not guaranteed. Broader economic data, particularly labor market and inflation figures that the recent U.S. government shutdown may have delayed, will be critical for shaping policy expectations. The performance of emerging markets will also be a focus, as they face headwinds from potential new U.S. trade policies but may also see continued strong domestic demand and opportunities in selective countries. Tight credit valuations and higher issuance, driven by corporate capital expenditure, are also potential risks to monitor.
Holdings
Fixed Income Sector
US 1-3 Month T-bill
US 3-7 Year Treasury
US 10-20 Year Treasury
TIPS (short-term)
US Mortgage-Backed
US Floating Rate
US Corporate
US High Yield
International Corporate Bond
Emerging Market Bond
Outlook (relative to benchmark)
Overweight
Neutral
Neutral
Neutral
Neutral
Underweight
Neutral
Neutral
Underweight
Modestly Overweight
U.S. Treasuries: Analysis of the current data set indicates a mixed signal environment. Positive indicators include bullish momentum relative to technical crosses and credit default swaps, suggesting a period of potential price stability or appreciation. Conversely, the asset class faces headwinds from bearish signals in relative strength, technical momentum, and inflation expectations. Indicators calling fixed income vs. equity market trends remain neutral, suggesting no clear directional correlation based on current data inputs. These divergent signals necessitate a tactical approach. We are currently overweight at the shorter end of the curve.
Commentary: In November, the performance of U.S. Treasuries was shaped mainly by evolving monetary policy expectations and a cautious economic outlook. Bond prices moved upward, and yields decreased across most maturities, reversing some of the prior month's yield increases. This positive shift was driven by the Federal Reserve's continued commitment to an accommodative stance, with two prior rate cuts in the fall signaling a proactive approach to managing growth concerns. Key factors influencing this performance included ongoing worries about global trade stability and geopolitical tensions, which drove a flight-to-safety bid for U.S. sovereign debt. Additionally, the market digested substantial supply from government auctions to fund persistent fiscal deficits without significant disruption, as demand remained robust. Looking ahead to December, the primary influence will be the outcome of the final FOMC meeting of the year. Markets are pricing in a high probability of a third consecutive rate cut, a move that would likely continue to support bond prices. However, unexpected inflation data or any hawkish shift in Fed communication could quickly reverse this trend. Furthermore, the market will scrutinize incoming U.S. labor and inflation reports, which were previously delayed by a temporary government shutdown, for clearer direction on economic health and the future policy trajectory.
Figure 1: CDS rates are potentially reversing, indicating that fear of a significant market disruption is fading.
U.S. TIPS: Current data are conflicting. Positive indicators show bullish relative strength against technical RSI, commodity price trends, and moving average crosses, suggesting a robust short-term outlook. In contrast, several bearish signals impact the asset class. These include negative relative strength versus momentum mean reversion, high-yield option-adjusted spreads (OAS), and inflation expectations. This divergence between technical strength and fundamental/credit metrics suggests increased volatility ahead, necessitating a data-driven risk management framework for portfolio allocation decisions.
Commentary: U.S. Treasury Inflation-Protected Securities (TIPS) delivered a positive return in November, buoyed by market expectations of persistent inflationary pressures despite a softening economic backdrop. While nominal Treasury yields declined, the real yield component of TIPS also fell, contributing to price appreciation. This strong performance was primarily driven by rising breakeven inflation rates—the difference between TIPS and nominal Treasury yields—as investors increased their expectations for future price growth. A key factor was the ongoing global supply chain volatility and elevated energy prices resulting from persistent geopolitical tensions. These elements overshadowed the Federal Reserve's recent rate cuts, leading investors to seek inflation protection. For December, TIPS performance will hinge heavily on the upcoming U.S. inflation data releases, notably the Consumer Price Index (CPI) report, which was delayed from November. A stronger-than-expected inflation print could likely push breakevens higher, further supporting TIPS. Conversely, any indication that the Fed might pause its easing cycle could temper inflation expectations and weigh on the asset class. The December FOMC meeting guidance will be critical in shaping investor sentiment regarding the short-term inflation outlook.
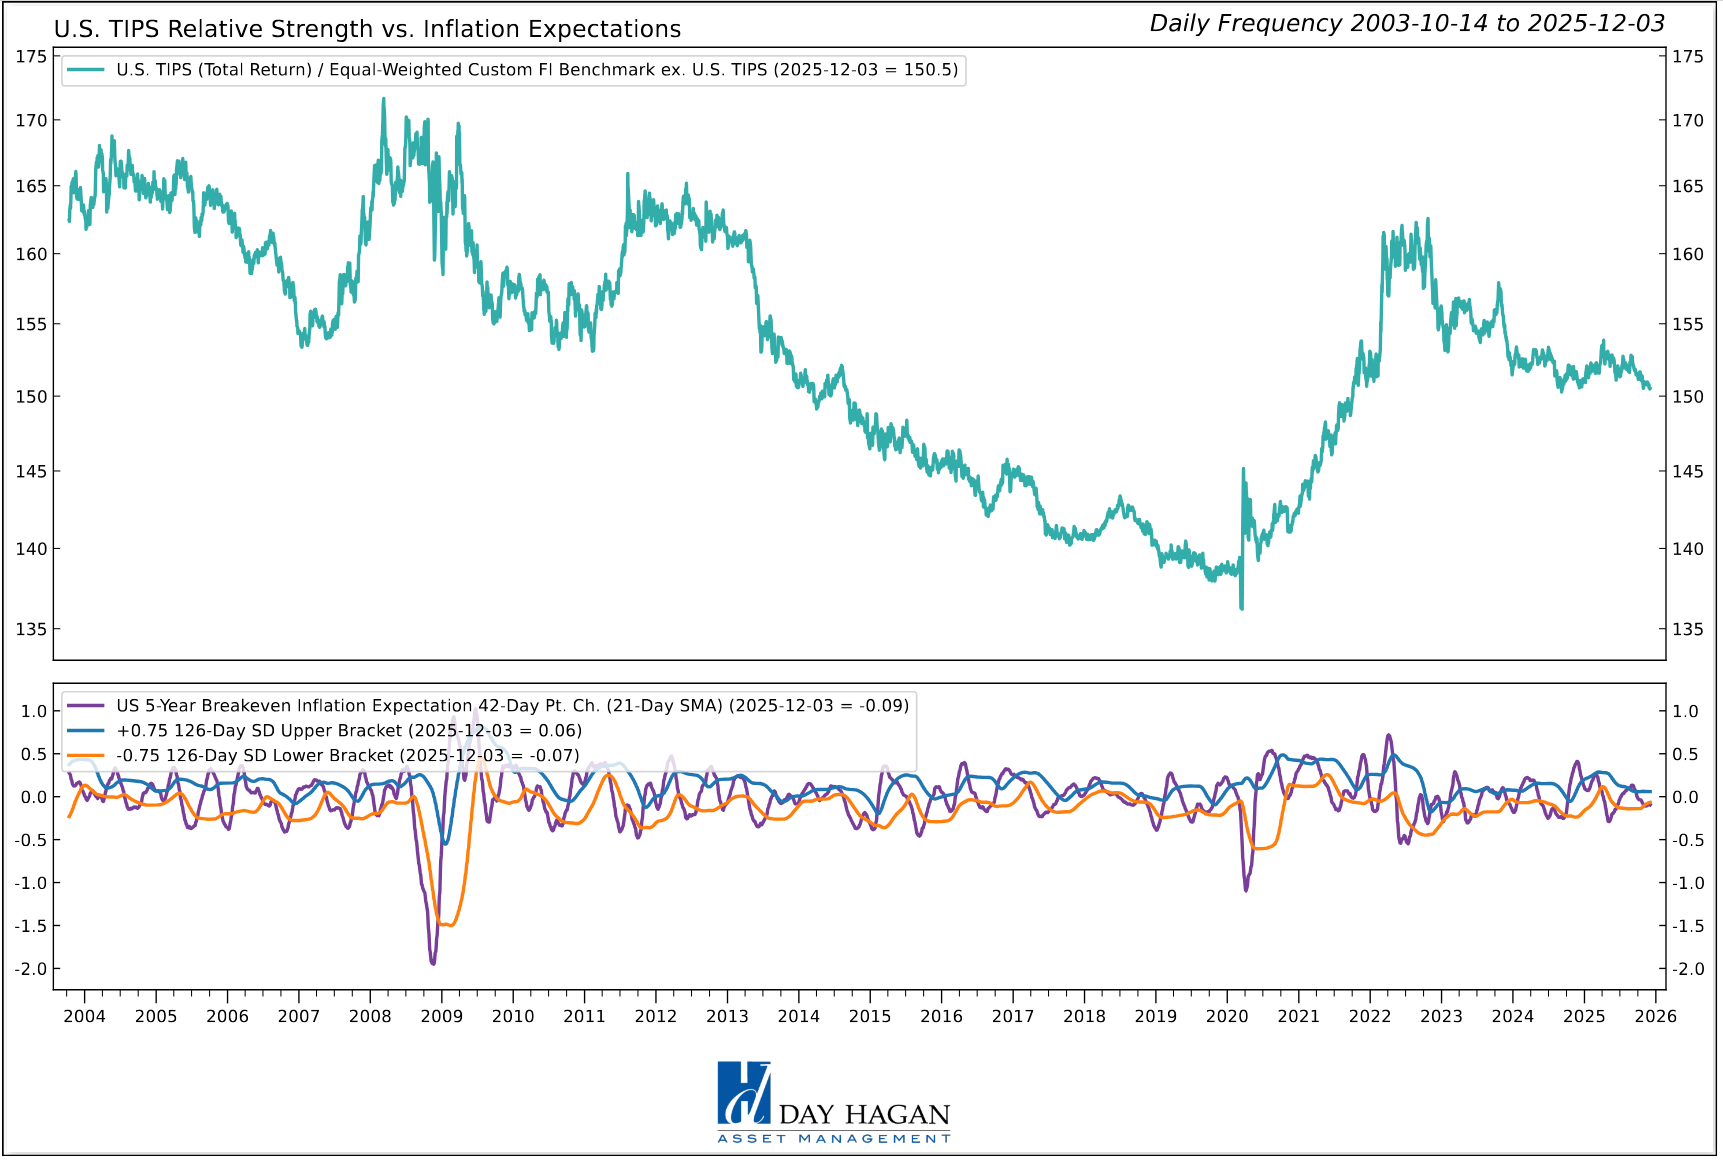
Figure 2: Inflation expectations are subdued in the longer term. Negative for TIPS.
U.S. Mortgage-Backed Securities: Indicators for U.S. Mortgage-Backed Securities (MBS) show a predominantly bullish signal set. Positive indicators include bullish relative strength against moving-average crosses, RSI, the 10-Year Yield, the RS Slope, and inflation expectations. This suggests strong technical and correlation support for the asset class. The sole negative input is a bearish relative strength reading versus High Yield Option-Adjusted Spreads (HY OAS), indicating a minor divergence in credit market sentiment. Overall, quantitative models point to constructive positioning for MBS based on these inputs.
Commentary: MBS posted positive returns in November, benefiting from the broader rally in U.S. Treasuries as interest rates decreased. The asset class posted gains, though it modestly lagged equivalent-duration Treasuries amid ongoing sector-specific challenges. A significant factor influencing performance was the duration extension, as lower mortgage rates reduced the incentive for homeowners to refinance, leading investors to wait longer for principal repayments. This limited some of the upside potential compared to standard government bonds. The primary issue was the tight correlation with a volatile housing market, which is navigating high home prices and low inventory. Geopolitical uncertainty and a flight to quality provided some support for the sector overall. In December, MBS performance will be highly sensitive to the Federal Reserve's messaging on quantitative easing and potential future rate cuts. Any indication that the Fed might adjust its substantial holdings of MBS could increase volatility and impact valuations. Additionally, housing starts and existing home sales data released in December will be scrutinized for signs of market stability, which will dictate future prepayment speeds and thus influence MBS pricing.
Figure 3: Technicals supporting MBS.
U.S. Floating Rate Notes: FRNs are showing some encouraging indicators. Bullish signals include positive relative strength readings against technical crosses, technical momentum, RS slope percentage, and the OIS swap rate. This broad strength suggests robust performance potential in the current rate environment. The only dissenting indicator is a bearish signal in relative strength versus VIX extremes, indicating potential sensitivity to sudden spikes in market volatility. Overall, the aggregated data suggests a favorable technical position for the asset class.
Commentary: U.S. Floating Rate Notes (FRNs) provided stable performance, acting as a defensive holding in a period of declining fixed rates. Unlike fixed-coupon bonds, which appreciated as yields dropped, FRNs maintained their principal value relatively consistently. Their performance was a function of the underlying short-term interest rates to which they are benchmarked. As central banks initiated rate cuts, FRN coupons gradually reset lower throughout the month, reflecting the new interest rate environment. A key factor was the low interest-rate sensitivity (duration) of these securities, making them attractive to investors concerned about potential interest-rate volatility or a sudden reversal in central bank policy. The strong credit quality of most U.S. FRN issuers provided an additional safety buffer. Looking to December, the primary influence will be the Federal Reserve's next policy decision. While further rate cuts are anticipated, the pace and magnitude will determine the trajectory of short-term rates and, by extension, the coupon payments on FRNs. Investors will monitor the December employment report closely; unexpectedly strong data could cause the Fed to signal a pause in rate cuts, which would support current FRN coupon levels for longer, while weak data would likely lead to further coupon reductions.
Figure 4: Relative momentum for Floating Rate Notes is improving.
U.S. IG Corporates: Analysis of the current data for the U.S. Aggregate bond index shows mixed but generally favorable indicators. The majority of signals are positive, showing bullish relative strength against implied bond volatility, option-adjusted spreads, the U.S. dollar, and technical crosses. These inputs suggest a robust technical and fundamental backdrop for the aggregate index. Conversely, two indicators signal caution: bearish relative strength versus credit default swaps and price mean reversion, suggesting potential risks in credit sentiment and the overextension of recent price moves.
Commentary: In November, U.S. Investment Grade (IG) corporate bonds delivered strong positive returns, outperforming U.S. Treasuries due to a decline in credit spreads. The asset class benefited significantly from the overall decrease in sovereign yields, driven by the Federal Reserve's accommodative stance and a broader "flight to quality" amid heightened global geopolitical risks. Solid corporate fundamentals, including strong balance sheets and healthy earnings reports across many sectors, supported this robust performance. A primary influencing factor was high investor demand for yield enhancement over safe-haven Treasuries. Supportive financing conditions encouraged corporations to issue new debt, which was absorbed effectively by the market. For December, the main drivers will be corporate earnings resilience and the pace of new issuance. Investors will scrutinize economic indicators for signs that the recent rate cuts are stimulating growth without spurring excessive inflation. Any deterioration in credit metrics or a surge in supply to fund large-scale capital expenditures could widen spreads and temper performance. Conversely, continued stable economic data and limited supply may sustain the strong performance of IG corporates into the year-end.
Figure 5: Lower implied bond volatility is constructive for bonds and equities.
U.S. High Yield: Positive indicators include strong relative strength against technical crosses, high yield bond breadth, U.S. small-cap equity trends, and absolute total return moving average crosses, suggesting positive momentum and broad market support. Conversely, cautionary signals arise from bearish relative strength readings, VIX moving-average crosses, and option-adjusted spread (OAS) reversals. These negative inputs highlight sensitivity to potential volatility spikes and credit spread dynamics, necessitating disciplined risk management.
Commentary: U.S. high-yield bonds posted positive returns in November, capitalizing on a risk-on environment and the prevailing decline in benchmark interest rates. The asset class saw performance gains, driven by tightening credit spreads, as investor appetite for higher returns outweighed concerns about economic slowdowns. Strong corporate fundamentals and low default rates provided a solid foundation, reinforcing market confidence in the ability of issuers to service their debt despite a softening macroeconomic backdrop. Key factors influencing this performance included the Federal Reserve's recent rate cuts, which boosted overall liquidity and supported borrowing conditions for riskier firms. The relative stability of energy prices was also a tailwind for the significant energy component within the high-yield market. Looking to December, performance will be highly dependent on the upcoming U.S. employment report and consumer confidence data. A strong jobs market would mitigate recession fears and likely sustain the positive momentum. Conversely, a sharp rise in corporate defaults or a sudden shift toward a risk-off sentiment driven by poor economic data or geopolitical events could quickly reverse the positive trend and widen credit spreads.
Figure 6: Improving small-cap equity trends support high-yield exposure.
International IG Bonds: The composite model for International Investment Grade (ITIG) fixed income indicates a mixed but cautious outlook. Two key indicators are positive: bullish relative strength versus option-adjusted spreads (OAS) and credit default swaps (CDS), suggesting a favorable credit environment. However, these are counterbalanced by significant bearish signals. The asset class shows negative relative strength against equity risk/VIX, relative strength slope, and moving average crosses. This indicates technical weakness and sensitivity to broader market volatility.
Commentary: International investment-grade (IG) fixed income delivered positive returns in November, primarily driven by a synchronous move by global central banks toward lower interest rates. The European Central Bank (ECB) and the Bank of England (BoE) both cut policy rates, leading to declines in sovereign yields across major non-U.S. economies. This boosted bond prices and tightened credit spreads, allowing international IG corporates to outperform their government counterparts. Performance was notably influenced by the U.S. dollar, which weakened against the Euro and other major currencies, benefiting dollar-based investors in unhedged international bonds. A key issue was persistent inflation in Europe, which made the pace of future ECB cuts uncertain. For December, performance will largely hinge on the release of final Q3 GDP data and November CPI figures from major global economies. The market will closely watch for any signs that central banks might pause their easing cycles. Further weakening of the U.S. dollar could continue to benefit the asset class, while escalating trade tensions might push investors toward U.S. domestic assets, potentially limiting international IG performance gains.
Figure 7: Lower CDS rates are constructive for international fixed-income.
Emerging Market Bonds: Emerging Market (EM) bond indicators are somewhat mixed, with the majority of indicators positive: bullish relative strength versus commodity market strength, absolute moving average cross, and relative strength moving average slope, suggesting technical support. Conversely, two key indicators are bearish: negative relative strength when compared to the EM currency index versus the USD and emerging equity momentum. This indicates currency risk and potential correlation weakness with broader EM risk appetite, suggesting a data-driven approach to mitigate exposure to currency fluctuations.
Commentary: Emerging Market (EM) bonds experienced positive performance in November, supported by a constructive global environment of falling interest rates and a weakening U.S. dollar. The asset class benefited as investors sought higher yields in developing economies. The rally was largely driven by tighter credit spreads and declining benchmark yields in core markets, which increased the attractiveness of EM debt. Supportive factors included robust domestic demand in several large EM economies and proactive policy maneuvers by local central banks to manage inflation. A key issue was ongoing concern about potential U.S. trade policies, which created selective volatility. For December, EM bond performance will be heavily influenced by two main factors: the U.S. Federal Reserve's December meeting outcome and broader commodity price movements. A clear indication of further U.S. rate cuts would likely sustain demand for EM assets. Conversely, a sharp rise in the U.S. dollar or significant negative geopolitical headlines, particularly regarding trade, could trigger capital outflows and pressure the asset class.
Figure 8: Emerging Market equity momentum has supported EM bond prices. This indicator is now negative.
Catastrophic Stop Model
The Catastrophic Stop model combines time-tested, objective indicators designed to identify high-risk periods for equities and fixed-income assets with high correlations to the equity market. The model entered December recommending a fully invested allocation relative to the benchmark for credit sectors with high correlations to equities.
The weight of the evidence suggests that any equity weakness is unlikely to extend into a significant downtrend at this time. Of course, if our model triggers a sell signal (below 40% for two consecutive days), indicating more substantial problems, we will reduce duration immediately.
Figure 9: The Catastrophic Stop model recommends fully invested equity and fixed income positions (relative to benchmarks). Because the model uses indices to extend its history, it is considered hypothetical.
Past performance is not indicative of future results. There can be no assurance that any investment or strategy will achieve its objectives or avoid substantial losses. This information is provided for illustrative purposes only and is not a prediction, projection or guarantee of future performance. Hypothetical results do not reflect actual trading, were derived using the benefit of hindsight, and may not reflect material economic and market events.
The Day Hagan Daily Market Sentiment Composite (part of the Catastrophic Stop Model) remains in the “Excessive Pessimism” zone, reflecting a notable rise in investor caution. Sentiment remains excessively pessimistic based on our short-term model. This is viewed as a net positive from a contrary opinion perspective.
Figure 10: Investor sentiment is being reset, as illustrated by the DH Daily Market Sentiment Composite declining below 70. A reversal back above 30% would enhance the potential for a rally.
Our goal is to stay on the right side of the prevailing trend, introducing risk management when conditions deteriorate. Currently, the uptrend remains intact. The broader-based composite models calling U.S. economic growth, international economic growth, inflation trends, liquidity, and equity demand remain constructive. The Catastrophic Stop model is positive, and we are aligned with the message. If our models shift to bearish levels, we will raise cash.
This strategy utilizes measures of price, valuation, economic trends, monetary liquidity, and market sentiment to make objective, rational, and unemotional decisions about how much capital to place at risk and where to allocate that capital.
For more information, please contact us at:
Day Hagan Asset Management
1000 S. Tamiami Trl
Sarasota, FL 34236
Toll Free: (800) 594-7930
Office Phone: (941) 330-1702
Website: https://dayhagan.com or https://dhfunds.com
© 2025 Day Hagan Asset Management
This material is for educational purposes only. Further distribution is prohibited without prior permission. Please see the information on Disclosures and Fact Sheets here: https://dhfunds.com/literature. Charts with models and return information use indices for performance testing to extend the model histories, and they should be considered hypothetical. All Rights Reserved. (© Copyright 2025 Day Hagan Asset Management.)
Day Hagan Smart Sector® Fixed Income ETF
Symbol: SSFI
Disclosures
The data and analysis contained within are provided “as is” and without warranty of any kind, either express or implied. The information is based on data believed to be reliable, but it is not guaranteed. Day Hagan DISCLAIMS ANY AND ALL EXPRESS OR IMPLIED WARRANTIES, INCLUDING, BUT NOT LIMITED TO, ANY WARRANTIES OF MERCHANTABILITY, SUITABILITY, OR FITNESS FOR A PARTICULAR PURPOSE OR USE. All performance measures do not reflect tax consequences, execution, commissions, and other trading costs, and as such, investors should consult their tax advisors before making investment decisions, as well as realize that the past performance and results of the model are not a guarantee of future results. The Smart Sector® Strategy is not intended to be the primary basis for investment decisions, and the usage of the model does not address the suitability of any particular investment for any particular investor.
Using any graph, chart, formula, model, or other device to assist in deciding which securities to trade or when to trade them presents many difficulties, and their effectiveness has significant limitations, including that prior patterns may not repeat themselves continuously or on any particular occasion. In addition, market participants using such devices can impact the market in a way that changes the effectiveness of such devices. Day Hagan believes no individual graph, chart, formula, model, or other device should be used as the sole basis for any investment decision and suggests that all market participants consider differing viewpoints and use a weight-of-the-evidence approach that fits their investment needs.
Past performance does not guarantee future results. No current or prospective client should assume future performance of any specific investment or strategy will be profitable or equal to past performance levels. All investment strategies have the potential for profit or loss. Changes in investment strategies, contributions or withdrawals, and economic conditions may materially alter the performance of your portfolio. Different types of investments involve varying degrees of risk, and there can be no assurance that any specific investment or strategy will be suitable or profitable for a client’s portfolio. Historical performance results for investment indexes and/or categories generally do not reflect the deduction of transaction and/or custodial charges or the deduction of an investment management fee, the incurrence of which would have the effect of decreasing historical performance results. There can be no assurances that a portfolio will match or outperform any particular benchmark. Comparisons to indices are inherently unreliable indicators of future performance. The strategies used to generate the performance vary from those used to generate the returns depicted in the benchmarks. Investors cannot directly invest in an index.
The information contained herein is provided for informational purposes only and should not be construed as investment advice or a recommendation to buy or sell any security. The securities, instruments, or strategies described may not be suitable for all investors, and their value and income may fluctuate. Past performance is not indicative of future results, and there is no guarantee that any investment strategy will achieve its objectives, generate profits, or avoid losses.
This material is intended to provide general market commentary and should not be relied upon as individualized investment advice. Investors should consult with their financial professional before making any investment decisions based on this information.
The material may contain “forward-looking” information that is not purely historical in nature. Such information may include, among other things, projections, forecasts, estimates of market returns, and proposed or expected portfolio composition. Day Hagan Asset Management, its affiliates, employees, or third-party data providers shall not be liable for any loss sustained by any person relying on this information. All opinions and views expressed are subject to change without notice and may differ from those of other investment professionals within Day Hagan Asset Management or Ashton Thomas Private Wealth, LLC.
Accounts managed by Day Hagan Asset Management or its affiliates may hold positions in the securities discussed and may trade such securities without notice.
Day Hagan Asset Management is a division of and doing business as (DBA) Ashton Thomas Private Wealth, LLC, an SEC-registered investment adviser. Registration with the SEC does not imply a certain level of skill or training.
There is no guarantee that any investment strategy will achieve its objectives, generate dividends, or avoid losses.
This material is for educational purposes only. Further distribution is prohibited without prior permission. Please see the information on Disclosures and Fact Sheets here: https://dhfunds.com/literature. Charts with models and return information use indices for performance testing to extend the model histories, and they should be considered hypothetical. All Rights Reserved.
All hypothetical results are presented for illustrative purposes only. Back-testing and other statistical analysis is provided in use simulated analysis and hypothetical circumstances to estimate how it may have performed prior to its actual existence. The results obtained from "back-testing" information should not be considered indicative of the actual results that might be obtained from an investment or participation in a financial instrument or transaction referencing the Index. The Firm provides no assurance or guarantee that the products/securities linked to the strategy will operate or would have operated in the past in a manner consistent with these materials. The hypothetical historical levels have inherent limitations. Alternative simulations, techniques, modeling or assumptions might produce significantly different results and prove to be more appropriate. Actual results will vary, perhaps materially, from the simulated returns presented.
© 2025 Day Hagan Asset Management
