
Day Hagan Catastrophic Stop Update December 15, 2025
A downloadable PDF copy of the Article:
Day Hagan Catastrophic Stop Update December 15, 2025 (pdf)
The Day Hagan Catastrophic Stop model remains steady at 68.18%. The model continues to indicate that investors should maintain their benchmark equity exposure.
Figure 1: The Catastrophic Stop model would generate a sell signal by closing below 40% for two consecutive days. The current message is positive, indicating investors should maintain benchmark equity exposure.
The S&P 500 fell for the week as investors continued to rotate out of AI-linked and growth names, with several sessions of broad declines. The Nasdaq Composite also lost ground, weighed down by weakness in large-cap tech. Despite the pullback, weekly moves were moderate enough that 14-day momentum and RSI readings remain in a neutral band rather than at extreme overbought or oversold levels.
Figure 2: SPX RSI neutral.
We featured the chart below last week, and I wanted to share it again.
Compressed equity risk premia have encouraged investors to look past near-term fundamentals and pay up for long-duration, higher-risk growth. Unprofitable and even no‑revenue Nasdaq companies now dramatically outperform profitable peers, as returns in 2025 are driven more by expectations, liquidity, and multiple expansion than by cash flows—leaving markets vulnerable to shifts in growth, liquidity, or rates.
Figure 3: Best performers this year? Nasdaq companies with no revenues!
The surge in Nasdaq stocks with no revenue looks like classic risk-on behavior, yet our Daily Sentiment Composite sits firmly in the pessimism zone. The reconciliation: a narrow group of investors is speculating in high‑beta, AI/tech “story” names while the broader market stays defensive, heavily hedged, and macro‑fearful. Systematic flows, carry trades, and momentum strategies can keep these speculative pockets rising even as put buying and credit protection depress sentiment indicators. This is selective speculation, not broad-based greed.
Figure 4: The DH Daily Market Sentiment Composite is a broad-based measure. It reflects investor pessimism. A rise back above 30 would generate a buy signal.
Since early October, volatility has spiked twice—first on new tariff threats, then on anxiety around large-cap growth and AI—but both bursts faded quickly as hedging demand surged. Episodes like this flag where risk is concentrated without yet signaling systemic stress; today’s VIX and MOVE remain relatively subdued.
Figure 5: VIX below 20 is constructive for equities. Source: StreetStats.
The MOVE index tends to inversely correlate well with equity performance. It too is at the lower end of this year's range.
Figure 6: MOVE index indicates low bond volatility. Constructive for equities. Source: StreetStats.
Systematic positioning has shifted into a more cautious, but not fully de-risked, stance. CTAs and vol control funds cut equity exposure during the recent drawdown, then modestly re-added length as realized volatility eased late in the week. Overall exposure sits around neutral versus history, leaving room for either incremental selling on further weakness or quick re-risking if markets stabilize.
Figure 7: Positioning neutral.
The S&P 500's gamma is currently positive, but a decline below 6,805 would put it back into negative gamma, potentially adding more volatility to the mix.
Figure 8: The Gamma condition is currently positive, but the gamma flip point is close.
Consensus points to roughly 14.5% S&P 500 EPS growth in 2026, with all 11 sectors positive but at varying levels of expectations. Information Technology, Health Care, Financials, and Industrials are expected to lead double-digit growth. At the same time, Energy, Consumer Staples, and Utilities show more modest gains as pricing power normalizes and commodity tailwinds fade.
The five most important factors for 2026 S&P 500 earnings are likely to be real economic growth, inflation, interest rates, AI-driven investment, and the U.S. dollar. So far, all remain marginally constructive. Short-term fluctuations are likely to be defined by positioning, sentiment, and OBOS levels.
Figure 9: Earnings growth into 2026 is forecast to be 14.5%.
Valuations sit in the highest historical quintile, so they are a clear headwind and, at current levels, materially elevate downside risk if earnings or rates disappoint. In this environment, return expectations should lean more on actual earnings growth and less on further multiple expansion, especially for mega-cap leaders.
Figure 10: Valuations at the high end.
PEG can help compare valuation versus expected growth, but it is far from foolproof. It is only as good as the growth forecasts plugged into it and has delivered mixed results as a standalone timing or stock-selection tool. Nonetheless, based on the ratio (using data from the previous two charts), investors rate the Information Technology sector second-cheapest—assuming growth projections are realized. In other words, Tech may continue to surprise the bears.
Sectors ranked by a “modified” PEG ratio = 12-month forward P/E ÷ CY 2026 earnings growth for each sector are as follows:
Materials: 0.87
Information Technology: 1.07
Industrials: 1.58
Financials: 1.69
Utilities: 1.88
Communication Services: 1.90
Energy: 1.98
Health Care: 2.01
Consumer Discretionary: 2.50
Consumer Staples: 2.88
Real Estate: 3.26
Turning to the Fed: The Fed delivered a third straight 25 bp rate cut (albeit with a pause, discussed in earlier Cat Stop updates), taking the funds rate to 3.50%–3.75%, and signaled a higher bar for further easing, as policy is now “within a broad range” of neutral. The new dot plot still shows only one additional cut penciled in for 2026.
In the statement, the Fed said, “job gains have slowed this year, and the unemployment rate has edged up through September,” noting that more recent indicators are consistent with a gradually cooling labor market.
Figure 11: The Fed cut rates 25 bps to 3.50%–3.75%, acknowledged moderate growth and still‑elevated inflation, and signaled it is now near neutral and will move more cautiously, making any further adjustments data‑dependent rather than pre-committed. (Chart: StreetStats)
The Citi Economic Surprise Index has ticked higher partly because recent data on activity and sentiment—including NFIB and job openings- have modestly beaten downbeat expectations.
Figure 12: U.S. ESI is in positive territory.
Japan’s ESI also shows that, on average, investors and strategists have been underestimating economic activity over the past three months.
Figure 13: Japan’s ESI spiking higher.
On the other hand, U.K. economic releases have been more downbeat than expected. Note that levels are consistent with, shall we say, “oversold” economic activity levels. Note that current levels are generally consistent with previous reversal areas since 2020. We are watching closely for signs that mean reversion forces are taking hold.
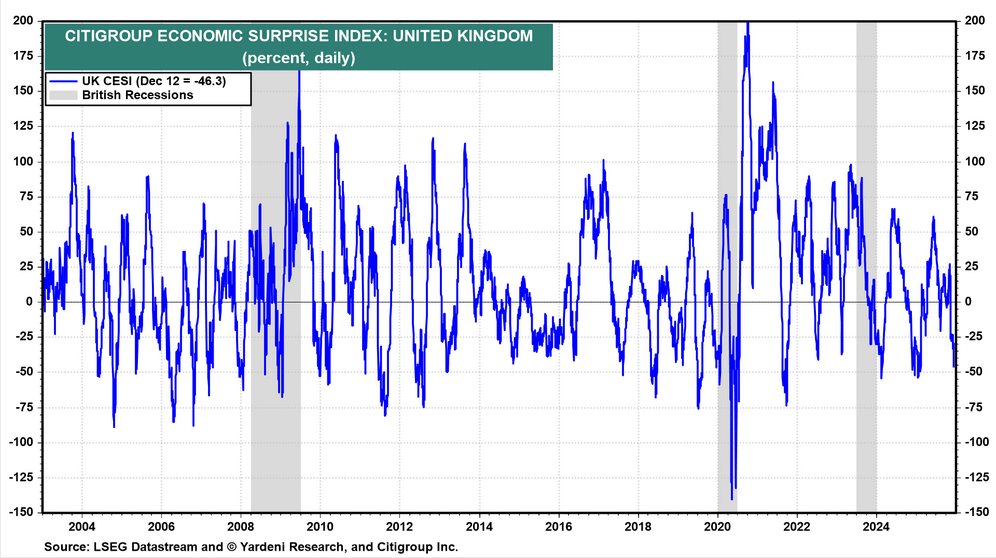
Figure 14: The U.K.’s ESI is negative but may be approaching levels that are “so bad, it’s good.” We’re monitoring closely.
Upcoming U.S. Economic Releases:
Last week’s economic releases, including the FOMC results, showed relatively benign surprises: small-business sentiment, employment costs, jobless claims, and inventories are close to forecasts, pointing to steady—not booming—activity. The 10-year and 30-year Treasury auctions were solid, cleared near prevailing yields, with decent bid-to-cover ratios, signaling steady but unspectacular demand for duration and no major shift in long-term inflation or term premium expectations.
Tuesday: Retail Sales, Employment data, Flash PMIs.
Also, Tuesday, Business Inventories. We’ve noticed a slight uptick, which, while not yet concerning, we are closely monitoring.
Thursday, CPI, Unemployment Claims, TIC (foreign purchases).
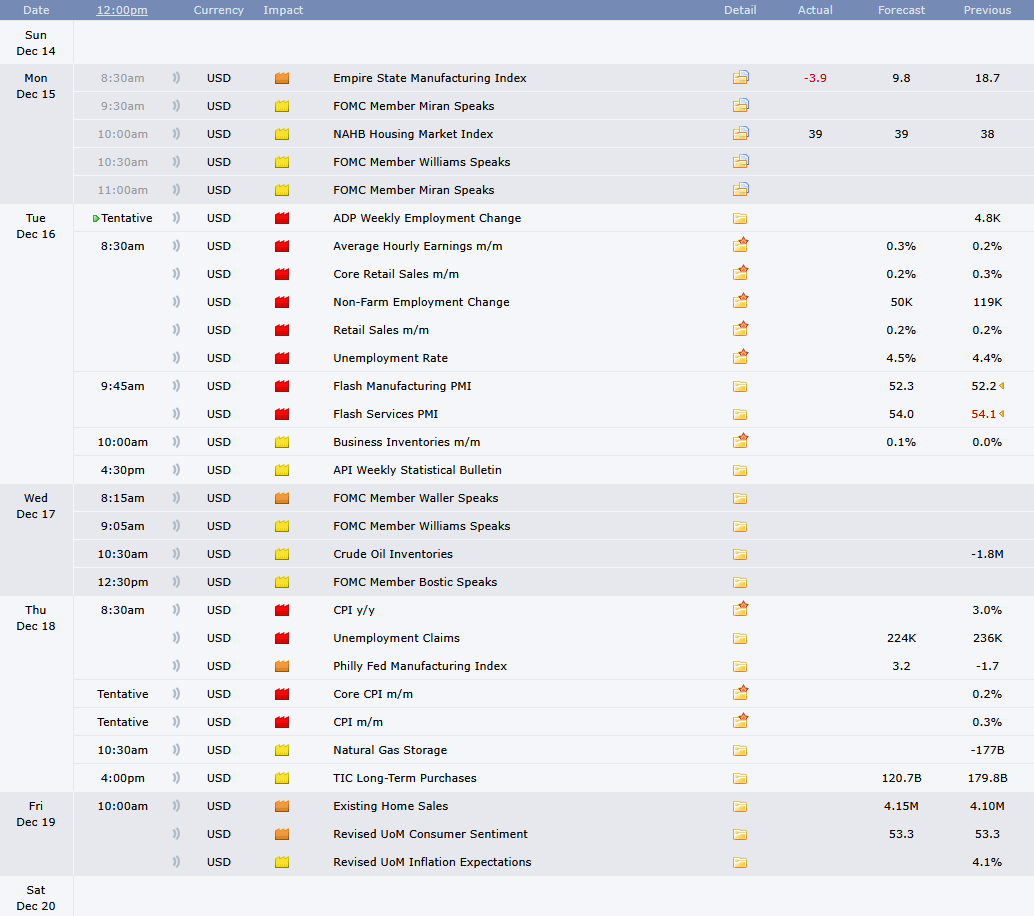
Figure 15: Economic release calendar.
Bottom Line: The U.S. stock market seems to be ending the year on a strong note, driven by resilient corporate earnings, moderating inflation, and expectations of eventual Federal Reserve rate cuts that are supporting valuations, though likely occurring after a pause. Robust consumer spending and strong balance sheets further anchor investor confidence. However, weaknesses persist, with equity valuations remaining elevated relative to historical averages, geopolitical tensions clouding the global outlook, and economic growth could slow under restrictive credit conditions. The market’s optimism will face tests from earnings durability and policy uncertainty into 2026. Based on our indicators and models, we currently remain constructive on U.S. equities.
For more details on each sector and current model levels, please visit our research page at https://dayhagan.com/research.
This strategy uses measures of price, valuation, economic trends, liquidity, and market sentiment to make objective, rational, and emotion-free decisions about how much capital to place at risk and where to allocate it. If you would like to discuss any of the above or our approach to investing in more detail, please don’t hesitate to schedule a call or webinar. Please call Tyler Hagan at 941-330-1702 to arrange a convenient time for you.
Sincerely,
Donald L. Hagan, CFA
Chief Investment Strategist, Partner, Co-Founder
This material is for educational purposes only. Further distribution is prohibited without prior permission. Please see the information on Disclosures here: https://dhfunds.com/literature. Charts with models and return information use indices for performance testing to extend the model histories, and they should be considered hypothetical. All Rights Reserved. © Copyright 2025 Day Hagan Asset Management. Data sources: Day Hagan Asset Management, 3Fourteen Research, J.P. Morgan, Goldman Sachs, Barchart, StreetStats, Atlanta Fed, St. Louis Fed, Koyfin, Yardeni, MarketEar, S&P Global, SPDR, FactSet.
Disclosures
S&P 500 Index—An unmanaged composite of 500 large-cap companies, this index is widely used by professional investors as a performance benchmark for large-cap stocks.
S&P 500 Total Return Index – An unmanaged composite of 500 large capitalization companies. Professional investors widely use this index as a performance benchmark for large-cap stocks. This index assumes reinvestment of dividends.
Sentiment – Market sentiment is the prevailing attitude of investors toward a company, a sector, or the financial market.
CBOE Volatility Index (VIX) – A real-time index that represents the market’s expectations for the relative strength of near-term price changes of the S&P 500 Index (SPX). Because it is derived from SPX index options with near-term expiration dates, it produces a 30-day forward volatility projection. Volatility, or how quickly prices change, is often seen as a way to gauge market sentiment, particularly the degree of fear among market participants.
OBOS Indicators—The overbought/Oversold (OBOS) index relates the difference between today’s closing price and the period’s low closing price to the trade margin of the given period.
NFIB – The National Federation of Independent Business advocates for America’s small and independent business owners.
Purchasing Manager Indexes (PMIs) – Purchasing Managers’ Indexes are survey-based economic indicators designed to provide timely insight into business conditions.
FOMC Meeting – The FOMC (Federal Open Market Committee) holds eight regularly scheduled meetings per year. At these meetings, the Committee reviews economic and financial conditions, determines the appropriate stance of monetary policy, and assesses the risks to its long-term goals of price stability and sustainable economic growth.
Consumer Price Index (CPI) – Measures the monthly change in prices paid by U.S. consumers. The Bureau of Labor Statistics (BLS) calculates the CPI as a weighted average of prices for a basket of goods and services representative of aggregate U.S. consumer spending.
Disclosure: The information contained herein is provided for informational purposes only and should not be construed as investment advice or a recommendation to buy or sell any security. The securities, instruments, or strategies described may not be suitable for all investors, and their value and income may fluctuate. Past performance is not indicative of future results, and there is no guarantee that any investment strategy will achieve its objectives, generate profits, or avoid losses.
This material is intended to provide general market commentary and should not be relied upon as individualized investment advice. Investors should consult with their financial professional before making any investment decisions based on this information.
Data and analysis are provided “as is” without warranty of any kind, either express or implied. Day Hagan Asset Management, its affiliates, employees, or third-party data providers shall not be liable for any loss sustained by any person relying on this information. All opinions and views expressed are subject to change without notice and may differ from those of other investment professionals within Day Hagan Asset Management or Ashton Thomas Private Wealth, LLC.
Accounts managed by Day Hagan Asset Management or its affiliates may hold positions in the securities discussed and may trade such securities without notice.
Day Hagan Asset Management is a division of and doing business as (DBA) Ashton Thomas Private Wealth, LLC, an SEC-registered investment adviser. Registration with the SEC does not imply a certain level of skill or training.
There is no guarantee that any investment strategy will achieve its objectives, generate dividends, or avoid losses.
For more information, please contact us at:
Day Hagan Asset Management
1000 S. Tamiami Trail, Sarasota, FL 34236
Toll-Free: (800) 594-7930
Office Phone: (941) 330-1702
Websites: https://dayhagan.com or https://dhfunds.com
© 2025 Day Hagan Asset Management
