
Day Hagan Smart Sector® International Strategy Update April 2026
A downloadable PDF copy of the Article:
Day Hagan Smart Sector® International Strategy Update April 2026 (pdf)
Executive Summary
In March, international equity markets behaved less like a macroeconomic battleground and more like a referendum on energy security. The month’s dominant force was the escalation of the U.S.-Israeli conflict with Iran, which disrupted traffic through the Strait of Hormuz, sharply lifted Brent crude prices, and forced investors to reprice inflation, growth, and risk premiums across Europe and Asia. Europe’s STOXX 600 fell 8%—its worst month since June 2022—while Japan’s Nikkei tumbled more than 11%. Energy shares outperformed, but most cyclical sectors, transport stocks, and rate-sensitive industries weakened.
Economic data releases were notable, but their impact was viewed primarily through the prism of the oil shock. In the euro area, March CPI accelerated to 2.5% year over year—above the ECB’s 2% target—even as core inflation eased to 2.3%, highlighting the tension between elevated headline inflation and still-muted underlying demand. In China, the official manufacturing PMI rose to 50.4 in March from 49.0 in February, indicating improved factory momentum, though concerns persisted over export demand and input cost pressures.
Central banks responded with notable caution. The Federal Reserve, ECB, and Bank of Japan all left policy unchanged in March, as markets grew increasingly concerned that energy-driven inflation could postpone easing or even prompt renewed tightening. Currency moves compounded the strain: a stronger U.S. dollar pressured non-U.S. assets, while the yen’s drop beyond 160 per dollar fueled worries about imported inflation in Japan and the prospect of official intervention. Liquidity remained thin, and volatility increased as quarter-end approached. Ultimately, March favored balance-sheet resilience and laid bare markets’ vulnerability to geopolitical shocks.
Investors are now likely focused on whether first-quarter earnings can absorb higher energy, freight, and financing costs, and whether April activity data confirm March’s apparent resilience rather than a delayed slowdown. Key markers will include PMIs, consumer demand, inflation prints, corporate guidance, and any revisions to central bank timing. Oil and the U.S. dollar should remain especially important, because sustained strength in either could pressure margins, currencies, and valuation multiples across international markets.
Holdings
Core: Developed Market Positions (approximately 65% of equity holdings)
Country
Australia
Canada
China
France
Germany
Japan
Switzerland
United Kingdom
Outlook
Neutral
Overweight
Underweight
Underweight
Underweight
Overweight
Underweight
Neutral
Explore: Emerging Market Positions (approximately 35% of equity holdings)
India
Netherlands
New Zealand
Sweden
Chile
Position Details
Core: Developed Market Commentary
Approximately 65% of the strategy is allocated across eight of the largest markets in the ACWI ex-U.S. Index. The fund overweights and underweights the largest non-U.S. equity markets based on macro, fundamental, behavioral, and technical indicators.
Australia: Positive indicators within Australia’s composite model are clustered around trend, rates, and market sensitivity: Australia’s relative strength remains favorable versus its adaptive moving average, the Australia-U.S. rate differential backdrop, global beta, and the historical pattern of bear-market bounces, which together suggest the market still retained some medium-term leadership traits even as March turned disorderly. That underlying support was tested by a difficult month for the S&P/ASX 200, which fell about 7.8% in March, its sharpest monthly decline in several years, as investors repriced geopolitical risk after the Middle East conflict pushed oil sharply higher and raised concern about imported inflation. Australia-specific data were mixed rather than uniformly weak: fourth-quarter GDP printed at 0.8% quarter over quarter and 2.6% year over year, better than expected, while consumer confidence edged up in March.
The negative indicators, however, were the ones the market traded on in March: Australia’s relative strength versus its absolute moving-average cross, gold, the broader global technical scorecard, and relative earnings yield all deteriorated, consistent with a market losing momentum, ceding leadership to defensives, and facing valuation pressure as bond yields rose. The Reserve Bank of Australia added to that tension by lifting the cash rate 25 basis points to 4.1% in March, while Australia’s 10-year yield rose roughly 25 basis points over the month and the Australian dollar weakened by more than 2% versus the U.S. dollar. At the same time, February unemployment rose to 4.3%; February CPI remained above target at 3.7%; manufacturing PMI slipped to 49.8; and services PMI fell to 46.6, signaling a sharp loss of momentum in activity. In short, March favored energy-linked exposures and created headwinds for duration, cyclicals, and richly valued growth.
Figure 1: Australia’s interest rate differential with the U.S. has narrowed.
Canada: The composite’s constructive indicators still point to relative-strength persistence rather than to broad market fragility. Signals tied to the triple-moving-average diffusion index, mean reversion, the global technical backdrop, and the Canada-U.S. dollar relationship remain favorable, suggesting Canada kept an edge where commodity leverage, market structure, and currency translation mattered most. Those framing fits March’s tape: the TSX finished the month down about 4.6%, but notably less damaged than many global peers, after reaching a record high above 34,500 earlier in the year. Energy was the key offset, as the Middle East conflict and the Strait of Hormuz risk drove a sharp oil shock; by month-end, Reuters reported that TSX energy stocks were up nearly 15% in March, even as the broader index fell.
The weaker indicators were the ones linked to trend confirmation, leading growth, and valuation. Canada’s relative strength versus its absolute moving-average cross, OECD-style leading-cycle proxies, and relative earnings yield all read negatively, consistent with a market that held up mainly because of its sector mix rather than broad internal participation. March macro data support that caution. The Bank of Canada held its policy rate at 2.25% on March 18, while emphasizing two-sided risks from the energy shock. Canada’s manufacturing PMI slipped to 50.0 in March from 51.0 in February, the 10-year yield was roughly 29 basis points higher over the month, and the Canadian dollar weakened about 1.7% versus the U.S. dollar over the same period. February CPI slowed to 1.8%, but labor data softened, with unemployment at 6.7%. In practice, March favored energy and materials, while cyclicals and duration-sensitive shares faced headwinds.
Figure 2: Canadian dollar continues to show strength versus the U.S. dollar; however, the move is now in overbought territory.
China: China’s composite model continues to tilt negatively, overall. Mean reversion indicators are now positive, which is often what shows up when price damage has gone far enough to create selective catch-up potential (oversold). That interpretation fits the March activity: mainland equities were weak, but not indiscriminately so. By month-end, the Shanghai Composite and Shenzhen Component had still posted their worst monthly performances since January 2024, yet the final sessions showed buyers responding to better domestic activity data. Trading Economics reported the official manufacturing PMI rose to 50.4 in March from 49.0 in February, the strongest reading in a year, while the composite PMI returned to expansion at 50.5. Policy also stayed supportive at the margin: the PBoC left the 1-year and 5-year loan prime rates unchanged at 3.0% and 3.5%, favoring stability over surprise tightening.
The negative indicators still dominate the overall read. Relative price momentum, the absolute moving-average cross, PMI-linked relative strength, the emerging-markets currency backdrop, and high-yield credit-spread behavior all point to fading leadership rather than confirmed re-acceleration. March’s equity tape reflected that caution. The key external driver was the Middle East conflict: higher oil prices raised input cost pressures, clouded export and margin expectations, and kept global risk appetite uneven. Even with the official PMI rebound, the private manufacturing PMI slowed to 50.8 from 52.1, signaling expansion but less momentum, while Trading Economics noted China’s 10-year yield hovered around 1.82% as investors weighed mixed growth signals and war-driven inflation risk. The yuan was broadly firm versus the dollar over the month, but that was not enough to reverse the market’s softer tone.
Figure 3: High-yield credit spreads often represent risk-on versus risk-off attitudes. Increasing spreads may indicate investors are becoming more risk-averse. The recent reversal in spreads may indicate that a more risk-on attitude is taking hold.
France: Positive signals include better relative strength versus the 200-day moving average and relative breadth remaining favorable, which suggests leadership has not fully disappeared beneath the surface, even though the month’s price action was negative. That nuance mattered in March 2026: the CAC 40 ended a volatile month down about 8.9%, yet the index recovered somewhat by month-end, consistent with selective participation rather than a complete collapse in risk appetite. In the macro data, there were at least a few stabilizers. France’s March inflation rate was 1.7%, and the March harmonized inflation rate was 1.9%, levels that remained contained relative to the broader euro-area energy shock.
The negative indicators still dominate the overall read. Relative strength versus the moving-average cross, the global technical scorecard, cross-sectional 50-day momentum, OECD-style leading indicators, dividend yield, valuation, and ETF flows all point to weaker trend quality and less supportive positioning. March’s market narrative was shaped by exactly those pressures. The Middle East conflict and disruption in the Strait of Hormuz pushed oil prices sharply higher, lifting euro-area headline inflation to 2.5% and complicating the ECB's outlook. At the same time, France’s flash composite PMI fell to 48.3 in March, signaling contraction, while Reuters said final manufacturing PMI slipped to 50.0 as orders weakened and input costs rose. Fixed income also tightened the discount-rate backdrop: France’s 10-year OAT yield hovered around 3.75% in late March, near a 17-year high and up about 36 basis points over the past month. In practical terms, March penalized valuation-sensitive cyclicals and rewarded caution.
Figure 4: European fund flows have reversed into outflows.
Germany: Very few positive indicators are in play for Germany. Relative strength versus 200-day moving-average breadth and relative dividend yield remain supportive, while the euro-dollar relationship is also constructive, suggesting Germany still retains some defensiveness when breadth is intact, income matters, and currency conditions are not actively hostile. That helps explain why the market’s late-March tone improved even after a bruising month: The DAX closed March with a small final-day gain, while still posting a steep monthly loss, and Germany’s manufacturing PMI rose to 52.2 in March from 50.9 in February, the best reading since May 2022. Those data points suggest the industrial core was not collapsing, even as macro uncertainty intensified.
The negative indicators, however, were more numerous and better aligned with March price action. Relative strength versus the global technical scorecard, relative moving-average cross, ETF flows, and manufacturing confidence all point to weaker trend quality and less dependable leadership, while the neutral bear-market-bounce signal offers little offset. March’s equity market was driven primarily by the Middle East conflict and the related oil shock: Reuters reported Germany’s EU-harmonized inflation rose to 2.8% in March from 2.0% in February, led by energy, while euro-area inflation reached 2.5%, complicating the ECB’s policy path. Germany’s 10-year Bund yield rose about 26 basis points over the past month, and the euro weakened roughly 0.8% versus the dollar over the same span. Germany’s flash services PMI also fell to 51.2 from 53.5. In practice, March favored caution, raised discount rates, and pressured broad market leadership despite pockets of industrial strength.
Figure 5: German manufacturing confidence continues to roll over.
Japan: Even with the weakness in March, several indicators remain supportive. In other words, the damage done in the markets hasn’t yet nullified the primary uptrend. For example, relative strength remains favorable versus the absolute moving-average cross, the relative moving-average cross, the global technical scorecard, valuation, forward earnings growth, and the yen relationship. In plain terms, that mix suggests Japan entered March with stronger trend persistence, greater earnings credibility, and a currency backdrop that has historically supported exporters. Japan’s manufacturing PMI stayed in expansion at 51.6 in March, and the composite PMI held at 52.5, indicating activity was still growing, if at a slower pace than in February. The Bank of Japan also kept its policy rate unchanged at 0.75% in March, preserving a still-gradual normalization path.
The negative indicators, however, were the ones markets traded on during March. Relative strength versus China PMI and sentiment reversed, while the bear-market-bounce signal was not strong enough to offset a broad risk-off tape. The Nikkei fell more than 11% in March, according to Reuters, as the Middle East conflict, higher prices, and fears of a longer inflation shock hit global cyclicals and semiconductor exposure. At the same time, the yen weakened to below 160 per dollar, its softest level since July 2024, intensifying concerns about imported inflation and possible intervention. Reuters also reported Japan’s 10-year government bond yield reached its highest level since 1999, tightening financial conditions just as Tokyo core inflation slowed to 1.7% in March. For March only, the takeaway is straightforward: Japan’s medium-term signal set stayed constructive, but the market was dominated by oil, rates, and currency stress.
Figure 6: Earnings growth expectations continue to increase.
Switzerland: Positive indicators are concentrated in breadth and rate measures. Relative strength versus the 200-day moving-average breadth remains supportive, and the relationship to relative nominal 10-year yields is also favorable, consistent with a market whose defensive profile can still attract capital when growth uncertainty rises and bond markets reprice. That showed up in March. The Swiss benchmark held up better than much of continental Europe, even as regional equities sold off, helped by its high-quality sector mix and by a domestic macro backdrop that was not deteriorating across the board. Switzerland’s manufacturing PMI jumped to 53.3 in March from 47.4 in February, back into expansion and at its highest level in more than three years, while the SNB left its policy rate unchanged at 0% on March 19.
The negative indicators still dominate the broader technical read. Relative strength versus the moving-average cross, cross-sectional 50-day momentum, moving-average slope, relative dividend yield, and ETF fund flows all point to weaker trend confirmation and less compelling participation. March’s market narrative explains why. The Middle East conflict and disruption around the Strait of Hormuz pushed oil higher and lifted inflation concerns across Europe, which weighed on equities generally. Switzerland was not immune: March CPI rose to 0.3% year over year from 0.1% in February, the highest in a year, and Switzerland’s 10-year government bond yield rose about 12 basis points over the month. The Swiss franc also softened versus the U.S. dollar over the month, with USD/CHF up roughly 2.4%. In practice, March favored defensives, but even Switzerland’s defensive premium did not fully shield it from geopolitics and higher discount rates.
Figure 7: Breadth trends are negative, though current levels imply the move has reached oversold territory. We would require a decisive reversal before declaring this indicator bullish.
United Kingdom: For the U.K., several positive indicators indicate a market with modest relative-strength advantages, even in a difficult month. Signals tied to the moving-average cross, cross-sectional price momentum, sterling versus the U.S. dollar, sentiment, and option-adjusted spreads are favorable, which aligns with the FTSE 100’s sector mix: energy, defensives, and global earners have provided the market with more support than many continental peers. Even so, March was not an easy month. The FTSE 100 was down about 6.7% in March, but that decline was moderated by strength in oil-linked names as the Middle East conflict drove energy prices sharply higher. The macro backdrop was mixed rather than uniformly weak: U.K. manufacturing PMI eased only modestly to 51.4 in March from 51.7 in February, staying in expansion, while the Bank of England held Bank Rate at 3.75% on March 19.
The negative side is more valuation-driven. Relative strength versus the global valuation scorecard is bearish, consistent with a market that looked defensively useful but not obviously cheap once discount rates rose. That mattered in March. The BoE’s hold came with a hawkish tone as officials weighed the inflation implications of the oil shock, and Reuters reported a sharp selloff in gilts after the meeting. Sterling then retreated late in the month, falling about 1.7% versus the dollar in March, while Reuters also noted 10-year gilt yields climbed above 5%, the highest since 2008. Meanwhile, the U.K. composite PMI slowed to 51.0, and March inflation data showed February CPI at 3.0% and core CPI at 3.2%. Overall, March rewarded commodity exposure and punished duration-sensitive valuations.
Figure 8: Last month, we noted that U.K. OAS spreads increased, indicating caution was building. As for our latest update, spreads appear to have potentially peaked. This is supportive.
Emerging Market Positions
Approximately 30% of the strategy is allocated across five markets from a pool of more than 20 smaller markets. Selection is based on a multifactor technical ranking system that uses trend and mean-reversion indicators. The process seeks to identify oversold opportunities within the global equity markets that are likely to mean-revert from lower levels and exhibit mild pullbacks from long-term uptrends.
Current Holdings:
India
Netherlands
New Zealand
Sweden
Chile
Explore: Emerging Market Commentary
India
India’s April backdrop still offered several constructive signals. Manufacturing PMI remained in expansion at 53.8, manufacturing output stayed firm in February, and inflation remained relatively contained at 3.21%. That mix supported the case for exporters, selected industrials, and large-cap technology, which continued to look comparatively well positioned within a more volatile global setting. The less favorable signals came from outside India rather than from a clear domestic breakdown. Higher crude prices, foreign outflows, a softer rupee, and firmer local bond yields created a more demanding environment for equity multiples, especially in financials and domestically oriented cyclicals. For an oil-importing market, March was shaped by the usual external channels: energy costs, currency sensitivity, and the discount-rate effect. Even so, the domestic macro picture remained sound enough to keep investors engaged with companies tied to manufacturing depth, export leverage, and high-quality balance sheets.
Netherlands
The Dutch market entered April with several encouraging macro signals. Manufacturing PMI improved to 52.0, the strongest reading in six months, business confidence edged higher, and industrial production continued to expand. Those indicators suggest that the domestic growth pulse was still constructive, particularly for internationally exposed industrial, transport, and logistics businesses. The more cautious signals were tied to inflation, consumer sentiment, and higher long-term yields. Inflation accelerated to 2.7% in March, consumer confidence remained weak, and bond yields moved higher as investors repriced the euro-area rate path following the energy shock linked to Middle East tensions. That combination made Dutch equities feel more rate-sensitive during the month, especially in areas where valuation support was thinner. Still, March was not simply a local slowdown story. The country’s cyclical and trade-linked profile meant that better manufacturing data and improving business conditions continued to provide a useful counterweight, particularly for companies with operating leverage tied to global activity rather than purely domestic demand.
New Zealand
New Zealand’s March picture was more constructive than the market mood alone suggested. Manufacturing PMI remained strong, business confidence stayed positive despite softening, and fourth-quarter GDP still registered modest growth. Those signals indicate that the domestic economy continued to generate enough forward motion to support selective opportunities, especially in higher-quality domestic franchises and more defensive exposures. The more difficult signals were mostly external. New Zealand remained exposed to the same forces that unsettled many smaller open markets in March: a softer currency, rising long-term yields, oil-driven inflation concerns, and weaker global risk appetite tied to geopolitical tension. Those factors complicated the valuation backdrop and made investors more selective, particularly in areas with higher funding sensitivity or greater dependence on global growth. Even so, the underlying domestic data did not indicate that the market was losing its footing entirely. In March, the more constructive interpretation was that New Zealand still had a functioning macro base, but one temporarily overshadowed by global crosscurrents.
Sweden
Sweden’s March signal set leaned more constructive than the headline environment first implied. Manufacturing PMI rose to 56.3, its strongest level since March 2022, and the economic trend indicator moved toward a normal business climate. That combination kept the industrial and cyclical case alive beneath the surface, especially for companies with operating leverage to a stabilizing factory cycle. The softer signals came from business confidence, order trends, a weaker krona, and somewhat higher bond yields. Those factors made the equity backdrop more valuation-sensitive and contributed to a more cautious tone toward cyclicals during the month. Sweden also traded under the broader European macro shadow, as the Middle East conflict pushed energy costs higher and encouraged markets to reassess the inflation path across the region. Still, March was not devoid of encouragement. The factory data remained notably positive, and that matters in Sweden, where industrial breadth often carries important informational value for equity leadership and forward earnings expectations.
Chile
Chile’s March backdrop offered more support than many markets could claim. Business confidence remained above 50, inflation stayed relatively contained in February, and the policy rate continued to look supportive by regional standards. Just as important, Chile retained a meaningful copper advantage, with the central bank raising its 2026 copper price forecast to $5.4 per pound. That provided an important earnings and sentiment anchor for a market where commodity linkage remains central. The weaker signals came from a more fragile external mix. Oil prices rose, copper became more volatile, the peso softened, long-term yields rose, and consumer confidence slipped. Manufacturing production was also softer in February, reminding investors that the domestic economy was not uniformly strong. Even so, March still highlighted one of Chile’s core strengths: when global conditions are unsettled, its commodity profile can continue to provide relative support. The month ultimately favored a selective stance, but one with a constructive bias toward copper-linked earnings power and policy-supported domestic stability.
Catastrophic Stop Model
The Catastrophic Stop model combines time-tested, objective indicators designed to identify high-risk periods for the equity market. The model entered April, recommending a fully invested equity allocation relative to the benchmark.
The weight of the evidence suggests that any weakness is unlikely to extend into a significant downtrend at this time. Of course, if our model triggers a sell signal (below 40% for two consecutive days), indicating more substantial problems, we will raise cash immediately.
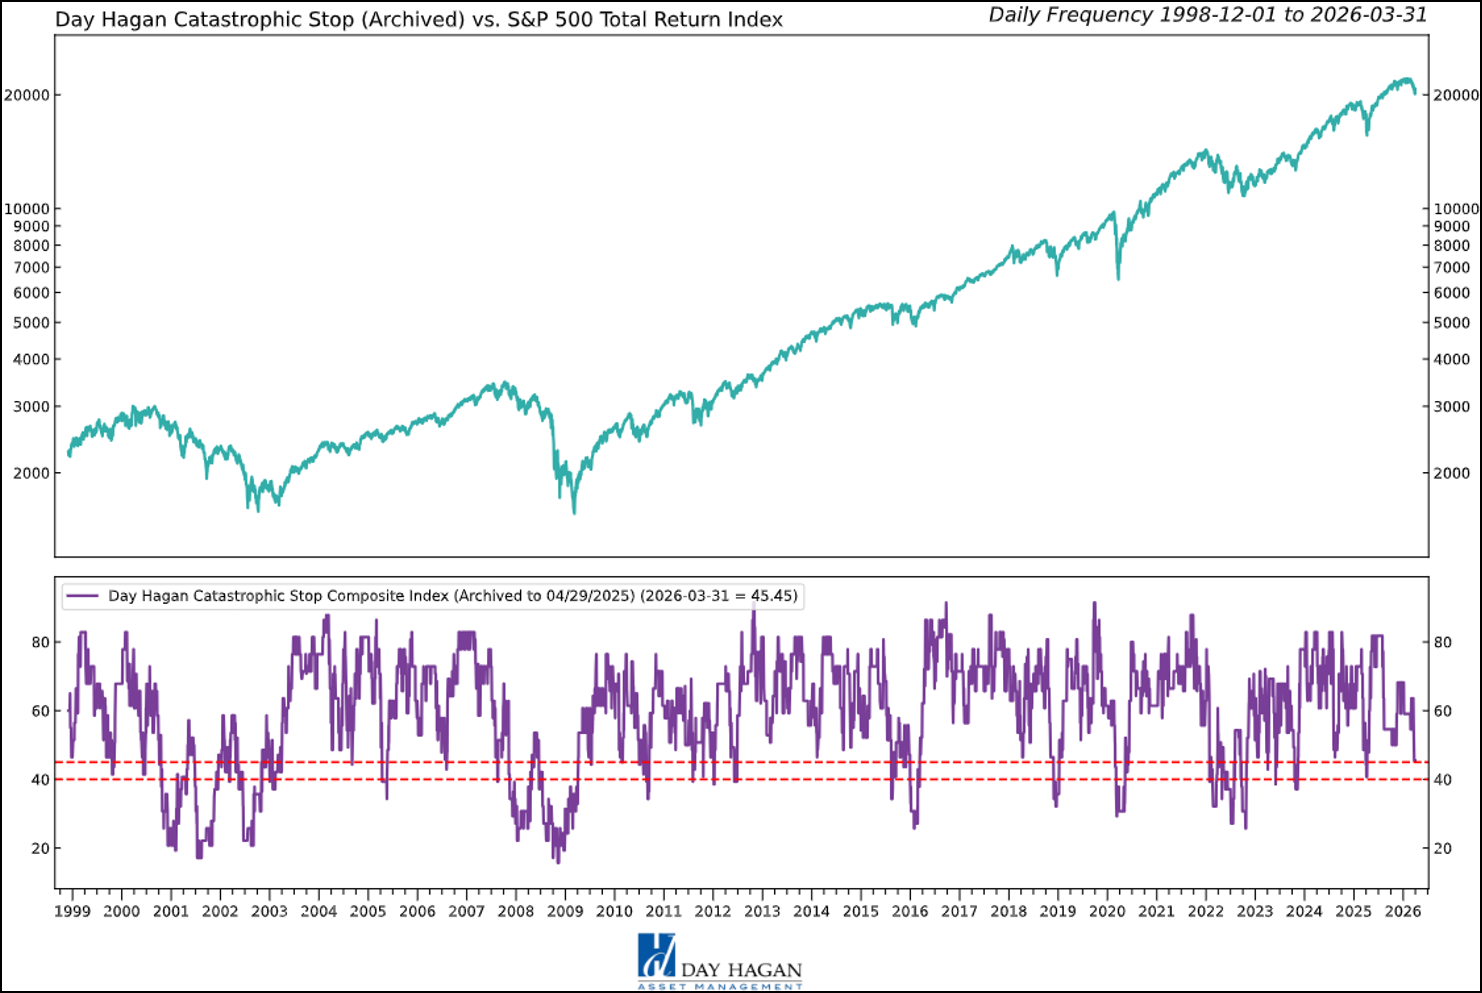
Figure 9: The Catastrophic Stop model recommends a fully invested equity position (relative to the benchmark). Because the model uses indices to extend its history, it is considered hypothetical.
Hypothetical and historical past performance is not indicative of future results. There can be no assurance that any investment or strategy will achieve its objectives or avoid substantial losses or have comparable results. This information is provided for illustrative purposes only and is not a prediction, projection, or guarantee of future performance. Hypothetical results do not reflect actual trading, were derived using the benefit of hindsight, and may not reflect material economic and market events. Actual results vary and depend on many factors and subject to risk and uncertainties.
The Day Hagan Daily Market Sentiment Composite (part of the Catastrophic Stop Model) indicates extreme pessimism is firmly in place. From a contrary opinion perspective, this has historically been constructive.
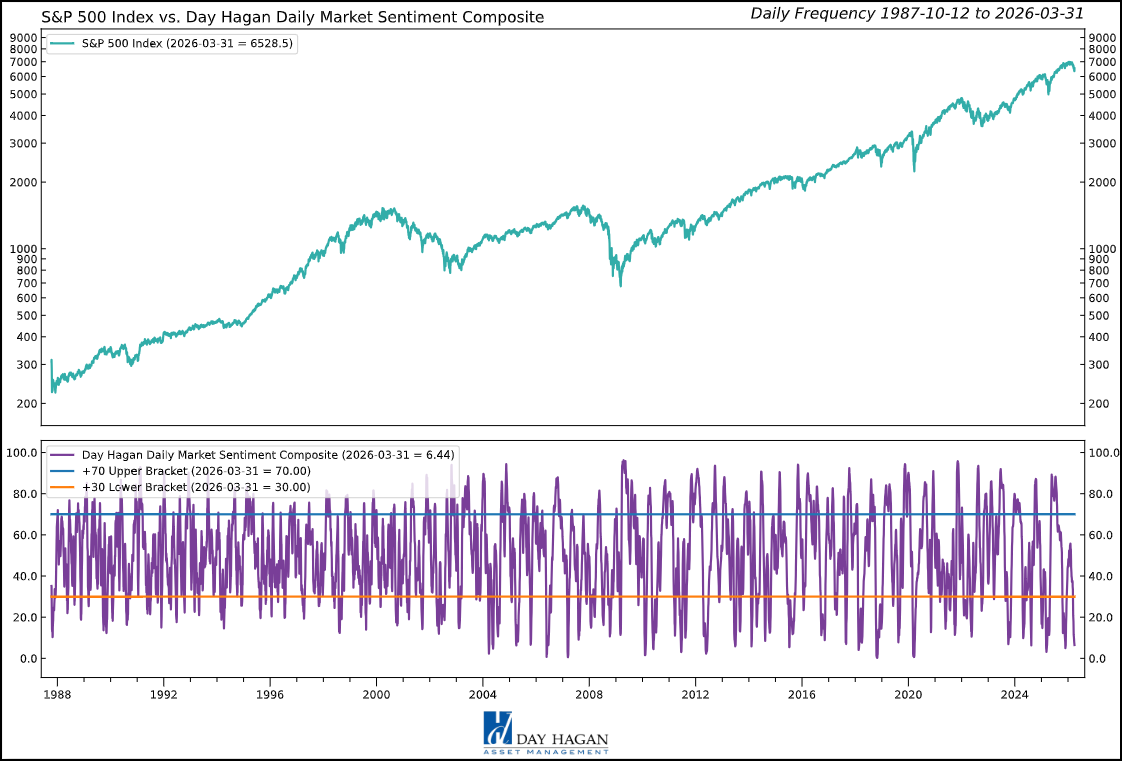
Figure 10: A buy signal would occur if the Composite rises back above the 30 level, indicating that investors are becoming more optimistic on the market.
This strategy uses measures of price, valuation, economic trends, liquidity, and market sentiment to make objective, rational, and unemotional decisions about how much capital to risk and where to allocate it.
For more information, please contact us at:
Day Hagan Asset Management
1000 S. Tamiami Trl
Sarasota, FL 34236
Toll Free: (800) 594-7930
Office Phone: (941) 330-1702
Website: https://dayhagan.com or https://dhfunds.com
© 2026 Day Hagan Asset Management
This material is for educational purposes only. Further distribution is prohibited without prior permission. Please see the information on Disclosures and Fact Sheets here: https://dhfunds.com/literature. Charts with models and return information use indices for performance testing to extend the model histories, and they should be considered hypothetical. All Rights Reserved. (© Copyright 2026 Day Hagan Asset Management.)
Day Hagan Smart Sector® International ETF
Symbol: SSXU
Strategy Description
The Smart Sector® International strategy combines three quantitative investment strategies: Core International, Explore International, and Catastrophic Stop.
The Process Is Based On The Weight Of The Evidence
Core Allocation
The fund begins by overweighting and underweighting the largest non-U.S. equity markets based on proprietary models.
Each of the models utilizes market-specific, weight-of-the-evidence composites of fundamental, economic, technical, and behavioral indicators to determine each area’s probability of outperforming the ACWI, for example. U.S. Markets are weighted accordingly relative to benchmark weightings.
Explore Allocation
To select smaller markets, the fund uses a multi-factor technical ranking system to choose the top markets. The markets with the highest rankings split the non-core model allocation equally.
When Market Risks Become Extraordinarily High — Reduce Your Portfolio Risk
The model remains fully invested unless the Catastrophic model is triggered, whereupon the equity-invested position may be trimmed by up to 50%.
The Catastrophic Stop model combines time-tested, objective indicators designed to identify periods of high risk for the broad U.S. equity market. The model uses price-based, breadth, deviation from trend, fundamental, economic, interest rate, behavioral, and volatility-based indicator composites.
When Market Risks Return To Normal — Put Your Money Back To Work
When the Catastrophic Stop model moves back to bullish levels, indicating lower risk, the strategy will reverse toward being fully invested.
Disclosures
The data and analysis contained within are provided “as is” and without warranty of any kind, either express or implied. The information is based on data believed to be reliable, but it is not guaranteed. Day Hagan DISCLAIMS ANY AND ALL EXPRESS OR IMPLIED WARRANTIES, INCLUDING, BUT NOT LIMITED TO, ANY WARRANTIES OF MERCHANTABILITY, SUITABILITY, OR FITNESS FOR A PARTICULAR PURPOSE OR USE. All performance measures do not reflect tax consequences, execution, commissions, and other trading costs, and as such, investors should consult their tax advisors before making investment decisions, as well as realize that the past performance and results of the model are not a guarantee of future results. The Smart Sector® Strategy is not intended to be the primary basis for investment decisions, and the usage of the model does not address the suitability of any particular investment for any particular investor.
Using any graph, chart, formula, model, or other device to assist in deciding which securities to trade or when to trade them presents many difficulties, and their effectiveness has significant limitations, including that prior patterns may not repeat themselves continuously or on any particular occasion. In addition, market participants using such devices can impact the market in a way that changes the effectiveness of such devices. Day Hagan believes no individual graph, chart, formula, model, or other device should be used as the sole basis for any investment decision and suggests that all market participants consider differing viewpoints and use a weight-of-the-evidence approach that fits their investment needs.
Past performance does not guarantee future results. No current or prospective client should assume future performance of any specific investment or strategy will be profitable or equal to past performance levels. All investment strategies have the potential for profit or loss. Changes in investment strategies, contributions or withdrawals, and economic conditions may materially alter the performance of your portfolio. Different types of investments involve varying degrees of risk, and there can be no assurance that any specific investment or strategy will be suitable or profitable for a client’s portfolio. Historical performance results for investment indexes and/or categories generally do not reflect the deduction of transaction and/or custodial charges or the deduction of an investment management fee, the incurrence of which would have the effect of decreasing historical performance results. There can be no assurances that a portfolio will match or outperform any particular benchmark. Comparisons to indices are inherently unreliable indicators of future performance. The strategies used to generate the performance vary from those used to generate the returns depicted in the benchmarks. Investors cannot directly invest in an index.
The information contained herein is provided for informational purposes only and should not be construed as investment advice or a recommendation to buy or sell any security. The securities, instruments, or strategies described may not be suitable for all investors, and their value and income may fluctuate. Past performance is not indicative of future results, and there is no guarantee that any investment strategy will achieve its objectives, generate profits, or avoid losses.
This material is intended to provide general market commentary and should not be relied upon as individualized investment advice. Investors should consult with their financial professional before making any investment decisions based on this information.
The material may contain “forward-looking” information that is not purely historical in nature. Such information may include, among other things, projections, forecasts, estimates of market returns, and proposed or expected portfolio composition. Day Hagan Asset Management, its affiliates, employees, or third-party data providers shall not be liable for any loss sustained by any person relying on this information. All opinions and views expressed are subject to change without notice and may differ from those of other investment professionals within Day Hagan Asset Management or Ashton Thomas Private Wealth, LLC.
Accounts managed by Day Hagan Asset Management or its affiliates may hold positions in the securities discussed and may trade such securities without notice.
Day Hagan Asset Management is a division of and doing business as (DBA) Ashton Thomas Private Wealth, LLC, an SEC-registered investment adviser. Registration with the SEC does not imply a certain level of skill or training.
This material is for educational purposes only. Further distribution is prohibited without prior permission. Please see the information on Disclosures and Fact Sheets here: https://dhfunds.com/literature. Charts with models and return information use indices for performance testing to extend the model histories, and they should be considered hypothetical. All Rights Reserved. (© Copyright 2026 Day Hagan Asset Management.)
All hypothetical results are presented for illustrative purposes only. Back-testing and other statistical analysis is provided in use simulated analysis and hypothetical circumstances to estimate how it may have performed prior to its actual existence. The results obtained from "back-testing" information should not be considered indicative of the actual results that might be obtained from an investment or participation in a financial instrument or transaction referencing the Index. The Firm provides no assurance or guarantee that the products/securities linked to the strategy will operate or would have operated in the past in a manner consistent with these materials. The hypothetical historical levels have inherent limitations. Alternative simulations, techniques, modeling or assumptions might produce significantly different results and prove to be more appropriate. Actual results will vary, perhaps materially, from the simulated returns presented.
© 2026 Day Hagan Asset Management
Definitions:
S&P/ASX 200 – Designed to measure the performance of the 200 largest index-eligible stocks listed on the Australian Securities Exchange by float-adjusted market capitalization.
PMI — A survey-based economic indicator that measures business activity in sectors such as manufacturing and services; readings above 50 generally indicate expansion, while readings below 50 indicate contraction.
CPI — A measure of inflation that tracks changes in the prices consumers pay for goods and services over time.
Core Inflation — Inflation excluding more volatile items, typically food and energy, used to gauge underlying price trends.
Federal Reserve (Fed) — The central bank of the United States, responsible for monetary policy, interest rates, and financial stability.
ECB — The European Central Bank, responsible for setting monetary policy for countries that use the euro.
Bank of Japan (BoJ) — Japan’s central bank, responsible for monetary policy, interest rates, and financial conditions in Japan.
Bank of Canada (BoC) — Canada’s central bank, responsible for setting policy rates and managing inflation and economic stability.
Bank of England (BoE) — The United Kingdom’s central bank, responsible for monetary policy and financial stability.
SNB — The Swiss National Bank, responsible for monetary policy and maintaining price stability in Switzerland.
PBoC — The People’s Bank of China, which manages monetary policy, liquidity, and key lending benchmarks in China.
S&P 500 — A major U.S. stock market index tracking 500 large publicly traded U.S. companies; widely used as a benchmark for the U.S. equity market.
DJIA — The Dow Jones Industrial Average, a price-weighted stock index of 30 large U.S. companies, often used as a headline indicator of the U.S. stock market.
Nasdaq Composite — A stock market index composed largely of companies listed on the Nasdaq exchange, with especially heavy representation from technology and growth stocks.
STOXX 600 — A broad European stock index that tracks 600 large, mid, and small companies across Europe.
Nikkei 225 — A major Japanese stock market index tracking 225 prominent Japanese companies.
TSX — Canada’s main stock market benchmark, often referring to the S&P/TSX Composite Index.
CAC 40 — France’s main stock market index, tracking 40 major French companies.
DAX — Germany’s main stock market index, tracking major German listed companies.
FTSE 100 — The leading U.K. stock market index, tracking 100 large companies listed in London.
Shanghai Composite — A major Chinese stock index tracking stocks listed on the Shanghai Stock Exchange.
Shenzhen Component — A major Chinese stock index tracking companies listed on the Shenzhen Stock Exchange.
ACWI ex-U.S. Index — The MSCI All Country World Index excluding the United States; a benchmark for developed and emerging equity markets outside the U.S.
10-Year Yield — The interest rate paid on a 10-year government bond; a key benchmark for long-term borrowing costs and valuation.
OAT Yield — The yield on French government bonds.
Policy Rate — The benchmark interest rate set by a central bank to influence borrowing costs, inflation, and economic activity.
Basis Point (bp) — One one-hundredth of a percentage point; 25 basis points equals 0.25%.
Relative Strength — A measure of how a market, sector, or asset performs compared with another market or benchmark.
Overweight / Underweight / Neutral — Portfolio positioning terms: overweight means above benchmark allocation, underweight means below benchmark allocation, and neutral means roughly in line with the benchmark.
