
Day Hagan Smart Sector® with Catastrophic Stop Strategy Update April 2026
A downloadable PDF copy of the Article:
Day Hagan Smart Sector® with Catastrophic Stop Strategy Update April 2026 (pdf)
Executive Summary
U.S. stocks faced a turbulent March, despite a strong rebound on the final trading day. Over the month, the S&P 500 index declined 5.1%, the Dow Jones Industrial Average dropped 5.4%, and the Nasdaq Composite fell 4.8%. Investors spent much of March grappling with higher energy costs, renewed inflationary pressures, and persistent concerns about slowing growth. The late-month rally on March 31—when the S&P 500 surged 2.9%, and the Nasdaq leaped 3.8%—was fueled by hopes of a de-escalation in the U.S.-Iran conflict. However, this rebound was insufficient to offset a month dominated by geopolitical shocks and pronounced sector rotation.
Sector performance underscored the market’s volatility. Energy emerged as the clear leader and, by month-end, was the only S&P 500 sector to post a gain, buoyed by a sharp spike in oil prices following disruptions near the Strait of Hormuz. This momentum extended to segments of the materials sector, particularly metals, mining, chemicals, and fertilizers. In contrast, health care endured its steepest monthly decline since 2009, while technology faced continued pressure for a fifth consecutive month as investors questioned AI valuations, the sustainability of capital expenditures, and the earnings vulnerability of high-multiple growth stocks amid rising rates and energy costs. Consumer-focused sectors also appeared more exposed, with gasoline prices surpassing $4 per gallon and threatening to cut into discretionary spending.
The economic environment was not recessionary, but it remained challenging. Manufacturing activity improved, with the ISM index rising to 52.7, and February retail sales increasing 0.6%. Nonetheless, these positive data points were overshadowed by rising input costs and ongoing supply chain disruptions. The Federal Reserve maintained interest rates at 3.50% to 3.75%, reinforcing its higher-for-longer stance amid persistent inflation risks. This mattered because earnings expectations stayed relatively robust: FactSet’s March 27 data projected S&P 500 first-quarter earnings growth of 13.0%, led by information technology, materials, and financials, while health care is expected to experience the largest earnings decline.
Sector
Consumer Discretionary
Consumer Staples
Communication Services
Energy
Financials
Health Care
Industrials
Information Technology
Materials
Real Estate
Utilities
Outlook (relative to benchmark weighting)
Underweight
Underweight
Overweight
Neutral
Underweight
Underweight
Underweight
Overweight
Neutral
Overweight
Overweight
Sector Review
Our April sector tilts suggest a portfolio with a selective, somewhat barbelled posture rather than a broad pro-cyclical stance. The overweights in Information Technology and Communication Services point to a preference for secular growth, innovation, and large-cap platform businesses, while the overweights in Utilities and Real Estate add a more defensive, income-oriented element. At the same time, the underweights in Consumer Discretionary, Consumer Staples, Financials, Health Care, and Industrials indicate that the portfolio is avoiding large parts of both the cyclical and traditional defensive universe relative to the benchmark. With Energy and Materials held at neutral, there is no strong directional call on commodity-sensitive sectors. Overall, the positioning suggests a portfolio that favors growth leadership and earnings durability while remaining cautious on the broader economic cycle, with some implied sensitivity to a stable or declining rate environment given the tilt toward Real Estate and Utilities.
Consumer Discretionary: Positive signals in March were driven more by macro trends than by market momentum. Consumer Discretionary drew support from stable consumer credit and mixed housing activity. Retail sales rose 0.6% month-over-month and 3.7% year-over-year in February, while housing starts reached a 1.487 million annualized pace. Despite higher mortgage rates, homebuilder sentiment edged up to 38 from 37, signaling activity remained soft but intact. The Fed’s steady policy rate at 3.5%–3.75% preserved a workable backdrop for rate-sensitive discretionary sectors, even as investors questioned the duration of this pause.
However, negative signals were broader and more plentiful. The sector’s relative strength lagged across multiple technical measures, signaling a loss of investor sponsorship. Rising long-term yields (30-year Treasury at 4.91% by month-end, up 22 basis points) and mortgage rates (6.38%–6.43%) weighed on sentiment. Consumer confidence slipped, with the University of Michigan index dropping to 53.3 from 56.6, and the S&P Global services PMI fell to an eleven-month low at 51.1. These pressures were particularly acute for cyclical, confidence-sensitive areas within Consumer Discretionary.
Overall, March was marked by mixed spending data and a tougher macro environment. Manufacturing surveys improved (ISM at 52.7, S&P Global at 52.3), but input prices spiked amid geopolitical tensions and energy concerns. Business activity slowed, with the composite PMI at an 11-month low (51.4), the dollar was up nearly 3%, and oil prices surging nearly 40%. Labor data added caution: February nonfarm payrolls fell by 92,000, and the unemployment rate rose to 4.4%. While discretionary spending remained stable, markets demanded more, rewarding strong company stories but punishing weak outlooks—evidenced by Nike’s post-earnings selloff despite beating expectations.
Figure 1: The Consumer Discretionary sector is in minor oversold territory, with relative net new highs having plummeted. A reversal back above the 0% bracket would generate a buy signal, potentially indicating renewed investor demand. (Note: All charts are proprietary from Day Hagan Asset Management.)
Consumer Staples: Consumer Staples showed limited but meaningful strength in March. The sector’s relative trend versus its moving average indicated ongoing leadership as investors sought earnings visibility and balance-sheet quality. Supportive financial conditions, with the Chicago Fed National Financial Conditions Index at -0.48, favored defensives even as volatility rose. The Fed’s steady policy rate (3.5%–3.75%) provided a solid backdrop amid geopolitical and energy price uncertainty. In this environment, Staples’ appeal stemmed not from robust internal growth but from its reliable earnings that outshone those of more volatile cyclical sectors.
However, negative signals were broader and more forceful. Technical indicators—momentum, trend deviation, net new highs, and breadth—turned bearish, revealing weak sector participation underneath the defensive index surface. Fundamentals also deteriorated: food inflation accelerated to 3.1%, consumer sentiment fell to 53.3, and both composite (51.4) and services (51.1) PMIs softened. The 10-year Treasury yield averaged 4.35%, the dollar gained 1%, and WTI crude surged to $96.07, up nearly 40% over the month. These factors pressured margins, challenged valuations, and weakened the outlook for Staples, especially for multinationals facing higher input costs and currency headwinds.
March also saw investors grow wary of Staples’ high valuations as earnings forecasts softened; the sector index fell 5.6% after a prior safe-haven rally. Company results highlighted this divide: Campbell’s cut guidance amid weak snack demand; General Mills only reaffirmed after lowering its outlook; while Costco delivered robust growth, with same-store sales up 6.7% and net income up 14%. The result was not a broad defensive move but a rotation toward select leaders with proven pricing power and execution, while weaker operators lost momentum.
Figure 2: The Staples sector has reversed from a short-term overbought condition, indicating that investors are potentially moving back toward more risk-on exposure.
Communication Services: A number of positive indicators point to Communication Services still carrying relative leadership in March, even if that leadership narrowed. Relative strength versus its moving-average cross stayed constructive, relative price deviation from trend remained supportive, and one of the two overbought/oversold measures was also bullish. The sector’s relative earnings-yield signal added a fundamental tailwind, suggesting investors were still willing to pay for scalable cash flows in platform-heavy business models. That fit the month’s backdrop: the Fed held rates at 3.5%–3.75%, while the U.S. services PMI, though softer, remained in expansion at 51.1. In other words, growth cooled, but not enough to fully unwind preference for large-cap communication platforms with strong operating leverage.
The negative indicators within the composite model show that leadership was not one-sided. One overbought/oversold measure turned bearish, and the sector’s relative strength versus the 10-year minus 2-year Treasury spread also weakened. That matters because the curve steepened in March: the 10Y-2Y spread averaged about 0.51%, with the 10-year yield around 4.31% and the 2-year around 3.82%. Higher long rates and a steeper curve tend to make it harder to sustain leadership in duration-heavy growth. March also brought softer risk appetite more broadly: consumer sentiment fell to 53.3, and S&P Global said firms cited subdued customer confidence and war-related uncertainty tied to the Middle East. At the stock level, Meta was a major sector influence after Reuters reported plans for sweeping layoffs tied to AI spending discipline, reinforcing the market’s focus on efficiency as much as top-line growth.
Figure 3: Intermediate-term trend indicators showing signs of stress. We’re monitoring closely for signs that a downgrade is warranted.
Energy: The S&P 500 Energy sector strongly benefited from improving technicals and a supportive commodity backdrop. Relative strength turned bullish, reinforced by a constructive moving average crossover and firm 150-day sector breadth, indicating broader participation within the group. Crude oil traded above its 5-month moving average and near the upper end of its 3-month Bollinger range during the month, consistent with stable demand expectations as global PMIs held in expansion. Total world rig count trends were supportive of relative performance, suggesting disciplined supply growth rather than aggressive expansion. The trade-weighted U.S. dollar was largely neutral, limiting currency headwinds for globally priced commodities. However, not all signals are aligned. Rolling five-month volatility was elevated relative to the baseline, tempering conviction. Free cash flow momentum softened compared to prior quarters as earnings growth normalized. Crude oil days of supply ticked higher in recent data releases, and spot price relative strength was weaker than longer-term measures, reflecting range-bound trading. Overbought/oversold readings were neutral, indicating limited short-term extremes. Overall, February reflected improving breadth and trend alignment, balanced against inventory dynamics and moderating cash flow acceleration.
Figure 4: The energy sector is benefiting from geopolitical upheavals. Nonetheless, inventories continue to accumulate.
Financials: Financials benefited from strong momentum, attractive valuations, and easy credit conditions in March. Relative strength remained bullish, volatility was contained, and bank loan growth reached a record $13.60 trillion. The Fed’s steady policy rate (3.5%–3.75%) and a somewhat-loose Chicago Fed National Financial Conditions Index (-0.475) signaled stable funding. Credit continued to flow, and earnings expectations held up, making the sector appealing even as the broader market turned more selective. However, negative indicators outweighed the positives. Price trends, relative return metrics, and sentiment all turned bearish. The 2-year Treasury yield climbed to 3.81%, the yield curve steepened, and the dollar strengthened to 120.89. Investment-grade spreads widened, and economic optimism fell to 47.5. Geopolitical risks and oil price spikes further clouded the rate outlook. The market favored well-capitalized balance sheets but questioned the sector's overall durability.
Figure 5: Perhaps surprisingly, bank loan growth has been relatively steady throughout the geopolitical upheavals and energy shocks.
Healthcare: The only constructive signal in Health Care was a bullish momentum-reversal reading, suggesting the sector may be approaching exhaustion on the downside, even though the headline trend implies otherwise. Beyond that, the macro backdrop in March was not especially hostile to defensive balance sheets: the Fed held rates steady at 3.5%–3.75%, keeping policy restrictive but stable rather than tightening further. That kind of setup can create room for selective mean reversion in large-cap pharma, managed care, and services names after extended underperformance.
The negative indicators, however, were far more numerous and more consistent. Relative price trend, relative momentum, 100-day breadth, sector trends, maximum relative drawdown (a measure of downside volatility), medical CPI, health-care spending, and sector book yield all leaned bearish, while the construction-linked input was neutral. In quantitative terms, that is the profile of a sector lacking both internal participation and a compelling fundamental re-rating catalyst. March data help explain why. Medical care inflation was unchanged at 3.2%, while broader core inflation also ran at 2.5%, leaving investors with little reason to expect a near-term policy pivot that would lift defensive growth multiples. At the same time, U.S. personal spending for January, reported in March, showed health care services still rising by $37.4 billion, but that support was not enough to offset weak sector sponsorship. Reuters also highlighted industry friction around payments and costs, noting that hospitals and insurers accelerated AI investment as they tried to manage long-running reimbursement pressure. Put simply, March was a month in which Health Care offered pockets of value, but not enough breadth or momentum to command leadership.
Figure 6: Health Care’s relative breadth has continued to deteriorate from last month’s update.
Industrials: The positive indicators for Industrials include fewer 210-day new lows, stronger cash-flow yield, firmer relative performance versus the CRB Index, a stronger trade-weighted dollar relationship, and improving industrial production, all of which leaned bullish. That lines up with March’s macro tape: U.S. industrial production rose 1.4% year over year in February and 0.2% month over month, while ISM manufacturing advanced to 52.7 in March and S&P Global manufacturing reached 52.4, both consistent with an industrial cycle that was still expanding. A firmer dollar, with the nominal broad index at 120.885 in March, also tended to coincide with leadership in higher-quality industrial franchises rather than deep cyclicals. Company commentary reinforced that split: FedEx said demand was holding steady at the start of March and raised full-year guidance, a useful read-through for the transport and logistics sector.
The negative indicators were broader and pointed to a sector that struggled to convert decent macro data into positive relative performance. Relative momentum, price trend, RSI, volatility, sales yield, and the oil-linked relationship all turned bearish, while consumer-confidence sensitivity was neutral. March explains why: crude oil rose 39.7% over the month, and the CRB Index climbed 16.2%, lifting input costs just as ISM prices paid jumped to 78.3, the highest since June 2022. Reuters also noted worsening supplier deliveries tied to disruptions in the Middle East, while Boeing pushed back the expected timing of commercial-airplane profitability to 2027 due to higher costs associated with the Spirit acquisition. In short, March favored selected industrial operators, but rising costs and uneven execution capped broader sector leadership.
Figure 7: Relative price momentum showing signs of a potential peak.
Information Technology: The composite model’s positive indicators remained focused on leadership and sentiment. Relative price momentum remained bullish, the relative short-interest signal was supportive, and earnings-revision breadth also leaned positive, suggesting analysts were still finding enough upside in selected software, semis, and platform-linked names to keep capital engaged. That fit March’s operating backdrop: the Fed held rates at 3.5%–3.75%, and services activity, while softer, stayed in expansion at 51.1. At the stock level, AI spending remained the dominant narrative. Reuters reported that Meta outlined a new in-house AI chip roadmap in March, and by month-end, Nvidia deepened its ecosystem push with a $2 billion investment in Marvell, underscoring that demand for computer, networking, and inference infrastructure remained a live theme.
The negative indicators point to a more crowded and rate-sensitive setup beneath that headline strength. Both overbought/oversold measures turned bearish, sales yield was neutral, and the sector’s relationship to market-based inflation expectations was bearish. March explains why. Trading Economics reported the U.S. 10-year breakeven inflation rate at about 2.30% in March, while the 10-year Treasury yield touched 4.4% and rose sharply during the month amid surging oil prices and rising risk of conflict in the Middle East. Reuters noted that this bond-market move hit Big Tech at an awkward moment, just as hyperscalers were committing extraordinary AI capex. In short, March kept Tech leadership alive, but with a higher discount rate, higher energy costs, and less room for valuation error.
Figure 8: Positive earnings revision breadth continues to provide bullish support for the Information Technology sector.
Materials: The positive indicators for Materials were centered on trend confirmation rather than broad enthusiasm. Relative strength versus the moving-average cross, price momentum, price deviation from trend, sector volatility, emerging-versus-developed equity momentum, and sales yield all leaned bullish. That fit March’s macro backdrop: U.S. manufacturing stayed in expansion, with S&P Global’s manufacturing PMI at 52.4, and the Fed held rates steady at 3.5%–3.75%, preserving a workable backdrop for cyclical exposure. The sector also benefited from a still-firm cross-asset inflation pulse, even as leadership narrowed beneath the surface.
The negative indicators suggest that Materials’ leadership was uneven and increasingly commodity-specific. Relative price trend and overbought/oversold conditions turned bearish, while momentum links to copper, silver, gold, natural gas, earnings yield, and materials production also weakened toward the end of the month. March’s price action explains a good deal of that tension: copper fell 4.49% over the month, natural gas fell 4.37%, and gold dropped 10.07% on a stronger dollar and higher real-rate pressure, even as the broader commodity backdrop stayed firm. U.S. industrial production data were constructive overall, but the sector’s own production-sensitive signal lagged, implying that equity performance was not keeping pace with the underlying industrial cycle. The main March influence was geopolitical: the Iran conflict pushed energy costs higher and lifted inflation concerns, but it did not translate into a clean rally across metals and chemicals. In practical terms, March looked like a month in which Materials kept some cyclical appeal, yet stock selection mattered more than sector beta.
Figure 9: The Materials sector has reversed from a significant overbought condition and is back in oversold territory.
Real Estate: The number of positive indicators within the composite model is unusually broad for a rate-sensitive sector. Relative price trend, 50-day breadth, performance versus homebuilders, unemployment, the 30-year Treasury yield, construction-supplies activity, and economic surprises all leaned bullish, while price deviation from trend was neutral. March’s macro backdrop helps explain that support: housing starts were running at a 1.487 million annualized pace, NAHB builder sentiment improved to 38 from 37, and U.S. industrial production rose 0.2% month over month in February, with manufacturing still expanding in March. Even with borrowing costs climbing, the sector retained a relative bid because growth-sensitive areas of the market were dealing with a messier mix of higher oil, higher inflation risk, and more volatile long rates.
The negative indicators point to a market that was constructive relative to its peers but not comfortable in absolute terms. The percentage of positive days and NFIB small-business credit conditions were bearish, a reminder that participation was uneven and financing conditions below the surface were not especially friendly. March was shaped by higher mortgage rates as geopolitical stress around Iran pushed oil and Treasury yields higher; the MBA 30-year mortgage rate climbed to 6.43% for the week ending March 20, the highest since early October, and Reuters reported rates reached 6.38% by March 26. Labor data also carried some caution, with unemployment at 4.4% in the February data released during March. For REITs and housing-linked equities, that left the sector in an interesting place: better relative tone than many cyclicals, but with affordability and credit still capping upside.
Figure 10: Watching the weakness in the Homebuilding sub-industry for signs that the Real Estate sector may be under longer-term pressures.
Utilities: The positive indicators for Utilities were anchored in trend and income (dividend yield). Relative strength versus the moving-average cross, price reversals, deviation from trend, crude-oil sensitivity, capacity utilization, and dividend yield all leaned bullish, suggesting the sector continued to attract capital as investors sought steadier cash flows amid a choppier macro month.
Several negative indicators indicate that the sector’s leadership was not broad-based. Relative momentum, both overbought/oversold measures, 50-day breadth, the earnings-yield spread versus the 10-year Treasury, and the manufacturing PMI measures are bearish, while the copper/gold ratio was neutral. In March, higher long yields mattered: the 10-year Treasury ended March 31 at 4.32%, a tougher setup for bond-proxy equities. Manufacturing also strengthened, with S&P Global PMI at 52.3 and ISM at 52.7, reducing the urgency of a full defensive rotation. Put simply, Utilities in March 2026 looked supported by income and macro caution, but capped by rising rates and limited internal participation.
Figure 11: Based on this measure, the relative uptrend in Utilities remains intact.
Catastrophic Stop Update
The Catastrophic Stop model combines time-tested, objective indicators designed to identify high-risk periods for the equity market. The model entered April recommending a fully invested equity allocation relative to the benchmark.
The weight of the evidence suggests that any weakness is unlikely to extend into a significant downtrend at this time. Of course, if our model triggers a sell signal (below 40% for two consecutive days), indicating more substantial problems, we will raise cash immediately.
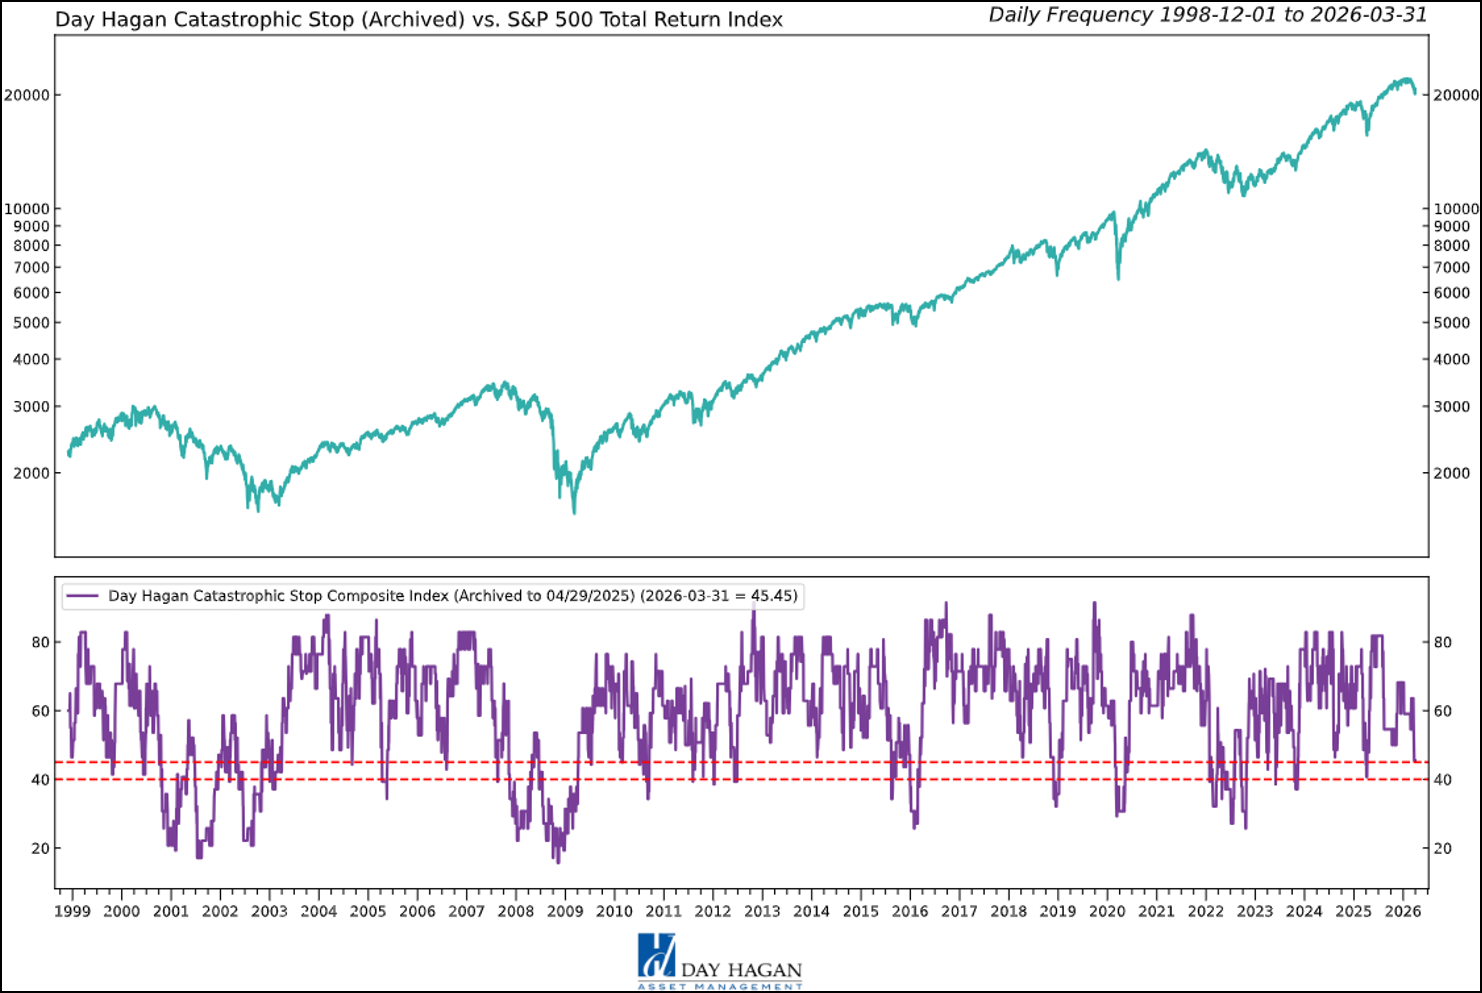
Figure 12: The Catastrophic Stop model recommends a fully invested equity position (relative to the benchmark). Because the model uses indices to extend its history, it is considered hypothetical.
Hypothetical and historical past performance is not indicative of future results. There can be no assurance that any investment or strategy will achieve its objectives or avoid substantial losses or have comparable results. This information is provided for illustrative purposes only and is not a prediction, projection, or guarantee of future performance. Hypothetical results do not reflect actual trading, were derived using the benefit of hindsight, and may not reflect material economic and market events. Actual results vary and depend on many factors and subject to risk and uncertainties.
The Day Hagan Daily Market Sentiment Composite (part of the Catastrophic Stop Model) indicates extreme pessimism is firmly in place. From a contrary opinion perspective, this has historically been constructive.
Figure 13: A buy signal would occur if the Composite rises back above the 30 level, indicating that investors are becoming more optimistic on the market.
Our goal is to stay on the right side of the prevailing trend and introduce risk management when conditions deteriorate. Currently, the uptrend remains intact. The broader-based composite models, which call for U.S. and international economic growth, inflation trends, liquidity, and equity demand, remain constructive. The Catastrophic Stop model is positive, and we are aligned with its message. If our models shift to bearish levels, we will raise cash.
This strategy uses measures of price, valuation, economic trends, liquidity, and market sentiment to make objective, rational, and unemotional decisions about how much capital to allocate and where to invest it.
Day Hagan Asset Management
1000 S. Tamiami Trl
Sarasota, FL 34236
Toll Free: (800) 594-7930
Office Phone: (941) 330-1702
Website: https://dayhagan.com or https://dhfunds.com
This material is for educational purposes only. Further distribution is prohibited without prior permission. Please see the information on Disclosures and Fact Sheets here: https://dhfunds.com/literature. Charts with models and return information use indices for performance testing to extend the model histories, and they should be considered hypothetical. All Rights Reserved. (© Copyright 2026 Day Hagan Asset Management.)
Day HaganSmart Sector®
With Catastrophic Stop ETF
Symbol: SSUS
Disclosures
The data and analysis contained within are provided “as is” and without warranty of any kind, either express or implied. The information is based on data believed to be reliable, but it is not guaranteed. Day Hagan DISCLAIMS ANY AND ALL EXPRESS OR IMPLIED WARRANTIES, INCLUDING, BUT NOT LIMITED TO, ANY WARRANTIES OF MERCHANTABILITY, SUITABILITY, OR FITNESS FOR A PARTICULAR PURPOSE OR USE. All performance measures do not reflect tax consequences, execution, commissions, and other trading costs, and as such, investors should consult their tax advisors before making investment decisions, as well as realize that the past performance and results of the model are not a guarantee of future results. The Smart Sector® Strategy is not intended to be the primary basis for investment decisions, and the usage of the model does not address the suitability of any particular investment for any particular investor.
Using any graph, chart, formula, model, or other device to assist in deciding which securities to trade or when to trade them presents many difficulties, and their effectiveness has significant limitations, including that prior patterns may not repeat themselves continuously or on any particular occasion. In addition, market participants using such devices can impact the market in a way that changes the effectiveness of such devices. Day Hagan believes no individual graph, chart, formula, model, or other device should be used as the sole basis for any investment decision and suggests that all market participants consider differing viewpoints and use a weight-of-the-evidence approach that fits their investment needs.
Past performance does not guarantee future results. No current or prospective client should assume future performance of any specific investment or strategy will be profitable or equal to past performance levels. All investment strategies have the potential for profit or loss. Changes in investment strategies, contributions or withdrawals, and economic conditions may materially alter the performance of your portfolio. Different types of investments involve varying degrees of risk, and there can be no assurance that any specific investment or strategy will be suitable or profitable for a client’s portfolio. Historical performance results for investment indexes and/or categories generally do not reflect the deduction of transaction and/or custodial charges or the deduction of an investment management fee, the incurrence of which would have the effect of decreasing historical performance results. There can be no assurances that a portfolio will match or outperform any particular benchmark. Comparisons to indices are inherently unreliable indicators of future performance. The strategies used to generate the performance vary from those used to generate the returns depicted in the benchmarks. Investors cannot directly invest in an index.
The information contained herein is provided for informational purposes only and should not be construed as investment advice or a recommendation to buy or sell any security. The securities, instruments, or strategies described may not be suitable for all investors, and their value and income may fluctuate. Past performance is not indicative of future results, and there is no guarantee that any investment strategy will achieve its objectives, generate profits, or avoid losses.
This material is intended to provide general market commentary and should not be relied upon as individualized investment advice. Investors should consult with their financial professional before making any investment decisions based on this information.
Data and analysis are provided “as is” without warranty of any kind, either express or implied. Day Hagan Asset Management, its affiliates, employees, or third-party data providers shall not be liable for any loss sustained by any person relying on this information. All opinions and views expressed are subject to change without notice and may differ from those of other investment professionals within Day Hagan Asset Management or Ashton Thomas Private Wealth, LLC.
Accounts managed by Day Hagan Asset Management or its affiliates may hold positions in the securities discussed and may trade such securities without notice.
Day Hagan Asset Management is a division of and doing business as (DBA) Ashton Thomas Private Wealth, LLC, an SEC-registered investment adviser. Registration with the SEC does not imply a certain level of skill or training.
There is no guarantee that any investment strategy will achieve its objectives, generate dividends, or avoid losses.
This material is for educational purposes only. Further distribution is prohibited without prior permission. Please see the information on Disclosures and Fact Sheets here: https://dhfunds.com/literature. Charts with models and return information use indices for performance testing to extend the model histories, and they should be considered hypothetical. All Rights Reserved. (© Copyright 2026 Day Hagan Asset Management.)
Sector Definitions:
S&P 500 — A stock market index tracking 500 of the largest publicly traded U.S. companies; commonly used as a benchmark for the overall U.S. equity market.
Dow Jones Industrial Average (DJIA) — A price-weighted stock index of 30 large U.S. companies, often used as a headline measure of the stock market.
Nasdaq Composite — A stock market index that includes thousands of stocks listed on the Nasdaq exchange, with heavy exposure to technology companies.
PMI (Purchasing Managers’ Index) — A survey-based economic indicator that measures business activity; readings above 50 generally indicate expansion, while readings below 50 indicate contraction.
ISM (Institute for Supply Management) Index — A widely followed U.S. manufacturing activity index based on purchasing manager surveys; used to gauge economic momentum.
CPI (Consumer Price Index) — A measure of inflation that tracks changes in the prices consumers pay for goods and services.
Medical CPI — A CPI subcategory that measures inflation specifically in medical care goods and services.
Federal Reserve (the Fed) — The central bank of the United States, responsible for setting monetary policy and influencing interest rates and financial conditions.
Benchmark weighting — The percentage weight a sector or asset has in a benchmark index, used as a reference point for portfolio positioning.
Overweight — A portfolio position above the benchmark weighting, reflecting a more favorable view of that sector or asset.
Underweight — A portfolio position below the benchmark weighting, reflecting a less favorable view of that sector or asset.
Neutral — A portfolio position roughly in line with the benchmark weighting, indicating no strong directional preference.
Sector rotation — A market dynamic in which investors shift money between sectors based on changing economic, interest-rate, or earnings expectations.
Relative strength — A measure of how a stock, sector, or asset performs compared with a benchmark or another asset.
Breadth — A technical measure showing how broadly market participation is spread, such as how many stocks in a sector are advancing or hitting new highs/lows.
RSI (Relative Strength Index) — A technical momentum indicator used to assess whether an asset may be overbought or oversold.
Yield curve — The relationship between yields on short- and long-term Treasury securities; changes in its shape can signal shifts in economic expectations.
10Y-2Y spread — The difference between the 10-year and 2-year U.S. Treasury yields, often used as a quick measure of the yield curve’s steepness.
WTI crude — West Texas Intermediate crude oil, a key U.S. benchmark price for oil.
REITs (Real Estate Investment Trusts) — Companies that own, operate, or finance income-producing real estate and typically trade like stocks.
All Rights Reserved. (© Copyright 2026 Day Hagan Asset Management.)
© 2026 Day Hagan Asset Management
