
Day Hagan Smart Sector® Fixed Income Strategy Update April 2026
A downloadable PDF copy of the Article:
Day Hagan Smart Sector® Fixed Income Strategy Update April 2026 (pdf)
Executive Summary
Fixed income markets in March were shaped less by a benign disinflation narrative and more by a late-month stagflation shock tied to the war in Iran and the surge in oil prices. U.S. Treasury yields rose sharply over the month, with the two-year posting its biggest monthly increase since October 2024 and the 10-year rising by nearly 40 basis points before retracing part of the move in the final days of March (and after the April 3 payrolls report). The Federal Reserve held rates steady on March 18 and emphasized that inflation remained elevated; markets moved away from expecting an imminent easing cycle as higher energy prices complicated the policy outlook, even though policymakers still pointed to limited cuts later this year. March labor data no longer support the idea of a clean, steady softening trend: payroll growth rebounded to 178,000 on April 3 after February weakness, reinforcing the Fed’s cautious stance.
Investment-grade corporates remained relatively stronger, but the tone became more defensive. Issuance stayed very active, supported by still-open primary markets and strong demand for large, high-quality deals, yet spreads were no longer simply grinding tighter as higher Treasury yields and macro uncertainty limited total returns. High-yield held up better than rates for much of the period because carry remained supportive, but widening dispersion and a more fragile refinancing backdrop persisted as investors became less willing to underwrite weaker balance sheets.
Private credit is no longer best described as simply “continuing to attract capital.” By early April, the more important story was rising strain: higher financing costs for private-credit vehicles, increasing concern about software-heavy portfolios, redemption pressure, and withdrawal limits at Blue Owl funds all pointed to mounting liquidity and credit-quality risks. Reuters reported that analysts now see the potential for materially higher default rates in parts of the sector, and policymakers have become more vocal about transparency and valuation concerns.
TIPS were driven increasingly by the energy shock rather than by a stable, range-bound inflation backdrop. Oil’s March surge pushed inflation fears back to the forefront, so inflation compensation and real yields were both influenced by the market’s effort to price a more complicated mix of weaker growth and higher near-term price pressure.
Emerging-market debt faced a less supportive environment. Fund flows weakened as the Iran conflict reverberated across risk assets, and the dollar’s path became less clearly benign. Hard-currency debt still had some support from carry, but local markets were more exposed to oil, currency volatility, and shifting central-bank expectations, leaving performance more uneven across countries and regions.
Looking ahead to April, investors will focus less on the timing of straightforward policy easing and more on whether the energy shock broadens into stickier inflation or gives way to growth damage. Fed communication, oil-price volatility, credit-spread behavior, and signs of stress in private credit now matter at least as much as the next incremental inflation print in shaping fixed income performance.
Holdings
Fixed Income Sector
US 1-3 Month T-bill
US 3-7 Year Treasury
US 10-20 Year Treasury
TIPS (short-term)
US Mortgage-Backed
US Floating Rate
US Corporate
US High Yield
International Corporate Bond
Emerging Market Bond
Outlook (relative to benchmark)
Overweight
Neutral
Neutral
Underweight
Overweight
Neutral
Overweight
Underweight
Overweight
Underweight
Position Details
U.S. Treasuries: For U.S. Treasuries, the constructive signals for April are concentrated in relative strength versus the equity market trend, and credit default swaps are relatively stable, which fits a month in which investors still valued duration as portfolio insurance against slower growth, tighter financial conditions, and rising geopolitical uncertainty. The neutral technical-momentum reading suggests that support existed, but it was inconsistent. That makes sense in the context of March: Treasuries repeatedly attracted demand on growth worries and risk-off episodes, especially as markets weighed softer labor-market momentum and the possibility that higher energy costs would eventually restrain activity. The Fed also held the funds rate at 3.50%-3.75% in March, reinforcing a wait-and-see stance rather than a renewed tightening cycle.
The negative signals were more directly tied to what the market traded on a day-to-day basis. Relative strength versus a technical cross was bearish, and the inflation-expectations relationship was also bearish, reflecting the month’s dominant pressure point: a sharp rise in oil prices linked to the Middle East conflict and disruption around the Strait of Hormuz. The U.S. 10-year yield rose from roughly 4.13% at the start of March to about 4.37% by early April, while the 10-year breakeven inflation rate averaged about 2.30% in March. Reuters also reported ISM manufacturing rose to 52.7 in March, but with supplier delays and surging prices paid, a combination that reinforced inflation anxiety more than bond-market comfort. In short, March favored caution for long duration even as Treasuries retained some potential defensive appeal.
Figure 1: The increase in CDS rates is negative for bonds, overall.
U.S. TIPS: Positive indicators were tied to the market’s core use case in March: inflation protection regained relevance as commodity prices surged and credit conditions looked less comfortable. Relative strength versus high-yield spreads, inflation expectations, and commodity price trends was bullish, which aligns cleanly with the month’s macro backdrop. The Middle East conflict and disruption around the Strait of Hormuz drove a sharp rise in oil prices, and the U.S. 10-year breakeven inflation rate at 2.30% in March. At the same time, the Fed held the policy rate at 3.50%-3.75% on March 18, leaving investors to weigh an energy-led inflation pulse against a still-cautious central bank. In that setting, TIPS retained appeal as a more targeted hedge than nominal Treasuries.
The negative indicators showed that March was not an easy month in any form. Relative strength versus the moving-average cross, technical RSI, and momentum mean reversion was bearish, consistent with a market facing higher real yields and unstable price action. The U.S. 10-year TIPS yield rose by about 28 basis points over the past month to 2.04% as of April 2, suggesting a meaningful repricing in real rates. Global bonds were headed for their steepest monthly loss in years as oil-driven inflation fears lifted yields. Put differently, March supported the inflation-linkage thesis for TIPS, but rising real yields limited the upside in outright price terms.
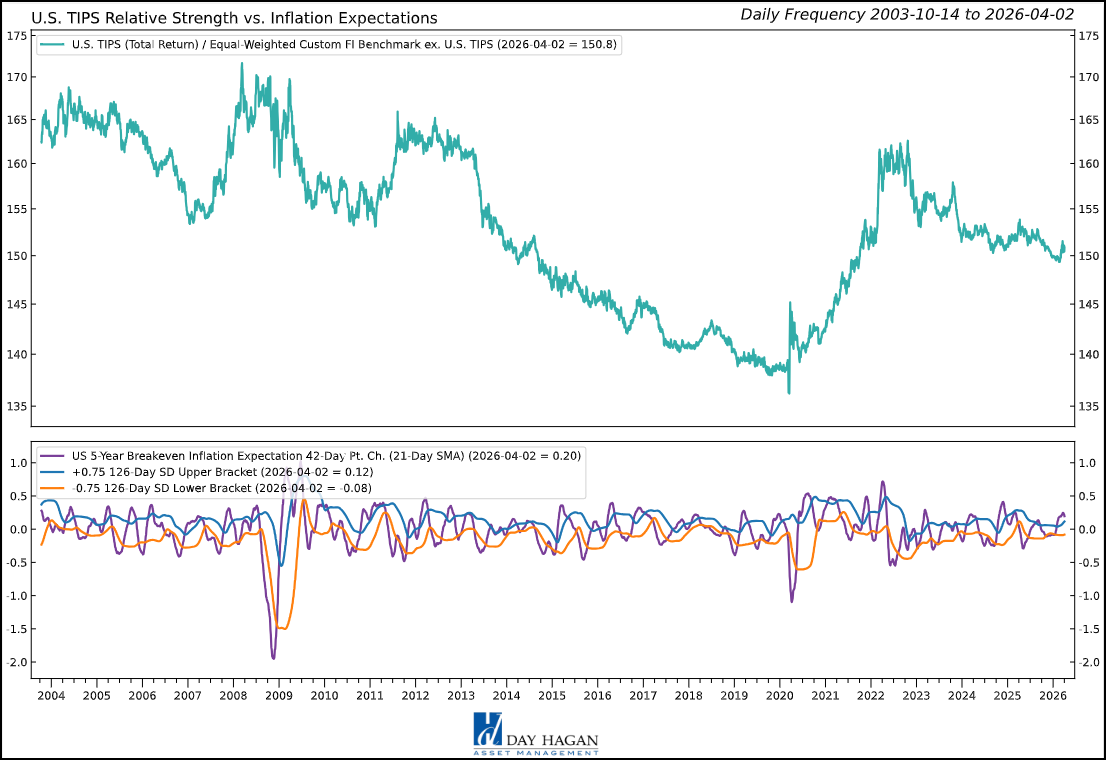
Figure 2: 5-year breakeven inflation expectations are potentially showing early signs of peaking.
U.S. Mortgage-Backed Securities: For U.S. agency mortgage-backed securities, the composite model remained constructive as it entered April. Relative strength versus high-yield spreads, the moving-average cross, the relative-strength slope, the 10-year Treasury yield, inflation expectations, and RSI all pointed in the same direction: MBS retained relative appeal as investors sought spread product with high credit quality, decent carry, and less fundamental deterioration than lower-quality credit. That backdrop fit the month. The Fed held policy steady at 3.50%-3.75% in March, while bank holdings of mortgage-backed securities remained sizable at roughly $2.73 trillion, underscoring the market’s role as a core income asset. Even as rates rose, agency MBS remained comparatively well placed because the market was confronting inflation risk and geopolitical stress, not an immediate deterioration in agency credit quality.
The headwind in March was not credit, so much as duration and convexity. The Middle East conflict and oil shock lifted inflation concerns, pushed Treasury yields higher, and fed directly into mortgage pricing. The U.S. 10-year yield rose over the month, while the average 30-year mortgage rate climbed to 6.38% by March 26 and 6.43% for the week ending March 20; Reuters tied that move directly to war-driven oil and inflation fears. For MBS investors, that meant slower prepayments, wider mortgage borrowing costs, and a more unstable rate backdrop. In practical terms, March favored higher-quality spread exposure, while reminding investors that MBS still trades through the Treasury market first.
Figure 3: High-yield option-adjusted spreads also show potential signs of peaking.
U.S. Floating Rate Notes (FLRN): For U.S. Floating Rate Notes, the positive indicators are unusually broad. Signals tied to the technical cross, relative-strength slope, technical momentum, and the OIS swap-rate backdrop all point to a market that remained well aligned with March’s macro regime. That makes intuitive sense. FLRNs were built for a month like March: The Fed held the funds rate steady at 3.50%–3.75%, SOFR finished March at 3.68%, and the 3-month Treasury bill secondary-market rate averaged 3.61% for the month, preserving attractive carry without asking investors to take much duration risk.
The more neutral signal came from volatility extremes, suggesting that FLRNs were useful but not dramatically repriced as a crisis trade. March’s broader fixed-income backdrop helps explain that. Rising oil prices tied to the Middle East conflict heightened inflation concerns, lifted Treasury yields, and prompted investors to scale back expectations for near-term Fed easing. The 2-year yield climbed sharply in March, while the 10-year yield also moved materially higher amid weak auctions, higher energy prices, and fiscal concerns that weighed on sentiment. In that environment, FLRNs looked comparatively well placed because their coupons adjusted with front-end rates rather than fighting the duration selloff directly. In practical terms, March favored instruments with stable credit quality, low interest-rate sensitivity, and income linked to policy rates, which is exactly where FLRNs tend to compare well within the Treasury complex.
Figure 4: Floating Rate Securities do not do well when equity volatility is moving higher from low levels. It can be interpreted as investors becoming more concerned about equity valuations. FLRNs (non-Treasury) are often issued by lower-quality companies. (Note: Y-axis is inverted.)
U.S. IG Corporates: For U.S. investment-grade corporates, the positive indicators leaned toward market structure rather than outright momentum. Relative strength versus the U.S. dollar, the technical cross, implied bond volatility, and option-adjusted spreads were favorable, while the credit default swap signal was neutral. That lines up with how March actually traded: high-quality credit remained comparatively well anchored, as spreads stayed relatively contained even as the rate backdrop grew more difficult. The ICE BofA U.S. Corporate Index option-adjusted spread was at 0.93% in March, with the AA corporate spread at 0.58%, suggesting investors were still willing to own high-grade carry despite the broader volatility shock. The market also benefited from its place in the capital structure: credit quality remained sound, and demand for bond income persisted even as cross-asset risk appetite became less stable.
The negative signal was price mean reversion, and that fits the month’s main headwind: rising underlying yields. March was dominated by the Middle East conflict, the associated oil shock, and a repricing of inflation risk. The Federal Reserve held rates at 3.50%–3.75%, but investors pushed Treasury yields materially higher as rate-cut expectations faded; Reuters reported the benchmark 10-year Treasury yield rose by nearly 40 basis points in March. Higher all-in yields mattered for investment-grade corporates, even with spreads relatively orderly, because duration still did the heavy lifting in total return volatility. In practical terms, March favored high-quality spread exposure over lower-quality credit, but it did not spare investment-grade bonds from the broader rates selloff.
Figure 5: Stronger flows back into the U.S. indicate demand for U.S. assets during these times of volatility.
U.S. High Yield: The composite remains in defensive mode, even though relative strength versus the absolute total-return moving-average cross was bullish. This suggests there were still pockets of carry support beneath the surface, especially in higher-quality parts of the market. That interpretation fits the March activity better than a blanket risk-off narrative: spreads widened, but not to distressed territory. The broad ICE BofA U.S. High Yield option-adjusted spread increased from 3.28% to 3.46% in March, with BB spreads at 2.22%, and single-B spreads at 3.77%, indicating that investors continued to differentiate meaningfully by quality rather than abandoning the asset class outright.
Negative indicators were more numerous and better aligned with what the market actually traded on. Relative strength versus the VIX moving-average cross, the technical cross, U.S. small-cap equity trend, OAS reversals, and bond breadth all turned bearish, pointing to weaker participation and a less forgiving risk backdrop. March was dominated by the Middle East conflict and the resulting oil shock, which drove inflation concerns higher and pushed Treasury yields up as expectations for Fed easing faded. Reuters reported that oil prices surged dramatically in March as disruptions in the Strait of Hormuz intensified, while the high-yield market had to absorb a higher all-in-yield environment without much help from falling base rates. In practice, March favored selectivity, shorter duration within credit, and higher-quality high-yield over the market-beta trade.
Figure 6: High-yield bonds often correlate positively with small-cap equity trends.
International IG Bonds: For international investment-grade bonds, the positive indicators were the ones tied to credit defensiveness rather than outright rate leadership. Relative strength versus option-adjusted spreads, equity risk, and credit default swaps remained supportive, consistent with a month in which higher-quality credit still looked useful in multi-asset portfolios, even as global markets grew more unstable. Spreads did not behave like a classic credit accident; instead, investors continued to distinguish between duration stress and outright balance-sheet deterioration. That distinction mattered because the month’s dominant shock was geopolitical and inflationary, not a sudden collapse in corporate fundamentals.
The negative indicators were the trend measures. The relative strength slope and the moving-average cross were both bearish, indicating that March was a difficult month for global duration. The U.S.-Israel war on Iran and the threat to the Strait of Hormuz drove crude sharply higher, with oil up roughly 48% over the month by early April, while Reuters reported that global bond prices were heading for their steepest monthly loss in years. Central banks largely stood still, but the market did not: the ECB was expected to hold its deposit rate at 2% in March, the Fed held at 3.50%–3.75%, and rising inflation concerns pushed core sovereign yields higher across the U.S. and Europe. For international IG, March was therefore a month in which credit quality still offered ballast, but rising government yields overwhelmed trend and total-return momentum.
Figure 7: This MACD trend indicator is now negative, as fund flows reverse from international back to the U.S.
Emerging Market Bonds: For emerging-market bonds, relative strength versus commodity-market strength was bullish, which makes sense in a month when commodity-linked sovereigns partially offset the broader rates shock. Oil and other raw materials moved sharply higher as the Middle East conflict intensified. That mattered because commodity exporters within EM had a more credible macro cushion than importers, especially where external balances and fiscal revenues were linked to energy or metals. More broadly, EM policy settings were not uniformly hostile; Across March decisions, several emerging-market central banks still managed small cuts, while many others held steady, underscoring that domestic policy paths were differentiated rather than collapsing into a single risk-off regime.
Negative indicators were more numerous and better matched with the month’s price action. Relative strength versus the absolute moving-average cross, the EM currency index against the dollar, relative-strength slope, and emerging-equity momentum all turned bearish, pointing to a market pressured by a stronger dollar, weaker technicals, and fading risk appetite. The nominal U.S. dollar index against emerging-market economies remained elevated heading into March, and global bond prices were poised for their steepest monthly loss in years as war-driven oil prices reignited inflation fears. For EM debt, that combination was especially awkward: higher U.S. Treasury yields, a firmer dollar, and uneven EM FX performance tightened financial conditions even when credit fundamentals remained intact. In practical terms, March favored selectivity, shorter duration, and commodity-linked sovereign risk over broad EM beta.
Figure 8: Similar to High-yield and small-cap equities, EM bonds often positively correlate with EM equity momentum. Recently, momentum has been negative. However, judging by the chart, current levels are consistent with a potential oversold condition.
Catastrophic Stop Model
The Catastrophic Stop model combines time-tested, objective indicators to identify high-risk periods for equities and fixed-income assets that are highly correlated with the equity market. The model entered April recommending a fully invested allocation relative to the benchmark for credit sectors with high correlations to equities.
The weight of the evidence suggests that any equity weakness is unlikely to extend to a significant downtrend at this time. Of course, if our model triggers a sell signal (below 40% for two consecutive days), indicating more substantial problems, we will reduce exposure.
Figure 9: The Catastrophic Stop model recommends a fully invested position (relative to the benchmark). Because the model uses indices to extend its history, it is considered hypothetical.
Hypothetical and historical past performance is not indicative of future results. There can be no assurance that any investment or strategy will achieve its objectives or avoid substantial losses or have comparable results. This information is provided for illustrative purposes only and is not a prediction, projection, or guarantee of future performance. Hypothetical results do not reflect actual trading, were derived using the benefit of hindsight, and may not reflect material economic and market events. Actual results vary and depend on many factors and subject to risk and uncertainties.
The Day Hagan Daily Market Sentiment Composite (part of the Catastrophic Stop Model) indicates extreme pessimism is firmly in place. From a contrary opinion perspective, this has historically been constructive.
Figure 10: A buy signal would occur if the Composite rose back above the 30 level, indicating that investors are becoming more optimistic on the market.
Our goal is to stay on the right side of the prevailing trend and introduce risk management when conditions deteriorate. Currently, the uptrend remains intact. The broader-based composite models calling U.S. economic growth, international economic growth, inflation trends, liquidity, and equity demand remain broadly constructive. The Catastrophic Stop model is positive, and we are aligned with the message. If our models shift to bearish levels, we will raise cash and lower exposure to risk-on fixed-income sectors.
This strategy uses measures of price, valuation, economic trends, liquidity, and market sentiment to make objective, rational, and unemotional decisions about how much capital to risk and where to allocate it.
For more information, please contact us at:
Day Hagan Asset Management
1000 S. Tamiami Trl
Sarasota, FL 34236
Toll Free: (800) 594-7930
Office Phone: (941) 330-1702
Website: https://dayhagan.com or https://dhfunds.com
© 2026 Day Hagan Asset Management
This material is for educational purposes only. Further distribution is prohibited without prior permission. Please see the information on Disclosures and Fact Sheets here: https://dhfunds.com/literature. Charts with models and return information use indices for performance testing to extend the model histories, and they should be considered hypothetical. All Rights Reserved. (© Copyright 2026 Day Hagan Asset Management.)
Day Hagan Smart Sector® Fixed Income ETF
Symbol: SSFI
Disclosures
The data and analysis contained within are provided “as is” and without warranty of any kind, either express or implied. The information is based on data believed to be reliable, but it is not guaranteed. Day Hagan DISCLAIMS ANY AND ALL EXPRESS OR IMPLIED WARRANTIES, INCLUDING, BUT NOT LIMITED TO, ANY WARRANTIES OF MERCHANTABILITY, SUITABILITY, OR FITNESS FOR A PARTICULAR PURPOSE OR USE. All performance measures do not reflect tax consequences, execution, commissions, and other trading costs, and as such, investors should consult their tax advisors before making investment decisions, as well as realize that the past performance and results of the model are not a guarantee of future results. The Smart Sector® Strategy is not intended to be the primary basis for investment decisions, and the usage of the model does not address the suitability of any particular investment for any particular investor.
Using any graph, chart, formula, model, or other device to assist in deciding which securities to trade or when to trade them presents many difficulties, and their effectiveness has significant limitations, including that prior patterns may not repeat themselves continuously or on any particular occasion. In addition, market participants using such devices can impact the market in a way that changes the effectiveness of such devices. Day Hagan believes no individual graph, chart, formula, model, or other device should be used as the sole basis for any investment decision and suggests that all market participants consider differing viewpoints and use a weight-of-the-evidence approach that fits their investment needs.
Past performance does not guarantee future results. No current or prospective client should assume future performance of any specific investment or strategy will be profitable or equal to past performance levels. All investment strategies have the potential for profit or loss. Changes in investment strategies, contributions or withdrawals, and economic conditions may materially alter the performance of your portfolio. Different types of investments involve varying degrees of risk, and there can be no assurance that any specific investment or strategy will be suitable or profitable for a client’s portfolio. Historical performance results for investment indexes and/or categories generally do not reflect the deduction of transaction and/or custodial charges or the deduction of an investment management fee, the incurrence of which would have the effect of decreasing historical performance results. There can be no assurances that a portfolio will match or outperform any particular benchmark. Comparisons to indices are inherently unreliable indicators of future performance. The strategies used to generate the performance vary from those used to generate the returns depicted in the benchmarks. Investors cannot directly invest in an index.
The information contained herein is provided for informational purposes only and should not be construed as investment advice or a recommendation to buy or sell any security. The securities, instruments, or strategies described may not be suitable for all investors, and their value and income may fluctuate. Past performance is not indicative of future results, and there is no guarantee that any investment strategy will achieve its objectives, generate profits, or avoid losses.
This material is intended to provide general market commentary and should not be relied upon as individualized investment advice. Investors should consult with their financial professional before making any investment decisions based on this information.
The material may contain “forward-looking” information that is not purely historical in nature. Such information may include, among other things, projections, forecasts, estimates of market returns, and proposed or expected portfolio composition. Day Hagan Asset Management, its affiliates, employees, or third-party data providers shall not be liable for any loss sustained by any person relying on this information. All opinions and views expressed are subject to change without notice and may differ from those of other investment professionals within Day Hagan Asset Management or Ashton Thomas Private Wealth, LLC.
Accounts managed by Day Hagan Asset Management or its affiliates may hold positions in the securities discussed and may trade such securities without notice.
Day Hagan Asset Management is a division of and doing business as (DBA) Ashton Thomas Private Wealth, LLC, an SEC-registered investment adviser. Registration with the SEC does not imply a certain level of skill or training.
This material is for educational purposes only. Further distribution is prohibited without prior permission. Please see the information on Disclosures and Fact Sheets here: https://dhfunds.com/literature. Charts with models and return information use indices for performance testing to extend the model histories, and they should be considered hypothetical. All Rights Reserved.
All hypothetical results are presented for illustrative purposes only. Back testing and other statistical analysis is provided in use simulated analysis and hypothetical circumstances to estimate how it may have performed prior to its actual existence. The results obtained from "back-testing" information should not be considered indicative of the actual results that might be obtained from an investment or participation in a financial instrument or transaction referencing the Index. The Firm provides no assurance or guarantee that the products/securities linked to the strategy will operate or would have operated in the past in a manner consistent with these materials. The hypothetical historical levels have inherent limitations. Alternative simulations, techniques, modeling or assumptions might produce significantly different results and prove to be more appropriate. Actual results will vary, perhaps materially, from the simulated returns presented.
© 2026 Day Hagan Asset Management
Disclosure
Federal Reserve (Fed) — The central bank of the United States, responsible for setting monetary policy and short-term interest rates.
U.S. Treasuries — Bonds issued by the U.S. government; they are widely used as benchmarks for interest rates and as defensive assets in portfolios.
T-bill (Treasury bill) — A short-term U.S. government security, typically maturing in one year or less.
Duration — A measure of a bond’s sensitivity to changes in interest rates; higher duration usually means greater price movement when yields change.
Yield — The income return on a bond, usually expressed as an annual percentage of its price.
Investment-Grade (IG) Corporate Bonds — Corporate bonds with relatively high credit quality and lower default risk than high-yield bonds.
High-Yield (HY) Bonds — Lower-rated corporate bonds that offer higher yields because they carry higher credit risk.
Private Credit — Non-bank lending, often directly to companies, outside the public bond markets.
TIPS (Treasury Inflation-Protected Securities) — U.S. government bonds designed to protect investors from inflation by adjusting principal based on inflation.
Breakeven Inflation Rate — The market’s implied inflation expectation, calculated as the difference between nominal Treasury yields and TIPS yields.
Real Yield — A bond yield after adjusting for inflation; often referenced in connection with TIPS.
Nominal Yield — A bond yield not adjusted for inflation.
Inflation Expectations — The market’s view of future inflation, which influences both bond yields and asset prices.
Mortgage-Backed Securities (MBS) — Bonds backed by pools of home mortgages; investors receive cash flows from underlying mortgage payments.
Agency MBS — Mortgage-backed securities issued or guaranteed by U.S. government-related agencies, generally viewed as having high credit quality.
Floating Rate Notes (FRNs) — Bonds whose interest payments reset periodically based on a short-term reference rate, reducing interest-rate sensitivity.
SOFR (Secured Overnight Financing Rate) — A key U.S. benchmark short-term interest rate used in loans, derivatives, and floating-rate instruments.
OIS (Overnight Index Swap) Rate — A rate derived from swaps tied to overnight interest rates, often used to gauge policy-rate expectations.
Primary Issuance — The sale of new bonds into the market by governments or companies.
Spread — The yield difference between one bond and a benchmark, often used to measure compensation for credit risk.
Option-Adjusted Spread (OAS) — A spread measure that adjusts for embedded bond options, commonly used in corporate bonds and mortgage-backed securities.
Credit Default Swap (CDS) — A derivative contract used to insure against bond default risk; rising CDS levels often signal greater credit concern.
Carry — The return earned from holding a bond or credit asset, assuming market conditions remain stable.
Refinancing Risk — The risk that a borrower will face higher costs or difficulty when replacing maturing debt with new debt.
Emerging Market (EM) Bonds — Debt issued by governments or companies in developing economies.
Hard-Currency Debt — Emerging-market debt issued in a major foreign currency, usually U.S. dollars or euros.
Local-Currency Debt — Emerging-market debt issued in the borrower’s domestic currency, making returns more sensitive to exchange-rate movements.
Risk-On / Risk-Off — Market environments where investors are either more willing to buy riskier assets (“risk-on”) or prefer safer assets (“risk-off”).
RSI (Relative Strength Index) — A technical indicator used to assess whether an asset may be overbought or oversold.
VIX — A widely followed measure of U.S. equity market volatility, often called the market’s “fear gauge.”