
Day Hagan Catastrophic Stop Update August 11, 2026
A downloadable PDF copy of the Article:
Summary
The Day Hagan Catastrophic Stop Model improved to 68.18% as the U.S. Corporate High-Yield Bond OAS (option-adjusted spread) factor declined (meaning spreads narrowed), generating a buy signal for equities. Overall, the model continues to support benchmark-level equity exposure.
Notably, both of the model’s U.S. corporate high-yield indicators—option-adjusted spreads and market breadth—remain on buy signals, but only narrowly. Any meaningful deterioration in credit conditions could push them back below their sell thresholds, renewing a more cautious outlook.
Figure 1: The model remains constructive, with the 40% threshold defining the line between participation and defense.
The Day Hagan Daily Market Sentiment Composite sits at 54.75, squarely neutral and well below its excessive-optimism threshold. AAII sentiment has improved, with bulls at 37.0% and bears at 38.0%, leaving households nearly balanced. However, active-manager exposure remains somewhat elevated, while the 0.54 CBOE equity put/call ratio suggests meaningful call buying. Collectively, sentiment is constructive without being broadly euphoric, supporting continued equity participation while offering less contrarian fuel near record market levels.
Figure 2: Sentiment remains neutral, leaving neither a strong contrarian opportunity nor a clear sign of euphoria.
Portfolio Outlook
Overweights in Technology, Financials, and Real Estate provide three distinct potential return engines through innovation, favorable earnings trends, loan growth, market activity, contractual income, and demand for data centers and logistics.
Neutral Energy offers a partial hedge against Iran-related supply disruptions, although weak cash-flow momentum and projected 2027 earnings declines limit conviction. Industrials balance aerospace, defense, automation, and infrastructure opportunities against slower growth and higher fuel costs.
Health Care provides steadier demand and improving 2027 earnings prospects, but near-term growth and momentum remain mixed. Utilities benefit from rising electricity demand, although elevated Treasury yields remain meaningful competition.
Underweights in Consumer Discretionary, Consumer Staples, Communication Services, and Materials reflect weak relative trends, uneven earnings revisions, valuation concerns, pressured purchasing power, rising costs, concentrated earnings, and uncertain commodity demand.
Overall, the portfolio favors improving breadth, visible demand, recurring revenue, pricing power, strong balance sheets, and internally funded growth, reducing its reliance on Fed easing, a broad consumer rebound, or a geopolitical resolution.
Figure 3: S&P 500 Sector Fundamentals and Technicals.
Sources: FactSet Earnings Insight, August 7, 2026 (growth, valuation, ratings and target-price data); Yardeni Research/LSEG Datastream (market-cap weights as of August 10, LTEG as of August 7 and July NERI). Yardeni sector weights | Yardeni LTEG | Yardeni NERI
Methodology: PEG equals forward P/E divided by LTEG. RSI is the 21-day Wilder RSI on the official State Street sector ETFs (SPY for the benchmark). Moving-average breadth is the share of current S&P 500 constituents in each sector whose August 7 close exceeded its 50- or 200-day simple moving average. BF.B and three recent additions with fewer than 200 observations (FDXF, HONA and Q) were excluded from breadth calculations.
Sector Weekly Updates:
Consumer Discretionary: We remain underweight Consumer Discretionary. Valuation is elevated, intermediate momentum and macro signals are weak, and uneven earnings expectations outweigh pockets of improving short-term breadth.
Consumer Staples: We remain underweight Consumer Staples as weak relative trends, limited earnings momentum, an expensive PEG, and low analyst conviction outweigh its traditionally defensive revenue profile.
Communication Services: We remain underweight Communication Services. Attractive valuation, strong 2026 earnings, and analyst support are offset by broadly bearish relative-strength indicators and declining 2027 earnings expectations.
Energy: We hold Energy neutral. Strong bullish indicators, attractive valuation, and exceptional 2026 earnings growth are tempered by weak cash-flow momentum, breadth, and projected 2027 declines.
Financials: We remain overweight Financials, supported by excellent breadth, positive revisions, reasonable valuation, loan growth, and favorable momentum, while acknowledging limited target-price upside and yield-curve risks.
Health Care: We hold Health Care neutral. Improving breadth, reasonable valuation, and stronger 2027 earnings are balanced by weak near-term growth, mixed momentum, and unfavorable fundamental indicators.
Industrials: We hold Industrials neutral. Solid breadth, cash-flow support, and improving earnings expectations offset elevated valuation and PEG, mixed momentum, and sensitivity to commodities and growth.
Information Technology: We remain overweight Information Technology. Most indicators are bullish, reinforced by exceptional earnings growth, strong revisions, analyst sentiment, and an attractive PEG despite concentration risk.
Materials: We remain underweight Materials. Strong 2026 earnings growth and select commodity signals are outweighed by weak relative trends, bearish valuation indicators, and slower 2027 growth.
Real Estate: We remain overweight Real Estate. Favorable trend, credit, rate, and economic indicators support the position, while reasonable valuation and steady growth offset weaker short-term breadth.
Utilities: We hold Utilities neutral. Attractive target-price upside and dividend support are counterbalanced by bearish trend signals, weak RSI, poor short-term breadth, and modest earnings growth.
For our monthly update: https://dayhagan.com/research/day-hagan-smart-sector-strategy-update-august-2026
Figure 4: Sector Relative Strength vs. S&P 500
Market breadth remains constructive. Some 63.5% of Russell 3000 stocks exceed their 50-day average and 68.9% exceed their 200-day average, confirming broad participation as the S&P 500 approaches new highs.
Figure 5: Breadth OK.
Below are visuals for the S&P 500 and NASDAQ 21-day RSIs. Both are approaching short-term overbought levels.
Figure 6: Nearing overbought on a short-term basis.
Figure 7: Interestingly, the Nasdaq looks a little less overbought.
Volatility-target equity exposure still neutral.
Figure 8: Vol-targeting funds’ exposure remains near neutral.
DBMF, our proxy for managed futures and trend followers appears to be slowly reducing exposure to the S&P 500.
Figure 9: Positioning indicators remain mixed, but the overall message is neutral.
The earnings outlook has strengthened over the past 63 days, with S&P 500 forward EPS estimates rising 9.6%. Technology leads, while Communication Services (discussed the non-operating increases last week), Discretionary, Industrials, and Health Care also show unusually strong revisions.
Figure 10: Earnings continue to support equities.
Of note, strategists’ year-end S&P 500 target of 7,845 offers only 1.1% upside from current levels, far below the historical 5.7% forecast cushion. Expectations have largely caught up with the rally, leaving little margin for disappointment.
Figure 11: S&P 500 vs Year-End Strategist Forecasts.
Our cycle work indicates a chance for potential weakness into October, a low during the month, and a year-end rally. Think of this as a “backdrop.”
Figure 12: Updated S&P 500 cycle composite for 2026 and 2027.
U.S. Economic Releases:
Last week’s data showed an economy still expanding, but with a widening gap between solid business activity and weakening labor demand. Manufacturing and services PMIs remained above 50, while construction spending, factory orders, job openings, ADP hiring, and payrolls disappointed. Claims stayed low and unemployment edged down, but wage growth cooled. Inflation signals were mixed: unit labor costs moderated and productivity improved, yet manufacturing input prices remained elevated.
Nonfarm payrolls fell short because hiring nearly stalled and several large sector losses outweighed modest gains. Private payrolls added only 30,000 jobs, while government employment declined 53,000, including 50,000 in local education (which was attributed to a timing mismatch). Leisure and hospitality lost 40,000, retail lost 19,000, and financial activities lost 14,000. Health care and construction gains were insufficient to offset those declines. May and June were also revised lower by a combined 103,000, confirming weaker hiring momentum despite low layoffs.
Figure 13: U.S. Labor Market Data
This week we’ll see several measures of the latest inflation pressures.
Figure 14: U.S. Inflation Data.
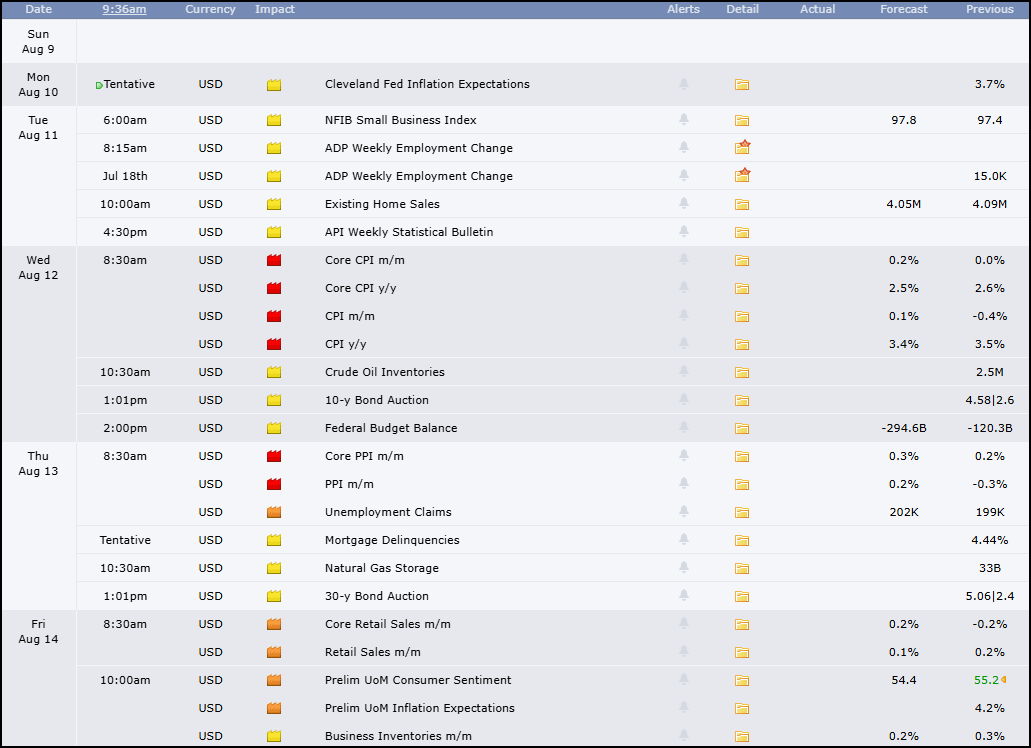
Figure 15: Economic release calendar. Source: Forexfactory.com
Bottom Line: Markets remain constructive but increasingly dependent on earnings delivery. The Catastrophic Stop Model improved to 68.18%, credit signals remain narrowly positive, sentiment is neutral, and breadth is broad. The portfolio favors Technology, Financials, and Real Estate while limiting consumer sectors, Communication Services, and Materials. Forward earnings revisions are strong, but strategist targets imply little upside. Economic activity continues expanding, although hiring has weakened materially. Cycle work suggests possible volatility into October, followed by a potential year-end rally.
For more details on each sector and current model levels, please visit our research page at https://dayhagan.com/research.
This strategy uses measures of price, valuation, economic trends, liquidity, and market sentiment to make objective, rational, and emotion-free decisions about how much capital to place at risk and where to allocate it.
If you would like to discuss any of the above or our approach to investing in more detail, please don’t hesitate to schedule a call or webinar. Please call Tyler Hagan at 941-330-1702 to arrange a convenient time.
Sincerely,
Donald L. Hagan, CFA
Chief Investment Strategist, Partner, Co-Founder
Sources:
This material is for educational purposes only. Further distribution is prohibited without prior permission. Please see the information on Disclosures here: https://dhfunds.com/literature. Charts with models and return information use indices for performance testing to extend model histories; they should be considered hypothetical. All Rights Reserved. © Copyright 2026 Day Hagan Asset Management. Data sources: Day Hagan Asset Management, 3Fourteen Research, J.P. Morgan, Goldman Sachs, Barchart, StreetStats, Atlanta Fed, St. Louis Fed, Koyfin, Yardeni, MarketEar, S&P Global, SPDR, FactSet.
Disclosures
Disclosure: The information contained herein is provided for informational purposes only and should not be construed as investment advice or a recommendation to buy or sell any security. The securities, instruments, or strategies described may not be suitable for all investors, and their value and income may fluctuate. Past performance is not indicative of future results, and there is no guarantee that any investment strategy will achieve its objectives, generate profits, or avoid losses. Investing involves risks, including loss of principal.
This material is intended to provide general market commentary and should not be relied upon as individualized investment advice. Investors should consult with their financial professional before making any investment decisions based on this information.
Bonds are subject to market and interest rate risk if sold prior to maturity. Bond values will decline as interest rates rise, and bonds are subject to availability and changes in price. Bond yields are subject to change. Corporate bonds are considered higher risk than government bonds but normally offer a higher yield and are subject to market, interest, and credit risk.
References to markets, asset classes, and sectors, are generally regarding the corresponding market index. Indexes are unmanaged statistical composites and cannot be invested in directly. Index performance is not indicative of the performance of any investment and does not reflect fees, expenses, or sales charges.
Data and analysis are provided “as is” without warranty of any kind, either express or implied. Day Hagan Asset Management, its affiliates, employees, or third-party data providers shall not be liable for any loss sustained by any person relying on this information. The materials may contain “forward-looking” information that is not purely historical in nature. Such information may include, among other things, projections, forecasts, estimates or market returns, and proposed or expected portfolio composition.
All opinions and views expressed are subject to change without notice and may differ from those of other investment professionals within Day Hagan Asset Management or Ashton Thomas Private Wealth, LLC.
Accounts managed by Day Hagan Asset Management or its affiliates may hold positions in the securities discussed and may trade such securities without notice.
Day Hagan Asset Management is a division of and doing business as (DBA) Ashton Thomas Private Wealth, LLC, an SEC-registered investment adviser. Registration with the SEC does not imply a certain level of skill or training.
There is no guarantee that any investment strategy will achieve its objectives, generate dividends, or avoid losses.
All hypothetical results are presented for illustrative purposes only. Back testing and other statistical analysis is provided in use simulated analysis and hypothetical circumstances to estimate how it may have performed prior to its actual existence. The results obtained from "back-testing" information should not be considered indicative of the actual results that might be obtained from an investment or participation in a financial instrument or transaction referencing the Index. The Firm provides no assurance or guarantee that the products/securities linked to the strategy will operate or would have operated in the past in a manner consistent with these materials. The hypothetical historical levels have inherent limitations. Alternative simulations, techniques, modeling, or assumptions might produce significantly different results and prove to be more appropriate. Actual results will vary, perhaps materially, from the simulated returns presented.
S&P 500 Index—An unmanaged composite of 500 large-cap companies, widely used by professional investors as a performance benchmark for large-cap stocks.
S&P 500 Total Return Index – An unmanaged composite of 500 large capitalization companies. Professional investors widely use this index as a performance benchmark for large-cap stocks. This index assumes reinvestment of dividends.
Russell 3000: The Russell 3000 Index measures the performance of approximately 3,000 of the largest U.S. publicly traded companies, representing about 98% of the investable U.S. equity market.
AAII Sentiment Survey — A weekly survey measuring whether individual investors expect stocks to rise, fall, or remain unchanged over the next six months.
Backwardation — A futures-market structure in which near-term commodity prices exceed longer-dated prices, often indicating tight current supplies.
Benchmark Equity Allocation — The normal percentage of a portfolio assigned to stocks based on its investment objective and risk profile.
Breadth — The degree to which market gains or losses are shared across individual stocks. Broad participation generally strengthens a market trend.
Bull-Bear Spread — The percentage of bullish investors minus the percentage of bearish investors.
Catastrophic Stop Model — Day Hagan’s risk-management model designed to identify periods when major market deterioration may warrant reducing equity exposure.
CDS, or Credit Default Swap — A market-based measure of the perceived risk that a borrower will default. Rising CDS costs generally indicate increasing credit concern.
Contrarian Buy Signal — A signal suggesting widespread pessimism may have become excessive, potentially creating a buying opportunity.
Contrarian Sell Signal — A warning that optimism, risk-taking, or positioning may have become excessive, increasing vulnerability to disappointment.
Daily Market Sentiment Composite — Day Hagan’s 0–100 measure combining multiple indicators of investor psychology. Readings below 30 indicate excessive pessimism, while readings above 70 indicate excessive optimism.
DBMF — The iMGP DBi Managed Futures Strategy ETF, used here as a proxy for positioning among systematic, trend-following strategies.
Drawdown — The percentage decline from an investment’s previous peak to its subsequent low.
Earnings Revisions — Changes analysts make to company profit estimates. Rising estimates are generally supportive of stock prices.
Federal Funds Rate — The Federal Reserve’s primary short-term policy interest rate.
FOMC — The Federal Open Market Committee, the Federal Reserve group responsible for setting monetary policy and interest rates.
Forward Earnings — Analysts’ estimates of company profits over a future period, commonly the next 12 months.
Forward Earnings Growth Rate — The expected percentage increase in future corporate earnings compared with the prior comparable period.
Forward P/E Ratio — A stock’s price divided by expected earnings over the next 12 months. Higher readings generally indicate more demanding valuations.
Magnificent Seven — Alphabet, Amazon, Apple, Meta Platforms, Microsoft, Nvidia, and Tesla.
Maximum Drawdown — The largest peak-to-trough decline experienced during a specified period.
OAS, or Option-Adjusted Spread — The additional yield a bond provides over a comparable Treasury after adjusting for embedded options. Wider spreads generally indicate greater perceived credit risk.
Overbought — A condition in which prices have risen rapidly and may be vulnerable to a pause or pullback.
Oversold — A condition in which prices have fallen rapidly and may be positioned for a rebound.
PEG Ratio — The price-to-earnings ratio divided by expected long-term earnings growth. A lower ratio may indicate a more attractive valuation relative to anticipated growth.
Risk-Off Signal — An indication that market conditions have deteriorated enough to favor reducing exposure to riskier assets.
RSI, or Relative Strength Index — A momentum indicator ranging from 0 to 100. Readings above 70 commonly indicate overbought conditions, while readings below 30 indicate oversold conditions.
Systematic Investors — Strategies that adjust exposure using predefined rules based on trends, volatility, momentum, or other quantitative signals.
VIX — A market-based measure of expected S&P 500 volatility over the next 30 days, sometimes called the market’s fear gauge.
Volatility-Targeting Strategy — A rules-based strategy that generally reduces equity exposure when volatility rises and increases exposure when volatility falls.
WTI — West Texas Intermediate, a major U.S. crude-oil pricing benchmark.
WTI Forward Curve — The series of prices for WTI crude-oil futures across different expiration dates, reflecting supply, demand, storage, and market expectations.
Communication Services sector: The Communication Services Sector includes telecom and media & entertainment companies, including producers of interactive gaming products and companies engaged in content and information creation or distribution through proprietary platforms.
Consumer Discretionary sector: The Consumer Discretionary sector's manufacturing segment includes automobiles & components, household durable goods, leisure products, and textiles & apparel. The services segment includes hotels, restaurants, and other leisure facilities. It also includes distributors and retailers of consumer discretionary products.
Consumer Staples sector: The Consumer Staples sector includes manufacturers and distributors of food, beverages, and tobacco, as well as producers of non-durable household goods and personal products. It also includes distributors and retailers of consumer staples, including food & drug retailers.
Energy sector: The Energy sector includes companies that operate in exploration & production, refining & marketing, and storage & transportation of oil & gas, as well as coal & consumable fuels. It also includes companies that offer oil & gas equipment and services.
Financials sector: The Financials sector encompasses banking, financial services, consumer finance, capital markets, and insurance. It also includes Financial Exchanges & Data and Mortgage REITs.
Fixed Income sector: The Fixed Income sector includes investment securities that pay investors fixed interest payments until maturity. Designed for income generation and capital preservation, this sector includes government, corporate, and municipal bonds, as well as certificates of deposit (CDs).
Health Care sector: The Health Care sector includes health care providers & services, health care equipment & supplies, and health care technology companies. It also includes companies involved in the research, development, production, and marketing of pharmaceuticals and biotechnology products.
Industrials sector: The Industrials sector includes aerospace & defense, building products, electrical equipment, machinery, and companies that offer construction & engineering services. It also includes providers of commercial & professional services, including printing, environmental & facilities services, office services & supplies, security & alarm services, human resources & employment services, and research & consulting services. It also includes companies that provide transportation services.
Information Technology sector: The Information Technology sector includes software and information technology services, manufacturers and distributors of technology hardware & equipment, such as communications equipment, cellular phones, computers & peripherals, electronic equipment and related instruments, and semiconductors and related equipment & materials.
Materials sector: The Materials sector includes chemicals, construction materials, forest products, glass, paper and related packaging products, and metals, minerals, and mining companies, including steel producers.
Real Estate sector: The Real Estate sector includes companies engaged in real estate development and operation. It also includes companies offering real estate-related services and Equity Real Estate Investment Trusts (REITs).
Day Hagan Asset Management
1000 S. Tamiami Trail, Sarasota, FL 34236
Toll-Free: (800) 594-7930
Office Phone: (941) 330-1702
Websites:https://dayhagan.com or https://dhfunds.com
© 2026 Day Hagan Asset Management