
Day Hagan Smart Sector® with Catastrophic Stop Strategy Update August 2026
A downloadable PDF copy of the Article:
Day Hagan Smart Sector® with Catastrophic Stop Strategy Update August 2026 (pdf)
Executive Summary
July was a month of sharp contrasts. The S&P 500 slipped only 0.1%, but the calm index result hid a forceful rotation. Energy gained 10.8%, Financials rose 6.4%, and investors moved toward companies tied to oil, credit, defense, infrastructure, and current cash flow. Technology weakened, with semiconductor shares absorbing the sharpest selling. The market did not reject artificial intelligence. It began asking harder questions about valuation, capital spending, and when today’s enormous investment will become tomorrow’s free cash flow.
The Iran war sat at the center of the month. Renewed threats to shipping through the Strait of Hormuz pushed WTI crude more than 20% higher in July and lifted Brent to roughly $90 per barrel. That move improved the earnings outlook for producers and refiners, but it also raised freight, chemical, packaging, airline, and household-product costs. Oil therefore helped one part of the portfolio while increasing the inflation and margin risk facing several others.
Inflation data provided relief, but not an all-clear. June CPI fell 0.4%, core CPI was unchanged, and producer prices declined 0.3% as goods prices dropped 1.4%. The June PCE price index also fell 0.1%, while core PCE rose just 0.1%. Over twelve months, however, headline and core PCE inflation remained at 3.7% and 3.3%. Compensation costs increased 3.4% from a year earlier, while inflation-adjusted private-sector wages fell 0.4%. Households are still spending, but many are not gaining purchasing power.
The economy is stronger beneath the headline than second-quarter GDP growth of 1.5% suggests. Real final sales to private domestic purchasers, a useful measure of consumer and business demand, grew at a 3.9% annualized rate. Real consumer spending increased 0.4% in June, and industrial production grew at a 4.0% annualized rate during the quarter. Manufacturing output advanced at a 4.7% pace. The July S&P Global Composite PMI rose to 53.6, its highest reading in eight months. Those figures support capital spending, aerospace, power infrastructure, digital services, and selected financial businesses.
The weaker side of the economy is also visible. June payrolls increased by only 57,000, labor-force participation fell to 61.5%, and July consumer confidence declined to 90.8. Housing starts jumped 19.0%, but the increase came from multifamily construction; single-family starts slipped 0.2%. This is not a broad consumer or housing boom. Growth is coming from services, corporate investment, AI infrastructure, energy, defense, and a narrower group of households and businesses with the balance sheets to keep spending.
The Federal Reserve held its target range at 3.50% to 3.75% on July 29. With oil rising and wage costs still firm, the Fed gave investors little reason to expect near-term relief. The 10-year Treasury yield ended July near 4.74%, while the 30-year yield reached roughly 5.27%. Higher long-term rates reward businesses producing cash today and penalize companies whose investment case depends on cheap refinancing or distant profits.
Earnings remain the market’s strongest support. With 61% of S&P 500 companies reporting, 86% had beaten earnings estimates, and 77% had exceeded revenue expectations. FactSet’s blended second-quarter earnings-growth rate reached 47.4%, although large investment gains at Alphabet and Amazon inflated the figure. Excluding both companies, earnings were still growing 28.8%. The portfolio is designed to participate in that profit growth while limiting exposure to weaker consumers, fragile balance sheets, narrow earnings stories, and commodity businesses lacking price confirmation.
Sector
Consumer Discretionary
Consumer Staples
Communication Services
Energy
Financials
Health Care
Industrials
Information Technology
Materials
Real Estate
Utilities
Outlook (relative to benchmark weighting)
Underweight
Underweight
Underweight
Neutral
Overweight
Neutral
Neutral
Overweight
Underweight
Overweight
Neutral
Sector Review
The portfolio’s overweights create three distinct sources of return. Information Technology provides exposure to semiconductors, cloud computing, networking, cybersecurity, and software productivity. Financials add banks, insurers, exchanges, brokers, and asset managers that can benefit from nominal growth, loan demand, market activity, and contained credit spreads. Real Estate adds contractual income and exposure to data centers, logistics, and necessity-based properties where demand is less dependent on a broad housing recovery.
The neutral positions serve different purposes. Energy provides a partial hedge against the Iran war and another oil shock without turning the portfolio into a commodity bet. Industrials provide access to aerospace, defense, automation, electrification, and grid investment, balanced against slower GDP growth and higher fuel costs. Health Care adds steadier demand and product-cycle opportunities, but policy and company-specific risks remain high. Utilities participate in rising electricity demand, yet compete directly with Treasury yields above 5%.
The underweights reduce exposure to areas where the economic burden falls most heavily. Consumer Discretionary is vulnerable to weaker real wages, expensive credit, high gasoline prices, and uneven housing activity. Consumer Staples face price-sensitive shoppers and renewed freight and packaging costs. Communication Services contains exceptional businesses, but index-level earnings are concentrated, and capital spending is climbing. Materials have strong reported earnings, but China, commodity trends, energy costs, and relative price action do not yet support a broad allocation.
Across sectors, the portfolio favors visible demand, recurring revenue, pricing power, strong balance sheets, and businesses able to fund investment internally. It is less dependent on a rapid Fed easing cycle, a broad consumer rebound, or a quick end to the Iran war. The indicators remain part of the process, but their role is to confirm whether market behavior agrees with the fundamental and macro case.
Consumer Discretionary - Underweight
Consumer Discretionary sits where several July pressures meet. Payroll growth slowed to 57,000, real private-sector wages were down 0.4% from a year earlier, consumer confidence fell to 90.8, and gasoline prices rose with the Iran conflict. Credit-sensitive purchases face another obstacle from higher Treasury and financing rates. The consumer is still spending, but the average household has less room for error.
The earnings headline is far stronger than the underlying sector. FactSet reports second-quarter earnings growth of 90.7%, but the rate falls to 6.6% without Amazon. Amazon earned $5.75 per share versus $1.82 expected and reported $220.6 billion in revenue, yet a $53.4 billion pretax investment gain drove much of the profit surprise. Tesla also exceeded revenue expectations, but one e-commerce platform and one automaker do not make the entire sector healthy.
The opportunity set is concentrated. Digital commerce, travel experiences, recurring services, and companies serving higher-income households can still grow. The more difficult areas are lower-income retail, highly financed autos, home furnishings, restaurants with weak traffic, and businesses unable to offset labor and freight costs. The indicators reinforce the underweight through weak trend, momentum, credit, housing, and valuation readings. We would own the strongest franchises selectively rather than buy the broad consumer cycle.
Figure 1: Weak credit, housing, and consumer trends favor selective franchises over broad Discretionary exposure.
Consumer Staples - Underweight
Staples face a different consumer problem. People continue buying food, beverages, and household goods, but they are comparing prices, trading down, and shifting toward private label. June’s softer inflation readings may reduce some commodity pressure, yet July’s oil rebound threatens transportation, packaging, fertilizer, and manufacturing costs. Companies that cannot grow volume may have to choose between protecting market share and protecting margins.
Results illustrated that divide. Coca-Cola reported 7% revenue growth, 5% unit-case volume growth, and an 11% increase in comparable earnings per share. Its brand strength and global reach allowed price and volume to work together. PepsiCo’s revenue rose 6.4%, but North American beverage organic volume fell 4%. Procter & Gamble beat the earnings estimate but narrowly missed revenue expectations and offered modest fiscal 2027 guidance as geopolitical and operating costs increased.
The portfolio would favor beverage, personal-care, and household-product companies with leading brands, international growth, and proven productivity programs. It would be more cautious with packaged-food businesses losing units, companies relying on repeated price increases, and firms facing retailer pushback. Improving breadth and food sales are helpful, but weak relative momentum, trend, and sales yield still support an underweight. The sector offers stability, but not enough growth or value to displace stronger opportunities elsewhere.
Figure 2: Brand strength still matters, but volume pressure and renewed input costs keep Staples underweight.
Communication Services - Underweight
Communication Services is a collection of very different businesses. Digital advertising is benefiting from stronger search activity, AI-assisted targeting, and major events. Streaming companies are using advertising tiers and price increases to improve economics. Wireless carriers offer recurring revenue but face heavy capital needs and limited growth. Traditional media remains caught between declining linear television and the costly transition to streaming.
Alphabet delivered one of the quarter’s best operating reports. Revenue increased 24% to $119.8 billion, Search grew 17%, YouTube advertising rose 13%, and Cloud revenue jumped 82%. The problem is that the sector’s reported 109.8% earnings growth is not representative. Alphabet’s $9.11 in earnings per share included a $98 billion investment gain. Without Alphabet, FactSet estimates that sector earnings would have declined 5.7%.
Meta’s report showed the tradeoff more clearly. Revenue rose 28% to $60.8 billion and advertising activity remained strong, but profit fell 14% amid legal and severance costs. Free cash flow dropped sharply as capital-spending plans increased. These platforms remain excellent businesses, but investors are being asked to fund an increasingly expensive AI race. Weak relative trend, earnings yield, and yield-curve signals support the underweight. We would own select digital platforms, while avoiding broad exposure to slow-growth telecom and challenged media assets.
Figure 3: Digital advertising is strong, but concentration, spending demands, and weak sector breadth argue for an underweight.
Energy - Neutral
Energy offers the portfolio its clearest geopolitical hedge. WTI rose more than 20% in July, Brent finished near $90, and threats to Hormuz kept a risk premium in crude. FactSet estimates that second-quarter sector earnings increased 135.3% and revenue rose 31.7%, helped by an average oil price 45% above the prior year. Chevron reported $70.1 billion in revenue and $6.06 in earnings per share, while Exxon’s revenue increased to $116 billion.
The best opportunities are not identical. Integrated companies combine upstream production with refining and chemicals. Exploration and production firms provide more direct oil exposure but carry greater price sensitivity. Refiners can benefit from wider product margins, although feedstock volatility matters. Midstream companies offer fee-based cash flow and attractive income with less direct commodity risk. Oilfield services need sustained drilling activity, not merely a brief price spike.
The sector’s trend, breadth, inventory, rig-count, and crude-price signals are favorable. The neutral weight nevertheless recognizes that much of July’s move came from war risk. A ceasefire, restored shipping, or additional OPEC supply could remove that premium quickly. We favor low-cost reserves, disciplined capital spending, strong balance sheets, refining leverage, and durable midstream cash flows. Neutral preserves inflation protection without requiring oil to rise indefinitely.
Figure 4: The Energy Sector continues to be supported by low crude inventories.
Financials - Overweight
Financials are one of the portfolio’s broadest opportunities. Large banks benefit from loan growth, trading, investment banking, card spending, and wealth management. Insurers can earn better returns on their bond portfolios and maintain pricing power in selected lines. Exchanges and market-data businesses profit from volatility and trading activity without taking traditional lending risk. Asset managers benefit when markets and client flows improve.
Second-quarter results gave the overweight fundamental support. FactSet’s sector earnings-growth rate rose to 20.1% from 5.4% at June 30, while revenue growth improved to 12.6%. JPMorgan earned $7.70 per share versus $5.59 expected, Goldman Sachs reported $20.98 versus $14.54, and Morgan Stanley, Wells Fargo, Citigroup, and Travelers also exceeded estimates. July’s 6.4% sector gain was supported by more than one business line or one company.
The macro setting is not perfect, but it is workable. Private domestic demand grew 3.9%, loan growth remains supportive, financial credit spreads are contained, and higher nominal activity supports fee revenue. The yield curve and deposit costs remain concerns, while slower hiring could eventually weaken consumer credit. We prefer money-center banks, insurers, exchanges, brokers, and diversified fee businesses over weaker regional lenders with expensive deposits, concentrated commercial-real-estate books, or thin capital cushions.
Figure 5: Broad earnings strength and healthy market activity support Financials, with credit and funding discipline still essential.
Health Care - neutral.
Health Care offers steadier demand than most sectors, but its internal differences are enormous. Managed-care companies must balance premiums, medical utilization, and reimbursement. Pharmaceutical firms depend on product pipelines, patent lives, and policy. Medical-device companies benefit from procedure growth and new product cycles. Life-science tools need research budgets and biotechnology funding to improve. Profitable biotechnology can deliver company-specific upside largely independent of GDP.
The sector’s reported 14.0% earnings decline gives an incomplete picture. Large research and development charges at Gilead and Merck account for much of the weakness. Excluding those companies, FactSet estimates earnings growth of 11.2%. UnitedHealth reported $112.0 billion in revenue, $6.38 in adjusted earnings per share, and $11.1 billion in operating cash flow. Johnson & Johnson’s sales rose 6.6% to $25.3 billion, supported by pharmaceuticals and medical technology.
The portfolio’s neutral weight balances improving trend and breadth against weaker medical-spending, inflation, and valuation signals. We see opportunity in devices, select managed care, profitable biotechnology, specialty pharmaceuticals, and tools companies with recovering orders. We would remain cautious around challenged service providers, policy-sensitive drug pricing, and companies whose pipelines require repeated acquisitions to sustain growth.
Figure 6: Health Care offers product-cycle opportunities, but policy, utilization, and company-specific risks favor a neutral weight. Relative breadth is improving.
Industrials - Neutral
Industrials sit near the center of the economy’s strongest investment themes. Aerospace benefits from commercial backlogs and aftermarket demand. Defense spending is supported by the Iran war and a more unsettled security environment. Electrical equipment, grid components, and power systems serve data centers and electrification. Automation helps manufacturers offset labor shortages and wage costs. Railroads, parcel carriers, and trucking, however, remain sensitive to fuel, trade volumes, and consumer demand.
The macro evidence is encouraging but not uniform. Industrial production rose 0.1% in June and grew at a 4.0% annualized rate during the second quarter. Manufacturing output increased at a 4.7% pace, and the July manufacturing PMI remained in expansion at 53.8. At the same time, GDP slowed to 1.5%, China’s manufacturing PMI fell to 49.2, and rising oil threatens transportation and input margins.
Company results identify the better segments. GE Aerospace reported adjusted revenue growth of 24%, orders up 17%, and free cash flow up 43%. General Dynamics raised guidance as Gulfstream and shipbuilding strengthened. RTX reported solid commercial aftermarket and defense growth. The indicator mix supports participation without calling for a broad cyclical surge. We favor aerospace, defense, grid equipment, automation, and power management over freight, low-margin machinery, and fuel-sensitive transportation.
Figure 7: Aerospace, defense, and electrification lead the opportunity set, while slower growth and higher fuel costs limit the weight. Technical indicators are neutral on balance.
Information Technology - Overweight
Technology remains the portfolio’s primary growth engine, but July clarified where the opportunity lies. Semiconductors and memory supply the computing power. Networking and optical equipment move the data. Cloud platforms provide the infrastructure. Cybersecurity protects it. Software must now prove that AI improves revenue, retention, or margins rather than merely increasing development costs. Power management and cooling have become essential parts of the digital stack.
FactSet estimates second-quarter Technology earnings growth of 69.4%. Semiconductor earnings rose 135%, but the story is broader than chips. Excluding semiconductors, sector earnings still grew 33.0%. Microsoft earned $4.74 per share versus $4.24 expected, Apple posted $2.02 versus $1.89, and Intel also beat estimates. Yet Technology sold off in July, semiconductor shares fell sharply, and Apple dropped after issuing a softer outlook. Strong results were not enough when positioning and expectations were already high.
The portfolio favors companies converting AI spending into cloud consumption, chip demand, network traffic, security budgets, subscription growth, or lower customer costs. It is less interested in businesses using AI language to defend slowing organic growth. Positive earnings revisions, momentum, and sales yield support the overweight, while the short-interest warning and July’s price action argue for disciplined sizing. The opportunity remains large, but the market now demands evidence of return on investment.
Figure 8: Technology remains the growth engine, with emphasis shifting from AI spending promises to measurable returns.
Materials - Underweight
Materials produced strong earnings, but the macro and market evidence remain uneven. FactSet estimates second-quarter sector earnings growth of 42.6%. Chemicals increased 53%, metals and mining 50%, containers and packaging 21%, and construction materials 8%. Nucor earned an adjusted $4.84 per share. Freeport-McMoRan earned an adjusted $0.74 and beat expectations, although revenue of $7.03 billion declined roughly 7% from a year earlier. Dow returned to profitability with operating earnings of $1.44 per share.
Each segment faces a different test. Copper and steel benefit from electrification, grid investment, data centers, and domestic construction. Specialty chemicals can earn attractive margins through differentiated products. Commodity chemicals face energy and capacity pressure. Packaging companies need volume recovery and relief from freight costs. Construction materials depend on infrastructure spending and project activity rather than a broad residential rebound.
The underweight reflects a gap between reported earnings and forward confirmation. China’s manufacturing PMI fell to 49.2, copper and precious-metals signals remain weak, and the sector’s relative trend has not improved enough. July’s oil surge also raises costs for chemicals and packaging. We would own low-cost producers, specialty businesses, and electrification beneficiaries selectively, while waiting for global demand, commodity trends, and market leadership to strengthen before increasing the allocation.
Figure 9: Strong earnings create stock-level opportunities, but China, energy costs, and weak commodity confirmation keep Materials underweight.
Real Estate - Overweight
Real Estate is not one trade. Data centers benefit from AI demand and limited power availability. Industrial warehouses serve e-commerce and supply-chain redesign. Necessity retail enjoys high occupancy and modest new supply. Apartments depend on local job growth, household formation, and the pace of new construction. Office properties still face high vacancies and refinancing risk. The portfolio’s overweight is directed toward the first group, not the entire property market.
July results supported that distinction. Prologis reported core funds from operations of $1.63 per share, up from $1.46, and net earnings rose to $1.13 from $0.61. Equinix raised full-year revenue and EBITDA guidance as data-center demand remained firm. Housing starts jumped 19.0% in June, but multifamily starts rose 76.3% while single-family starts slipped 0.2%. More apartment supply may help activity today while pressuring rent growth later.
The 10-year Treasury yield near 4.74% and the 30-year yield near 5.27% increase financing costs and compete with REIT dividends. That makes balance-sheet quality central to the thesis. The sector’s trend, breadth, credit, and economic-surprise signals support the overweight, but the portfolio would avoid highly leveraged owners, weak office assets, and near-term debt maturities. We prefer contractual rent growth, scarce assets, long debt maturities, and businesses able to fund development without repeated equity issuance.
Figure 10: Data centers, logistics, and necessity retail support the overweight, while leverage and office exposure remain key dividing lines.
Utilities - Neutral
Utilities now stand at the intersection of income investing and industrial growth. Regulated electric utilities can expand their rate bases through transmission, generation, and grid-hardening projects. Data-center demand is lifting load forecasts in markets that had seen little growth for decades. Independent power producers and nuclear operators may benefit from scarce round-the-clock electricity. Gas utilities have steadier demand but less exposure to the AI power buildout.
Company results showed the attraction. Dominion beat profit and revenue estimates as adjusted operating earnings in Virginia rose 22%, helped by data-center load growth. Southern Company’s adjusted earnings increased to $1.13 per share from $0.92. NextEra reported $1.15 in adjusted earnings per share, nearly 10% above the prior year, while continuing to build its renewable and storage backlog.
The challenge is the price paid for that growth. Long Treasuries above 5% give income investors a credible alternative, and only half of reporting Utilities companies had beaten revenue estimates. Higher fuel, construction, and financing costs can also raise customer bills and regulatory friction. Momentum, capacity utilization, oil sensitivity, and dividend yield support exposure, while narrow breadth and weak bond-relative value argue against an overweight. Neutral captures the power-demand theme without treating every utility as an AI beneficiary.
Figure 11: Electricity demand is improving, but rates, valuation, and regulatory execution keep Utilities at a neutral weight. Overbought/oversold indicators are showing signs of oversold conditions.
Catastrophic Stop Update
The Catastrophic Stop model combines time-tested, objective indicators designed to identify high-risk periods for the equity market. The model entered August recommending a fully invested equity allocation relative to the benchmark.
The weight of the evidence suggests that any weakness is unlikely to extend into a significant downtrend at this time. If our model triggers a sell signal (below 40% for two consecutive days), indicating more substantial problems, we will raise cash immediately.
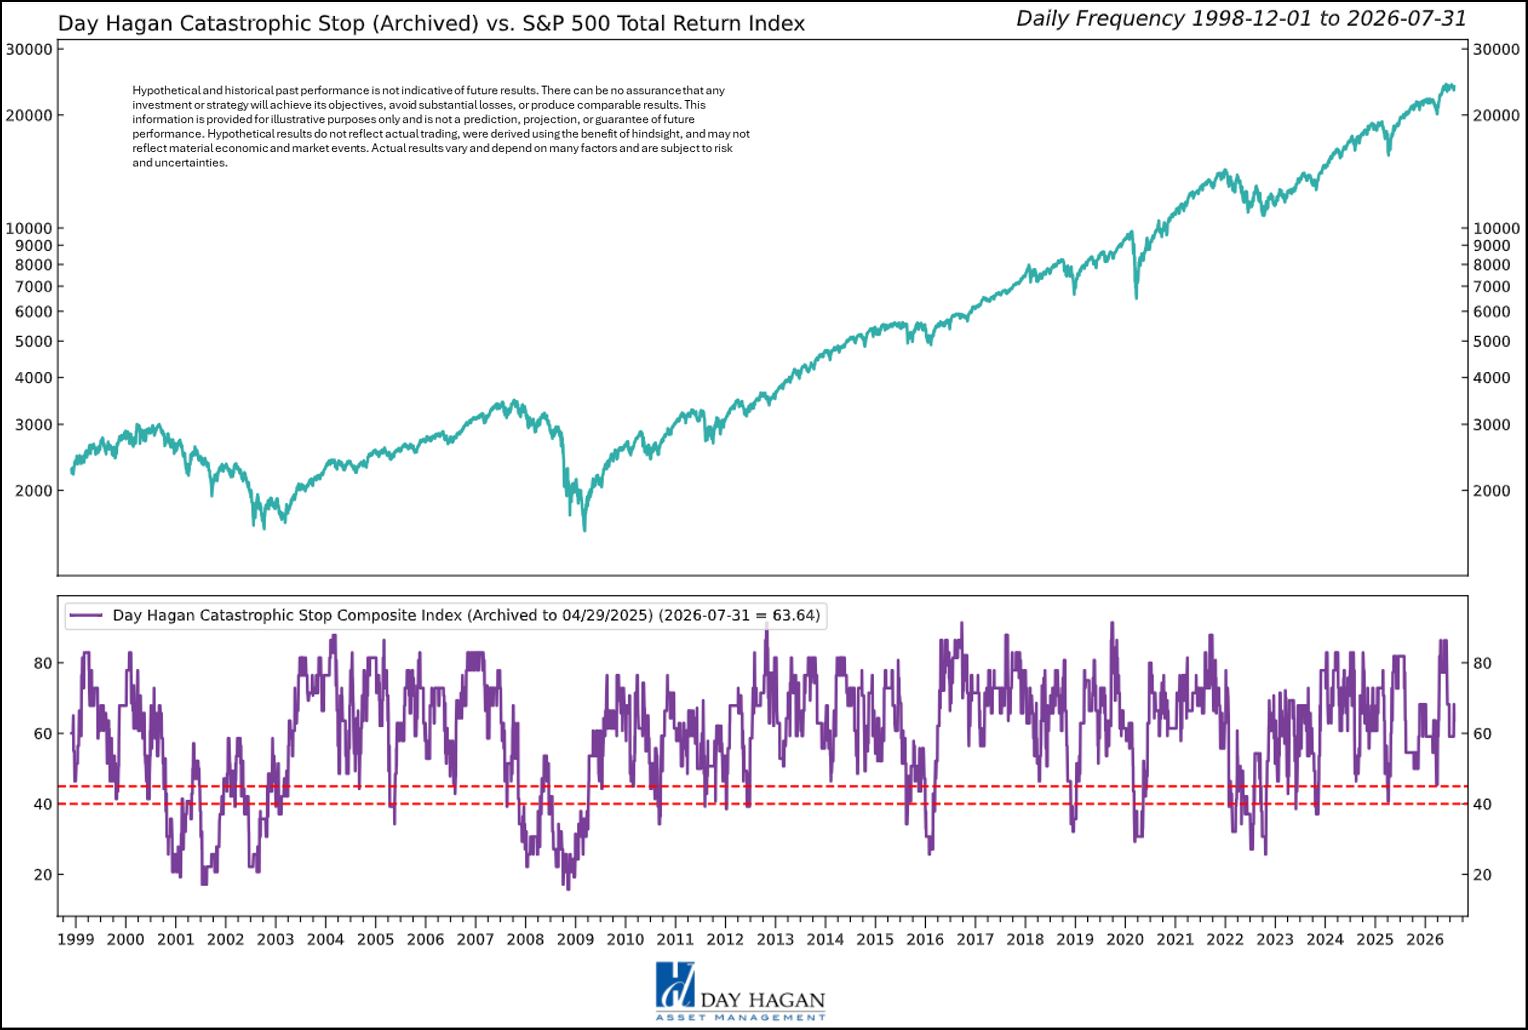
Figure 12: The Catastrophic Stop model recommends a fully invested equity position (relative to the benchmark). Because the model uses indices to extend its history, it is considered hypothetical.
Hypothetical and historical past performance is not indicative of future results. There can be no assurance that any investment or strategy will achieve its objectives or avoid substantial losses or have comparable results. This information is provided for illustrative purposes only and is not a prediction, projection, or guarantee of future performance. Hypothetical results do not reflect actual trading, were derived using the benefit of hindsight, and may not reflect material economic and market events. Actual results vary and depend on many factors and subject to risk and uncertainties.
Our goal is to stay on the right side of the prevailing trend and introduce risk management when conditions deteriorate. Currently, the uptrend remains intact. The broader-based composite models, which call for U.S. and international economic growth, inflation trends, liquidity, and equity demand, remain constructive. The Catastrophic Stop model is positive, and we are aligned with its message. If our models shift to bearish levels, we will raise cash.
This strategy uses measures of price, valuation, economic trends, liquidity, and market sentiment to make objective, rational, and unemotional decisions about how much capital to allocate and where to invest it.
Day Hagan Asset Management
1000 S. Tamiami Trl
Sarasota, FL 34236
Toll Free: (800) 594-7930
Office Phone: (941) 330-1702
Website: https://dayhagan.com or https://dhfunds.com
This material is for educational purposes only. Further distribution is prohibited without prior permission. Please see the information on Disclosures and Fact Sheets here: https://dhfunds.com/literature. Charts with models and return information use indices for performance testing to extend the model histories, and they should be considered hypothetical. All Rights Reserved. (© Copyright 2026 Day Hagan Asset Management.)
Day HaganSmart Sector®
With Catastrophic Stop ETF
Symbol: SSUS
Disclosures
The data and analysis contained within are provided “as is” and without warranty of any kind, either express or implied. The information is based on data believed to be reliable, but it is not guaranteed. Day Hagan DISCLAIMS ANY AND ALL EXPRESS OR IMPLIED WARRANTIES, INCLUDING, BUT NOT LIMITED TO, ANY WARRANTIES OF MERCHANTABILITY, SUITABILITY, OR FITNESS FOR A PARTICULAR PURPOSE OR USE. All performance measures do not reflect tax consequences, execution, commissions, and other trading costs, and as such, investors should consult their tax advisors before making investment decisions, as well as realize that the past performance and results of the model are not a guarantee of future results. The Smart Sector® Strategy is not intended to be the primary basis for investment decisions, and the usage of the model does not address the suitability of any particular investment for any particular investor.
Using any graph, chart, formula, model, or other device to assist in deciding which securities to trade or when to trade them presents many difficulties, and their effectiveness has significant limitations, including that prior patterns may not repeat themselves continuously or on any particular occasion. In addition, market participants using such devices can impact the market in a way that changes the effectiveness of such devices. Day Hagan believes no individual graph, chart, formula, model, or other device should be used as the sole basis for any investment decision and suggests that all market participants consider differing viewpoints and use a weight-of-the-evidence approach that fits their investment needs.
Past performance does not guarantee future results. No current or prospective client should assume future performance of any specific investment or strategy will be profitable or equal to past performance levels. All investment strategies have the potential for profit or loss. Changes in investment strategies, contributions or withdrawals, and economic conditions may materially alter the performance of your portfolio. Different types of investments involve varying degrees of risk, and there can be no assurance that any specific investment or strategy will be suitable or profitable for a client’s portfolio. Historical performance results for investment indexes and/or categories generally do not reflect the deduction of transaction and/or custodial charges or the deduction of an investment management fee, the incurrence of which would have the effect of decreasing historical performance results. There can be no assurances that a portfolio will match or outperform any particular benchmark. Comparisons to indices are inherently unreliable indicators of future performance. The strategies used to generate the performance vary from those used to generate the returns depicted in the benchmarks. Investors cannot directly invest in an index.
The information contained herein is provided for informational purposes only and should not be construed as investment advice or a recommendation to buy or sell any security. The securities, instruments, or strategies described may not be suitable for all investors, and their value and income may fluctuate. Past performance is not indicative of future results, and there is no guarantee that any investment strategy will achieve its objectives, generate profits, or avoid losses.
This material is intended to provide general market commentary and should not be relied upon as individualized investment advice. Investors should consult with their financial professional before making any investment decisions based on this information.
Data and analysis are provided “as is” without warranty of any kind, either express or implied. Day Hagan Asset Management, its affiliates, employees, or third-party data providers shall not be liable for any loss sustained by any person relying on this information. All opinions and views expressed are subject to change without notice and may differ from those of other investment professionals within Day Hagan Asset Management or Ashton Thomas Private Wealth, LLC.
Accounts managed by Day Hagan Asset Management or its affiliates may hold positions in the securities discussed and may trade such securities without notice.
Day Hagan Asset Management is a division of and doing business as (DBA) Ashton Thomas Private Wealth, LLC, an SEC-registered investment adviser. Registration with the SEC does not imply a certain level of skill or training.
There is no guarantee that any investment strategy will achieve its objectives, generate dividends, or avoid losses.
This material is for educational purposes only. Further distribution is prohibited without prior permission. Please see the information on Disclosures and Fact Sheets here: https://dhfunds.com/literature. Charts with models and return information use indices for performance testing to extend the model histories, and they should be considered hypothetical. All Rights Reserved. (© Copyright 2026 Day Hagan Asset Management.)
Definitions
Sector Composite Models — Day Hagan Sector Composite Models use quantitative, rules-based indicators to evaluate relative sector conditions across trend, momentum, valuation, breadth, macroeconomic, and sentiment inputs. The models are designed to support disciplined sector allocation decisions. Hypothetical and historical past performance is not indicative of future results. There can be no assurance that any investment or strategy will achieve its objectives, avoid substantial losses, or have comparable results. This information is provided for illustrative purposes only and is not a prediction, projection, or guarantee of future performance. Hypothetical results do not reflect actual trading, were derived using the benefit of hindsight, and may not reflect material economic and market events. Actual results vary and depend on many factors and are subject to risks and uncertainties.
S&P 500 — A stock market index tracking 500 of the largest publicly traded U.S. companies; commonly used as a benchmark for the overall U.S. equity market.
Dow Jones Industrial Average (DJIA) — A price-weighted stock index of 30 large U.S. companies, often used as a headline measure of the stock market.
Nasdaq Composite — A stock market index that includes thousands of stocks listed on the Nasdaq exchange, with heavy exposure to technology companies.
PMI (Purchasing Managers’ Index) — A survey-based economic indicator that measures business activity; readings above 50 generally indicate expansion, while readings below 50 indicate contraction.
ISM (Institute for Supply Management) Index — A widely followed U.S. manufacturing activity index based on purchasing manager surveys; used to gauge economic momentum.
CPI (Consumer Price Index) — A measure of inflation that tracks changes in the prices consumers pay for goods and services.
Medical CPI — A CPI subcategory that measures inflation specifically in medical care goods and services.
Federal Reserve (the Fed) — The central bank of the United States, responsible for setting monetary policy and influencing interest rates and financial conditions.
Benchmark weighting — The percentage weight a sector or asset has in a benchmark index, used as a reference point for portfolio positioning.
Overweight — A portfolio position above the benchmark weighting, reflecting a more favorable view of that sector or asset.
Underweight — A portfolio position below the benchmark weighting, reflecting a less favorable view of that sector or asset.
Neutral — A portfolio position roughly in line with the benchmark weighting, indicating no strong directional preference.
Sector rotation — A market dynamic in which investors shift money between sectors based on changing economic, interest-rate, or earnings expectations.
Relative strength — A measure of how a stock, sector, or asset performs compared with a benchmark or another asset.
Breadth — A technical measure showing how broadly market participation is spread, such as how many stocks in a sector are advancing or hitting new highs/lows.
RSI (Relative Strength Index) — A technical momentum indicator used to assess whether an asset may be overbought or oversold.
Yield curve — The relationship between yields on short- and long-term Treasury securities; changes in its shape can signal shifts in economic expectations.
10Y-2Y spread — The difference between the 10-year and 2-year U.S. Treasury yields, often used as a quick measure of the yield curve’s steepness.
WTI crude — West Texas Intermediate crude oil, a key U.S. benchmark price for oil.
REITs (Real Estate Investment Trusts) — Companies that own, operate, or finance income-producing real estate and typically trade like stocks.
Communication Services sector: The Communication Services Sector includes telecom and media & entertainment companies, including producers of interactive gaming products and companies engaged in content and information creation or distribution through proprietary platforms.
Consumer Discretionary sector: The Consumer Discretionary sector's manufacturing segment includes automobiles & components, household durable goods, leisure products, and textiles & apparel. The services segment includes hotels, restaurants, and other leisure facilities. It also includes distributors and retailers of consumer discretionary products.
Consumer Staples sector: The Consumer Staples sector includes manufacturers and distributors of food, beverages, and tobacco, as well as producers of non-durable household goods and personal products. It also includes distributors and retailers of consumer staples, including food & drug retailers.
Energy sector: The Energy sector includes companies that operate in the areas of exploration & production, refining & marketing, and storage & transportation of oil & gas and coal & consumable fuels. It also includes companies that offer oil & gas equipment and services.
Financials sector: The Financials sector includes banking, financial services, consumer finance, capital markets, and insurance activities. It also includes Financial Exchanges & Data and Mortgage REITs.
Fixed Income sector: The Fixed Income sector includes investment securities that pay investors fixed interest payments until the maturity date. Designed for income generation and capital preservation, this sector includes government, corporate, and municipal bonds, as well as certificates of deposit (CDs).
Health Care sector: The Health Care sector includes health care providers & services, health care equipment & supplies, and health care technology companies. It also includes companies involved in the research, development, production, and marketing of pharmaceuticals and biotechnology products.
Industrials sector: The Industrials sector includes aerospace & defense, building products, electrical equipment and machinery, and companies that offer construction & engineering services. It also includes providers of commercial & professional services including printing, environmental and facilities services, office services & supplies, security & alarm services, human resource & employment services, research & consulting services. It also includes companies that provide transportation services.
Information Technology sector: The Information Technology sector includes software and information technology services, manufacturers and distributors of technology hardware & equipment such as communications equipment, cellular phones, computers & peripherals, electronic equipment and related instruments, and semiconductors and related equipment & materials.
Materials sector: The Materials sector includes chemicals, construction materials, forest products, glass, paper and related packaging products, and metals, minerals and mining companies, including producers of steel.
Real Estate sector: The Real Estate sector includes companies engaged in real estate development and operation. It also includes companies offering real estate-related services and Equity Real Estate Investment Trusts (REITs).
© 2026 Day Hagan Asset Management