Day Hagan Tech Talk: March Madness: SI, SIVB, SBNY, and ?
A downloadable PDF copy of the Article:
Day Hagan Tech Talk: March Madness: SI, SIVB, SBNY, and ? (pdf)
Summary
During our recent technical analysis Chart Jamboree, we spent a lot of time addressing whether Wall Street is putting its head in the sand about the effects of quickly rising bond yields. Last week’s tape action and this weekend’s banking system news answered our question with a resounding “yes, it is.”
Bond Market Doesn’t Lie
As recently as September 2022 and as early as May 2022, we highlighted the chart in Figure 1, thanks to John Roque of 22V Research. We discussed something “breaking” and/or that “breaks.” Bank failures are proof positive that the bond market doesn’t lie and the Fed indeed “broke” something. Consequently, I ask: Should the Fed stop raising rates and halt QT—which we would view as an incremental positive—at their March 22 meeting? I don’t have any hints about if they will or not.
Figure 1: 10-Year U.S. Treasury Yield. | As Tavis McCourt of Raymond James stated, relevant to the header above, “this… highlight[s] that when rates are increased as fast as they have been in 40+ years, there are likely risks to business models that haven’t been stress-tested like this for 40+ years.” PLEASE add “Banking Crisis” to point 15 and keep this chart for future reference!me.
March Madness
While the brackets are filled out for the NCAA’s Division 1 Basketball tournament, March Madness, Wall Street experienced its own version of March Madness last week.
One way to view this “Madness” is by noting a big spike in New Lows across all capitalization sizes; please reach out for a chart. In terms of making money, an increase in New Lows produces a difficult backdrop and is a headwind during topside rallies.
A current near-term oversold condition exists (see top frame of Figure 3 and Figure 4) and there has been an increase in bearish sentiment (as a contrarian, secondary indicator, bearish sentiment can be supportive once the bearish sentiment trend reaches an extreme level and turns up). Consistent with all of this, a rally followed by a pullback that produces positive divergences (i.e., fewer New Lows during the next pullback) would help discern the equity market’s staying power or lack thereof.
Until then—barring positive divergences—an intermediate-term oversold condition or a successful retest of the rising 200-week MA (please reach out for a chart with the 200-week MA, currently at 3730), the odds favor that the selling pressure continues, for now.
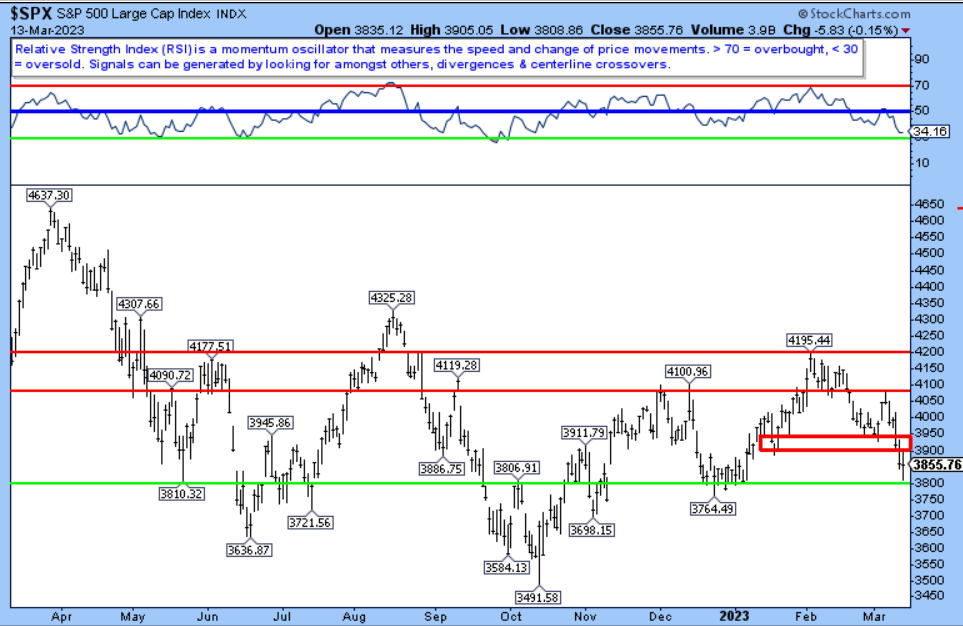
Figure 2: S&P 500 – Four-year chart. | Please note the new range/levels of support (green lines) following the break of 3950 to 3900 and the many levels of overhanging selling pressure (resistance—red lines).
Figure 3: S&P 500. | As difficult as the last month has been (madness for sure), and even with numerous levels of overhanging selling pressure, shown in red, the near-term chart configuration remains range-bound, or neutral. All the more reason to use a violation of resistance or support shown in Figures 2 through 4 accordingly.
“The banking sector is an important component of the Russell 2000 (RUT), and while the exact percentage can vary, banks generally make up around 18% of the index,” according to Tier 1 Alpha. Therefore, when the banking sector performs poorly, it can negatively impact the overall index, as investors may become concerned about the health of the economy and the potential for defaults or other financial issues. For example, the RUT was down over 8% last week while the DJIA, SPX, and NASDAQ were down -4.44%, -4.55%, and -4.71% respectively.
Figure 4: Small Cap proxy with resistance, support, and an oversold condition. | With the verbiage in the paragraph above as context, and a deeply oversold condition, please use the support and resistance levels accordingly.
Meanwhile
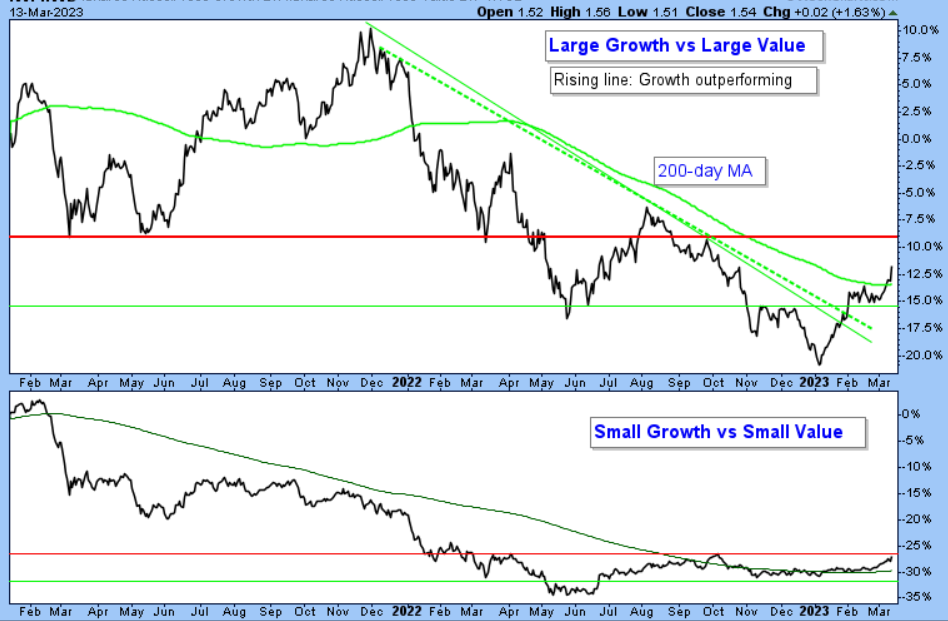
Figure 5: Growth vs. Value (non-growth) debate. | “Listen to what the market is saying about others, not what others are saying about the market.” ~Richard Wyckoff. In that regard, please reach out for further discussion and/or an updated chart as we move forward.
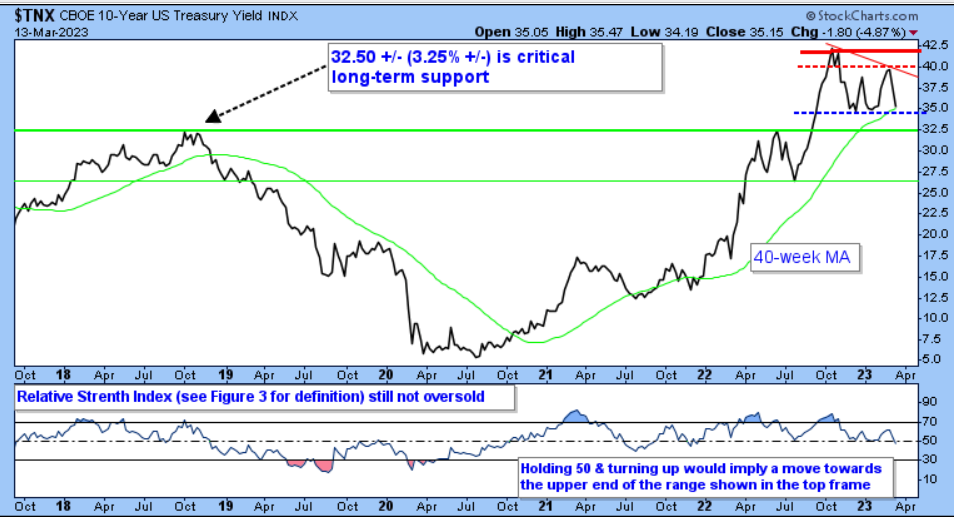
Figure 6: CBOE 10-Year U.S. Treasury Yield Index. | Another example of March Madness. Until a more definitive trend develops, a range-bound scenario exists. Please note resistance (red lines) and support (blue and green line).
The Day Hagan/Ned Davis Research Smart Sector strategies utilize measures of price, valuation, economic trends, monetary liquidity, and market sentiment to make objective, unemotional, rational decisions about how much capital to place at risk, as well as where to place that capital. Please reach out for specifics.
Day Hagan Asset Management appreciates being part of your business, either through our research efforts or investment strategies. Please let us know how we can further support you.
Art Huprich, CMT®
Chief Market Technician
Day Hagan Asset Management
—Written 03.13.2023. Chart and table source: Stockcharts.com unless otherwise noted.
Future Online Events
Disclosure: The data and analysis contained herein are provided “as is” and without warranty of any kind, either express or implied. Day Hagan Asset Management (DHAM), any of its affiliates or employees, or any third-party data provider, shall not have any liability for any loss sustained by anyone who has relied on the information contained in any Day Hagan Asset Management literature or marketing materials. All opinions expressed herein are subject to change without notice, and you should always obtain current information and perform due diligence before investing. DHAM accounts that DHAM or its affiliated companies manage, or their respective shareholders, directors, officers and/or employees, may have long or short positions in the securities discussed herein and may purchase or sell such securities without notice. The securities mentioned in this document may not be eligible for sale in some states or countries, nor be suitable for all types of investors; their value and income they produce may fluctuate and/or be adversely affected by exchange rates, interest rates or other factors.
Investment advisory services offered through Donald L. Hagan, LLC, a SEC registered investment advisory firm. Accounts held at Raymond James and Associates, Inc. (member NYSE, SIPC) and Charles Schwab & Co., Inc. (member FINRA, SIPC). Day Hagan Asset Management is a dba of Donald L. Hagan, LLC.


