Day Hagan Tech Talk: But Why?
A downloadable PDF copy of the Article:
Summary
Within the context of a supportive, internal, price-related backdrop, last week I twice suggested tightening up short-term (trading) stops or taking short-term (trading) profits in whole or in part. In today’s report, I expand on one reason why—beyond the SPX trading over 2.5 standard deviations above its 50-day MA, an overbought condition—I still suggest this near-term tactical move.
She Really Said That?
In this report, “animal spirits” is defined as the combination of the fear of missing out and a short squeeze of low-quality/high-beta stocks. The MEME and NYSE FANG+ indexes—up almost 38% and 29% respectively year-to-date as of February 3—indicate animal spirits have returned to Wall Street. Cathie Wood’s proclamation of a “reborn ARKK,” which she calls the “New NASDAQ,” reinforces the notion. Concerningly, if we compare the relative strength trend of the NASDAQ 100 (NDX) to the S&P 500 after the late-90s technology bubble burst, it took 20 years for the NASDAQ 100 to get back to the 2000 relative strength peak—Figure 1. Consequently, I’m not sure that I would want to invest in “the new NASDAQ” without a strict risk management strategy in place, first and foremost. You?
Figure 1: ARKK vs. SPX (top frame) & NASDAQ 100 vs. SPX (bottom frame). | My point isn’t to say that ARKK or any technology/growth/low-quality stock can’t rally. They can and likely will. My point here is that “animal spirits” were out in full force during the first 4-5 weeks of 2023, and, in the past, it has been prudent to lock in or hedge some if not all of these short-term gains.
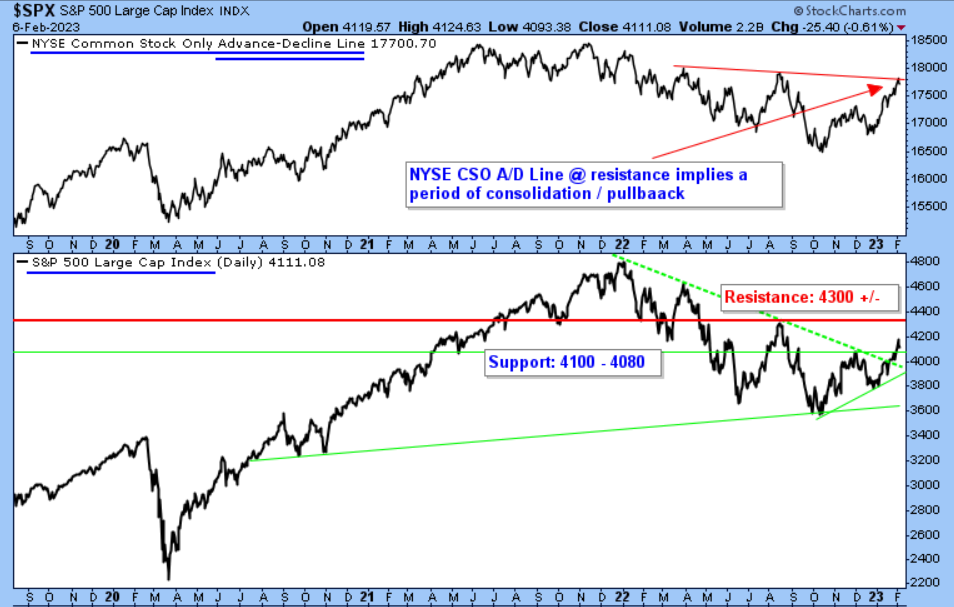
Resistance Lurking
Figure 2: S&P 500. | Initial support is between 4100 and 4080. A violation of this area implies a move down towards 4000-3900 yet still within a bullish trend of higher price troughs and price higher peaks. A decisive move above 4200 implies an upward extension towards 4300+/-, which I currently think ultimately occurs.
Side Note: Besides the resistance line shown in the NYSE CSO A/D Line above, the NYSE Composite and Value Line Index have also rallied to similar resistance lines. Both provide a broader representation of the domestic equity market than the SPX. Please reach out for a chart.
Meanwhile
With the strength of the U.S. Dollar Index (102.75—potential towards 105+) which predominately occurred after last Wednesday’s Fed announcement and last Friday’s employment report, commodity indices sold off hard. Last week, the GSCI Commodity Index declined 5.65%, the SPX outperformed Gold by over 5%, and the U.S. market outperformed many overseas markets. Please reach out for commodity charts of interest, especially Gold and Silver.
Figure 3: Crude Oil with falling 200-day MA (red dashed line). | The chart has depicted challenges and problems since the spring and summer of 2022. More recently, the relative strength trend of the Oil and Gas E&P, a proxy for the Energy sector, has been challenged. If Crude Oil can get decisively above $80-81, this might change. Until then, however, from a purely chart-based perspective, nothing yet suggests a period of significant outperformance.
The Day Hagan/Ned Davis Research Smart Sector strategies utilize measures of price, valuation, economic trends, monetary liquidity, and market sentiment to make objective, unemotional, rational decisions about how much capital to place at risk, as well as where to place that capital. Please reach out for specifics, and how we can support you in 2023.
Day Hagan Asset Management appreciates being part of your business, either through our research efforts or investment strategies. Please let us know how we can further support you.
Art Huprich, CMT®
Chief Market Technician
Day Hagan Asset Management
—Written 2.6.2023. Chart and table source: Stockcharts.com unless otherwise noted.
Future Online Events
Disclosure: The data and analysis contained herein are provided “as is” and without warranty of any kind, either express or implied. Day Hagan Asset Management (DHAM), any of its affiliates or employees, or any third-party data provider, shall not have any liability for any loss sustained by anyone who has relied on the information contained in any Day Hagan Asset Management literature or marketing materials. All opinions expressed herein are subject to change without notice, and you should always obtain current information and perform due diligence before investing. DHAM accounts that DHAM or its affiliated companies manage, or their respective shareholders, directors, officers and/or employees, may have long or short positions in the securities discussed herein and may purchase or sell such securities without notice. The securities mentioned in this document may not be eligible for sale in some states or countries, nor be suitable for all types of investors; their value and income they produce may fluctuate and/or be adversely affected by exchange rates, interest rates or other factors.
Investment advisory services offered through Donald L. Hagan, LLC, a SEC registered investment advisory firm. Accounts held at Raymond James and Associates, Inc. (member NYSE, SIPC) and Charles Schwab & Co., Inc. (member FINRA, SIPC). Day Hagan Asset Management is a dba of Donald L. Hagan, LLC.

