
A downloadable PDF copy of the Article:
Day Hagan Smart Sector® with Catastrophic Stop Strategy Update November 2026 (pdf)
Executive Summary
We enter November overweight Information Technology, Industrials, and Utilities. These allocations emphasize businesses supplying computing capacity, equipment, and electricity, where our indicators offer stronger support. Financials, Materials, and Real Estate move to underweight. Health Care rises to neutral, while Energy remains neutral. Consumer Discretionary, Consumer Staples, and Communication Services remain underweight.
The economy continues to support increasing corporate sales, but the benefits are uneven. Real GDP expanded at a 3.4% annualized rate in the third quarter, up from 2.2% in the second quarter, with investment contributing to the acceleration. October’s preliminary Composite PMI remained strong at 57.6, although businesses continued to report cost pressures. The Federal Reserve held its policy range at 3.75%–4.00% on October 28. That pause provides time to evaluate incoming information, but inflation remains a constraint.
Households face a less comfortable picture. September spending increased 0.5% in current dollars, but inflation absorbed almost all of that gain. Real disposable income declined 0.3%, and the saving rate was 3.8%. Headline PCE inflation reached 3.6% year over year, with core inflation at 3.1%. These figures help explain our preference for business investment over a broad increase in consumer exposure.
Corporate earnings remain supportive. FactSet’s October 30 update showed blended third-quarter S&P 500 earnings growth of 30.2%, with 60% of companies reporting. However, aggregate earnings exceeded estimates by only 1.9%, compared with a five-year average of 7.5%. Companies can deliver substantial growth and still disappoint investors who expected more. We therefore evaluate earnings alongside valuation, market participation, price trends, and economic conditions.
The AI investment cycle illustrates this distinction. Microsoft reported strong cloud growth, while Meta’s expanding advertising business was accompanied by enormous capital spending and negative quarterly free cash flow. Demand is evident. The timing and distribution of shareholder returns are less certain. Our positioning recognizes opportunities among technology providers, industrial suppliers, and electricity companies while maintaining an underweight in Communication Services.
Risk management remains central. In the October 26 update, the Catastrophic Stop Model stood at 45.45%, above its sell threshold but with a narrower margin of support. A reading below 40% for two consecutive days calls for reduced equity exposure under the strategy’s rules. We will follow that discipline as conditions evolve.
Holdings
Sector
Consumer Discretionary
Consumer Staples
Communication Services
Energy
Financials
Health Care
Industrials
Information Technology
Materials
Real Estate
Utilities
Outlook (relative to benchmark weighting)
Underweight
Underweight
Underweight
Neutral
Underweight
Neutral
Overweight
Overweight
Underweight
Underweight
Overweight
Consumer Discretionary - Underweight
Consumer Discretionary remains underweight. Relative trends have improved, but the household backdrop and participation measures do not yet support a larger allocation. Better price momentum is encouraging. We also want evidence that consumers’ purchasing power and the sector’s underlying participation are improving.
The favorable indicators include both moving-average crossover measures, deviation from trend, relative momentum, and relative forward valuation. The unfavorable evidence includes the overbought/oversold measure, net new highs, consumer credit, housing starts, and the long-term Treasury yield relationship. The discretionary spending indicator is neutral.
September’s inflation-adjusted consumer spending was essentially flat, while real disposable income declined. October’s Conference Board confidence index recovered to 91.7, but its expectations measure remained subdued at 72.6. Consumers may feel better about business conditions while still facing difficult spending decisions.
The selected chart shows smoothed net new highs slightly below zero. Improving sector momentum has not been matched by broad leadership across its constituents. We would look for stronger participation and a healthier income backdrop before increasing exposure. The underweight preserves participation while directing more active exposure toward sectors with stronger supporting evidence.
Figure 1: Net new highs remain negative despite better relative momentum.
Consumer Staples - Underweight
Consumer Staples remains underweight. Essential products can stabilize revenue, but stable demand alone does not establish an attractive investment. Our indicators show improving participation alongside less favorable sales, inflation, and valuation relationships.
The moving-average signal, overbought/oversold measure, relative new highs, 45-day breadth, and financial-conditions indicator are bullish. Relative momentum and deviation from trend remain bearish, as do food sales, food inflation, relative short interest, sales yield, and global economic surprises. Technical improvement is visible, but the broader evidence remains mixed.
The selected chart highlights the weak food-sales relationship. Its 12-month growth measure remains below its long-term average. This does not describe every Staples company. Businesses with strong brands and efficient distribution can gain share, while others may need promotions to sustain volumes.
With inflation limiting household purchasing power, we are watching unit demand, margins, and the ability to generate cash without relying indefinitely on price increases. We retain the underweight until improving participation is accompanied by stronger operating evidence. Defensive demand remains useful, but we want greater confidence that it will translate into attractive shareholder returns.
Figure 2: Food-sales growth remains below its long-term average.
Communication Services - Underweight
Communication Services remains underweight. The sector contains highly profitable digital platforms, but relative trend and valuation signals continue to argue for restraint. Rapid revenue growth does not remove the need to evaluate what that growth costs.
One overbought/oversold measure is bullish. The moving-average crossover, the second overbought/oversold measure, deviation from trend, and relative earnings yield are bearish. The yield-curve relationship is neutral. The selected chart shows the shorter relative-price average below the longer average, indicating that sustained relative leadership has not been established.
Meta illustrates the operating trade-off. Third-quarter revenue increased 26% to $64.6 billion, with both advertising impressions and pricing contributing. Capital expenditures, including finance-lease principal payments, reached $34.91 billion, and free cash flow was negative $2.12 billion. A substantial legal charge also reduced reported operating profit, so the entire margin decline should not be attributed to AI spending.
These results support continued interest in digital advertising and AI monetization, while raising the hurdle for additional exposure. We would look for firmer relative trends and evidence that investment is translating into sustainable cash generation. The underweight reflects spending demands and market signals, even as important businesses within the sector continue to grow.
Figure 3: The relative-price crossover remains bearish.
Energy - Neutral
Energy remains neutral. Favorable indicators support retaining exposure, while commodity volatility argues against making the portfolio more dependent on another rise in oil prices.
Relative strength, the overbought/oversold measure, breadth, the moving-average crossover, free-cash-flow yield momentum, rig activity, oil inventories, and the crude spot-price relationship are bullish. Rolling volatility, the crude-price band model, and the dollar relationship are bearish. Strength in energy equities therefore coexists with caution in several commodity-sensitive inputs.
The selected chart shows smoothed 150-day breadth above its 50% threshold. Participation provides support beyond the fortunes of one or two large producers. It does not eliminate the possibility that changing oil supply or demand could reverse sector profits.
The EIA’s October outlook raised its fourth-quarter Brent forecast to $105 a barrel, reflecting constrained Middle East flows and tight diesel markets. That forecast used information through October 1 and should not be confused with an October 30 spot price. The same outlook anticipated lower prices in 2027.
Neutral exposure balances favorable operating conditions with the risk that improved supply reduces the commodity premium. We retain participation without requiring another oil-price increase to justify an overweight.
Figure 4: Broad participation supports maintaining Energy exposure.
Financials - Underweight
Financials moves from overweight to underweight. Loan growth and valuation remain constructive, but volatility, credit, and yield-curve signals argue against maintaining the larger allocation shown in the October letter.
The overbought/oversold measure, total-return trend, dollar relationship, bank loan growth, and forward earnings yield are bullish. Sector volatility, maximum relative drawdown, global economic surprises, financial-institution credit spreads, and the yield-curve relationship are bearish. Relative trend, relative momentum, and business credit conditions are neutral. The evidence is mixed rather than uniformly negative.
The selected chart explains one reason for the reduction. Short-term smoothed relative volatility exceeds its longer-term counterpart. This measures instability in the sector’s relative performance. It is not a direct estimate of bank losses or a prediction of financial-system stress.
The Fed’s October pause leaves banks, insurers, and asset managers operating with meaningful financing costs. Higher rates can improve reinvestment income, but they can also increase deposit competition, pressure borrowers, and reduce the value of existing securities. We want better credit and relative-price confirmation before restoring an overweight. Attractive earnings yields remain useful, but they do not outweigh the current risk signals on their own.
Figure 5: Higher short-term relative volatility supports a more cautious allocation.
Health Care - Neutral
Health Care rises from underweight to neutral as market confirmation improves. The change recognizes stronger participation and relative trends while retaining caution about costs, spending relationships, and valuation.
All six market-based measures are bullish: relative trend, relative momentum, momentum reversals, 100-day relative breadth, sector trend, and maximum relative drawdown. Health care construction is neutral. Medical inflation, personal health care expenditure, and book yield remain bearish. The recovery is better established in price behavior than across the full set of fundamental indicators.
The selected chart shows broad relative participation, with the smoothed share of stocks whose relative strength exceeds its 100-day average near 80%. That suggests the improvement extends beyond an isolated company. The indicator follows reversal rules, so its level alone should not be interpreted as an automatic buy or sell instruction.
Neutral is an appropriate response to the improvement. Drug developers, medical-device companies, providers, and insurers face different reimbursement, utilization, and product-cycle risks. We would require broader fundamental confirmation before increasing the sector above its benchmark weight. Stronger technical evidence supports removing the underweight without assuming that every part of Health Care has the same earnings outlook.
Figure 6: Improved relative breadth supports the move to neutral.
Industrials - Overweight
Industrials moves from underweight to overweight as the model provides broader support for business-investment exposure. The change is consistent with an economy in which investment is contributing to growth, even as household purchasing power faces pressure.
Relative trend, volatility, RSI, new lows, cash-flow yield, industrial commodities, the dollar relationship, and industrial production are bullish. Both relative-momentum measures remain bearish, along with sales yield and the oil relationship. Consumer confidence is neutral. We are increasing exposure with improved confirmation, while recognizing that shorter-term momentum has not fully followed.
Caterpillar’s October 29 results provide a concrete example of stronger activity translating into profits. Third-quarter sales rose 17% to $20.7 billion, supported by higher volume and pricing. Its operating margin increased to 20.4% from 17.3%. One company does not represent the entire sector, but the report adds operating evidence to the investment theme.
The selected chart’s cash-flow yield signal is bullish. Demand for equipment, electrical infrastructure, and industrial capacity must ultimately produce cash for shareholders. The overweight seeks that combination of activity and cash generation. We would reassess if weaker momentum broadened or higher input and financing costs began eroding the earnings case.
Figure 7: The cash-flow yield signal supports greater Industrials exposure.
Information Technology - Overweight
Information Technology remains overweight. Six of seven indicators are bullish, including relative momentum, one overbought/oversold measure, sales yield, inflation expectations, relative short interest, and earnings-revision breadth. The other overbought/oversold measure is bearish. Technology continues to offer one of the portfolio’s clearest combinations of market and fundamental support.
Microsoft’s October report reinforces the demand side of the case. Azure revenue grew 48%, and Microsoft Cloud revenue increased 30% to $63.9 billion. These results demonstrate substantial cloud activity, although they do not establish that every AI project or supplier will earn an adequate return.
The selected earnings-revision indicator remains bullish. Its long smoothing period makes it a measure of persistent conditions rather than an immediate verdict on this earnings season. We evaluate it alongside the other indicators, rather than assuming that every company’s estimates are improving at the same pace.
The next test is cash generation after investment. Capacity spending creates opportunities for chips, networking, software, and services, but also exposes customers to depreciation, utilization, and financing risks. Our overweight rests on the current evidence. Sustained deterioration in revisions or relative momentum would weaken that case. A volatile trading session alone does not establish that demand has disappeared.
Figure 8: The earnings-revision indicator remains bullish alongside strong cloud demand.
Materials – Underweight
Materials moves from a modest overweight to underweight. Several shorter-term and operating indicators remain favorable, but the sector’s principal relative-trend measures have not confirmed a durable recovery. We are reducing exposure to that mismatch.
Relative momentum, overbought/oversold conditions, deviation from trend, volatility, gold momentum, sales yield, and materials production are bullish. The moving-average crossover and relative trend are bearish, along with emerging-versus-developed-market momentum, silver, natural gas, and earnings yield. Copper momentum is neutral. A simple count of favorable indicators would miss the conflicting evidence across different horizons.
The selected crossover chart remains bearish. Its signal uses a specified percentage band, so a small change in the latest averages is not enough to establish a new signal. We want improvement in shorter-term measures to become a more durable relative advance.
Industrial investment can support metals and construction inputs, but Materials also includes chemicals, packaging, and businesses with very different energy costs and supply conditions. Attractive demand themes do not assure pricing power across the sector. The underweight preserves exposure while we look for better trend confirmation and a more consistent combination of commodity, valuation, and economic signals.
Figure 9: Broader relative trends have not confirmed the shorter-term improvement.
Real Estate - Underweight
Real Estate moves from neutral to underweight. Several indicators are favorable, but short-term price behavior, homebuilding, and small-business credit conditions remain obstacles. A recovery in selected property types does not necessarily indicate a broad improvement in financing conditions.
Relative trend, 50-day breadth, unemployment, the long-term Treasury yield relationship, construction-supply production, and economic surprises are bullish. The share of positive trading days, deviation from trend, homebuilding, and small-business credit are bearish. A bullish yield indicator reflects a model relationship and should not be interpreted as evidence that property financing has become inexpensive.
The selected credit-conditions chart retains its bearish signal under the model’s threshold rules. Small-business credit is an indirect indicator for listed property companies, but it helps frame the financing constraint. An occupied building can still disappoint investors if debt service and refinancing absorb too much rental income.
Data centers offer investment opportunities, while offices, apartments, warehouses, and retail properties face different supply and tenant conditions. We would look for improving financing signals and stronger price confirmation before increasing the allocation. The underweight reflects the overall portfolio outlook despite several constructive individual indicators.
Figure 10: The credit-conditions indicator remains bearish despite other improving inputs.
Utilities - Overweight
Utilities rises from neutral to overweight as relative-price evidence strengthens. The allocation adds exposure to electricity and grid investment, while recognizing that the financial benefit depends on how projects are funded and when customers begin paying for additional capacity.
The moving-average crossover, price reversals, momentum, both overbought/oversold measures, deviation from trend, capacity utilization, and dividend yield are bullish. Breadth, oil, the earnings-yield spread to Treasuries, and manufacturing PMI remain bearish. The copper-to-gold relationship is neutral. Price confirmation has improved, but participation and competition from bonds still warrant attention.
The selected chart shows relative price sufficiently above its 50-day smoothing to support a bullish signal. This provides a direct market basis for the higher allocation. It does not imply that all utilities have the same exposure to data-center demand or the same ability to recover construction costs.
Electricity is a practical requirement for the AI buildout. Shareholder returns still depend on customer commitments, regulatory treatment, construction discipline, and financing. We maintain the overweight while monitoring these constraints and the bearish breadth reading. Broader participation would strengthen the case. Reversing relative trends or deteriorating financing economics would warrant renewed caution.
Figure 11: The bullish relative-price crossover supports the Utilities overweight.
Catastrophic Stop Update
The Catastrophic Stop Model stood at 54.55% at the end of October. At that reading, the model continued to support equity exposure. The margin above the sell threshold had narrowed, however, warranting close attention to further deterioration.
Three factors weakened over the month: the Baltic Dry Index, the Russell 3000 supply-and-demand measure, and equity breadth. Excessive pessimism provided a contrarian offset. Sentiment can help create conditions for a recovery, but stronger buying demand and wider participation would provide more convincing confirmation.
A reading below 40% for two consecutive days triggers reduced equity exposure and higher cash under the strategy’s discipline. The model reading is not a probability of market gains and does not guarantee protection against losses.
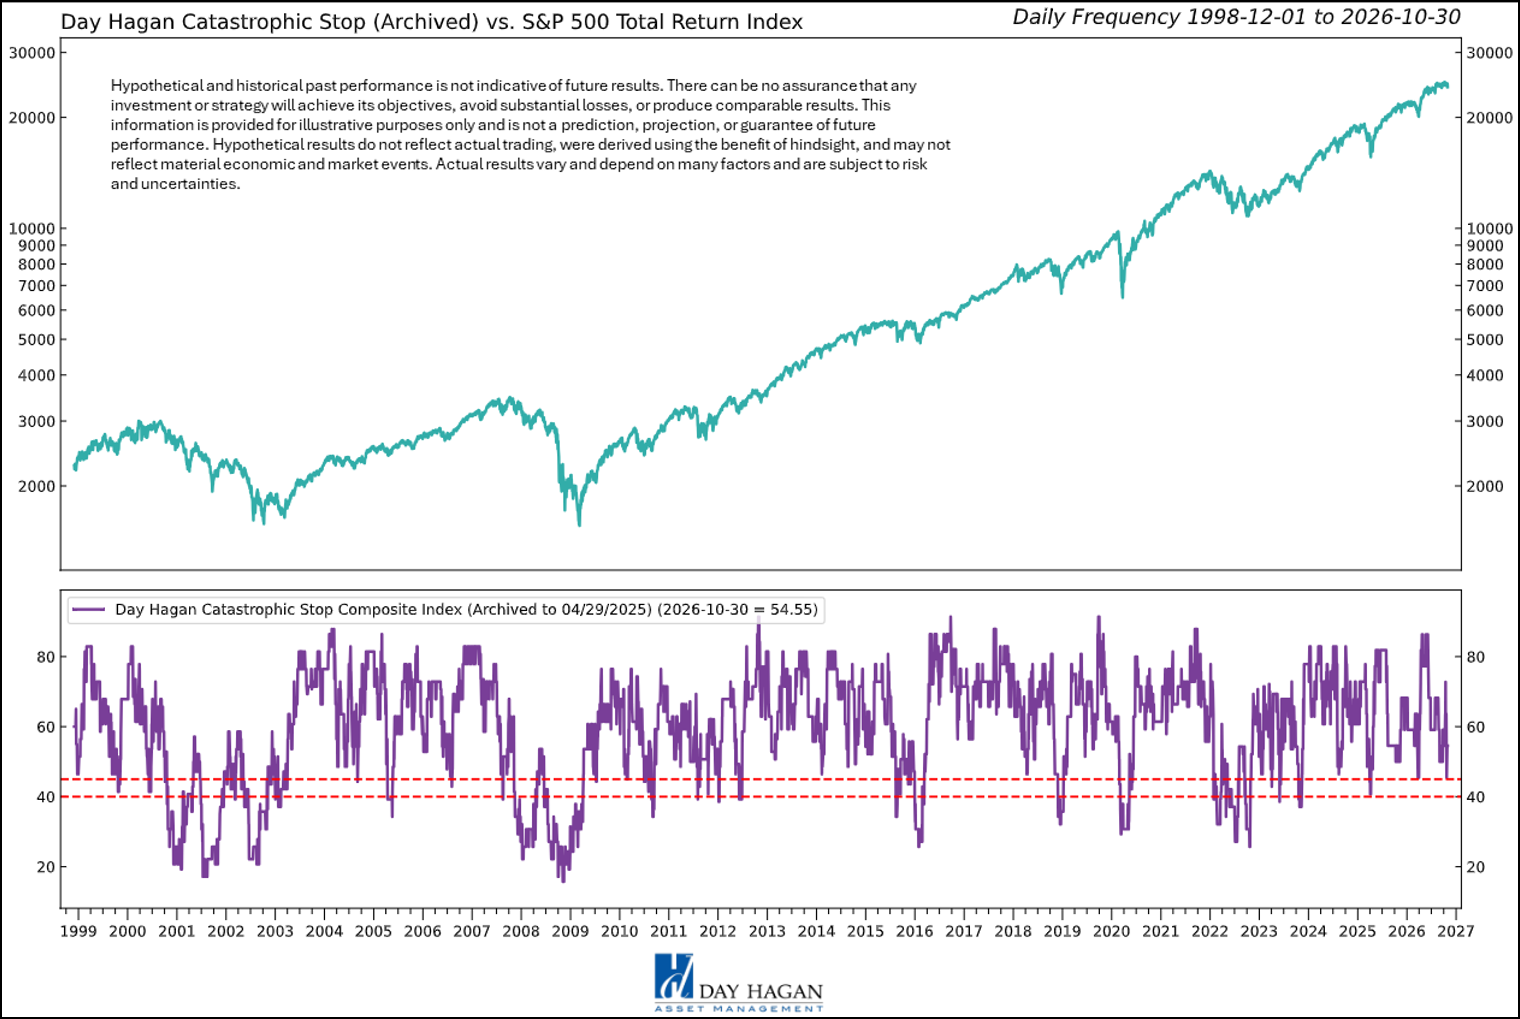
Figure 12: The Catastrophic Stop model recommends a fully invested position relative to the benchmark. Because the model uses indices to extend its history, the historical illustration is considered hypothetical.
Hypothetical and historical past performance is not indicative of future results. There can be no assurance that any investment or strategy will achieve its objectives or avoid substantial losses or have comparable results. This information is provided for illustrative purposes only and is not a prediction, projection, or guarantee of future performance. Hypothetical results do not reflect actual trading, were derived using the benefit of hindsight, and may not reflect material economic and market events. Actual results vary and depend on many factors and subject to risk and uncertainties.
Conclusion
We enter November emphasizing Technology, Industrials, and Utilities, with neutral allocations to Energy and Health Care. These positions recognize ongoing business investment and improving sector evidence while limiting exposure where financing, household purchasing power, or relative trends are less favorable.
The next decisions will depend on earnings revisions, cash generation, market participation, and financing costs. Inflation remains an important constraint even after the Fed’s pause. November’s midterm elections may alter policy priorities, but portfolio changes will depend on their measurable effects and the model evidence.
Our objective is to participate when conditions support taking equity risk and reduce exposure when the Catastrophic Stop rules call for defense. Sector allocation and market-level risk management serve different purposes. We will continue to use both.
Historical chart statistics are hypothetical and do not represent strategy or client returns. Individual indicators should not be used as the sole basis for an investment decision. Economic statistics may be revised, earnings estimates may change, and company examples illustrate sector conditions rather than recommendations to buy or sell individual securities.
The strategy uses price, valuation, economic, liquidity, and sentiment measures to guide allocation. Company references illustrate sector conditions and are not recommendations.
Day Hagan Asset Management
1000 S. Tamiami Trl
Sarasota, FL 34236
Toll Free: (800) 594-7930
Office Phone: (941) 330-1702
Website: https://dayhagan.com or https://dhfunds.com
This material is for educational purposes only. Further distribution is prohibited without prior permission. Please see the information on Disclosures and Fact Sheets here: https://dhfunds.com/literature. Charts with models and return information use indices for performance testing to extend the model histories, and they should be considered hypothetical. All Rights Reserved. (© Copyright 2026 Day Hagan Asset Management.)
Day HaganSmart Sector®
With Catastrophic Stop ETF
Symbol: SSUS
Disclosures
The data and analysis contained within are provided “as is” and without warranty of any kind, either express or implied. The information is based on data believed to be reliable, but it is not guaranteed. Day Hagan DISCLAIMS ANY AND ALL EXPRESS OR IMPLIED WARRANTIES, INCLUDING, BUT NOT LIMITED TO, ANY WARRANTIES OF MERCHANTABILITY, SUITABILITY, OR FITNESS FOR A PARTICULAR PURPOSE OR USE. All performance measures do not reflect tax consequences, execution, commissions, and other trading costs, and as such, investors should consult their tax advisors before making investment decisions, as well as realize that the past performance and results of the model are not a guarantee of future results. The Smart Sector® Strategy is not intended to be the primary basis for investment decisions, and the usage of the model does not address the suitability of any particular investment for any particular investor.
Using any graph, chart, formula, model, or other device to assist in deciding which securities to trade or when to trade them presents many difficulties, and their effectiveness has significant limitations, including that prior patterns may not repeat themselves continuously or on any particular occasion. In addition, market participants using such devices can impact the market in a way that changes the effectiveness of such devices. Day Hagan believes no individual graph, chart, formula, model, or other device should be used as the sole basis for any investment decision and suggests that all market participants consider differing viewpoints and use a weight-of-the-evidence approach that fits their investment needs.
Past performance does not guarantee future results. No current or prospective client should assume future performance of any specific investment or strategy will be profitable or equal to past performance levels. All investment strategies have the potential for profit or loss. Changes in investment strategies, contributions or withdrawals, and economic conditions may materially alter the performance of your portfolio. Different types of investments involve varying degrees of risk, and there can be no assurance that any specific investment or strategy will be suitable or profitable for a client’s portfolio. Historical performance results for investment indexes and/or categories generally do not reflect the deduction of transaction and/or custodial charges or the deduction of an investment management fee, the incurrence of which would have the effect of decreasing historical performance results. There can be no assurances that a portfolio will match or outperform any particular benchmark. Comparisons to indices are inherently unreliable indicators of future performance. The strategies used to generate the performance vary from those used to generate the returns depicted in the benchmarks. Investors cannot directly invest in an index.
The information contained herein is provided for informational purposes only and should not be construed as investment advice or a recommendation to buy or sell any security. The securities, instruments, or strategies described may not be suitable for all investors, and their value and income may fluctuate. Past performance is not indicative of future results, and there is no guarantee that any investment strategy will achieve its objectives, generate profits, or avoid losses.
This material is intended to provide general market commentary and should not be relied upon as individualized investment advice. Investors should consult with their financial professional before making any investment decisions based on this information.
Data and analysis are provided “as is” without warranty of any kind, either express or implied. Day Hagan Asset Management, its affiliates, employees, or third-party data providers shall not be liable for any loss sustained by any person relying on this information. All opinions and views expressed are subject to change without notice and may differ from those of other investment professionals within Day Hagan Asset Management or Ashton Thomas Private Wealth, LLC.
Accounts managed by Day Hagan Asset Management or its affiliates may hold positions in the securities discussed and may trade such securities without notice.
Day Hagan Asset Management is a division of and doing business as (DBA) Ashton Thomas Private Wealth, LLC, an SEC-registered investment adviser. Registration with the SEC does not imply a certain level of skill or training.
There is no guarantee that any investment strategy will achieve its objectives, generate dividends, or avoid losses.
This material is for educational purposes only. Further distribution is prohibited without prior permission. Please see the information on Disclosures and Fact Sheets here: https://dhfunds.com/literature. Charts with models and return information use indices for performance testing to extend the model histories, and they should be considered hypothetical. All Rights Reserved. (© Copyright 2026 Day Hagan Asset Management.)
Sources:
BEA: Third-quarter GDP and September income and spending. U.S. Bureau of Economic Analysis (BEA)
Federal Reserve: October 28 statement. Federal Reserve issues FOMC statement
FactSet: October 30 earnings update. insight.factset.com
Trading Economics/S&P Global: U.S. Composite PMI. tradingeconomics.com
The Conference Board: October consumer confidence. conference-board.org
Company releases: Microsoft, Meta, and Caterpillar. Source
EIA: October Short-Term Energy Outlook. U.S. Energy Information Administration (EIA)
Day Hagan: October 26 Catastrophic Stop update. Portfolio outlooks and sector indicator readings were supplied by Day Hagan for the October allocation.
Definitions
Sector Composite Models — Day Hagan Sector Composite Models use quantitative, rules-based indicators to evaluate relative sector conditions across trend, momentum, valuation, breadth, macroeconomic, and sentiment inputs. The models are designed to support disciplined sector allocation decisions. Hypothetical and historical past performance is not indicative of future results. There can be no assurance that any investment or strategy will achieve its objectives, avoid substantial losses, or have comparable results. This information is provided for illustrative purposes only and is not a prediction, projection, or guarantee of future performance. Hypothetical results do not reflect actual trading, were derived using the benefit of hindsight, and may not reflect material economic and market events. Actual results vary and depend on many factors and are subject to risks and uncertainties.
S&P 500 — A stock market index tracking 500 of the largest publicly traded U.S. companies; commonly used as a benchmark for the overall U.S. equity market.
Dow Jones Industrial Average (DJIA) — A price-weighted stock index of 30 large U.S. companies, often used as a headline measure of the stock market.
Nasdaq Composite — A stock market index that includes thousands of stocks listed on the Nasdaq exchange, with heavy exposure to technology companies.
PMI (Purchasing Managers’ Index) — A survey-based economic indicator that measures business activity; readings above 50 generally indicate expansion, while readings below 50 indicate contraction.
ISM (Institute for Supply Management) Index — A widely followed U.S. manufacturing activity index based on purchasing manager surveys; used to gauge economic momentum.
CPI (Consumer Price Index) — A measure of inflation that tracks changes in the prices consumers pay for goods and services.
Medical CPI — A CPI subcategory that measures inflation specifically in medical care goods and services.
Federal Reserve (the Fed) — The central bank of the United States, responsible for setting monetary policy and influencing interest rates and financial conditions.
Benchmark weighting — The percentage weight a sector or asset has in a benchmark index, used as a reference point for portfolio positioning.
Overweight — A portfolio position above the benchmark weighting, reflecting a more favorable view of that sector or asset.
Underweight — A portfolio position below the benchmark weighting, reflecting a less favorable view of that sector or asset.
Neutral — A portfolio position roughly in line with the benchmark weighting, indicating no strong directional preference.
Sector rotation — A market dynamic in which investors shift money between sectors based on changing economic, interest-rate, or earnings expectations.
Relative strength — A measure of how a stock, sector, or asset performs compared with a benchmark or another asset.
Breadth — A technical measure showing how broadly market participation is spread, such as how many stocks in a sector are advancing or hitting new highs/lows.
RSI (Relative Strength Index) — A technical momentum indicator used to assess whether an asset may be overbought or oversold.
Yield curve — The relationship between yields on short- and long-term Treasury securities; changes in its shape can signal shifts in economic expectations.
10Y-2Y spread — The difference between the 10-year and 2-year U.S. Treasury yields, often used as a quick measure of the yield curve’s steepness.
WTI crude — West Texas Intermediate crude oil, a key U.S. benchmark price for oil.
REITs (Real Estate Investment Trusts) — Companies that own, operate, or finance income-producing real estate and typically trade like stocks.
© 2026 Day Hagan Asset Management