
A downloadable PDF copy of the Article:
Day Hagan Smart Sector® Fixed Income Strategy Update November 2026 (pdf)
Summary
We enter November with a more selective approach to credit. Mortgage-backed securities move from underweight to overweight, while high yield and emerging-market bonds move from overweight to underweight. U.S. investment-grade corporates remain underweight. Treasuries across the maturity spectrum, short-term TIPS, floating-rate securities, and international investment-grade corporates remain neutral. The largest change is a shift toward mortgages as their relative trends improve and several risk-sensitive credit signals weaken.
The Federal Reserve held its policy range at 3.75%–4.00% on October 28. Two officials preferred a quarter-point increase, underscoring that the pause does not settle the inflation debate. Third-quarter real GDP grew at a 3.4% annualized rate, up from 2.2% in the second quarter. That expansion supports borrower revenues, but it also reduces the urgency for easier policy.
Inflation continues to complicate the bond outlook. September PCE inflation reached 3.6% year over year, with core inflation at 3.1%. Real consumer spending barely increased, real disposable income fell 0.3%, and the saving rate was 3.8%. Businesses can report higher sales in dollars while households buy little more in real terms. For credit investors, the next test is whether revenues translate into cash available for interest payments and debt repayment.
Treasury yields offer meaningful income, but income and price protection are different things. On October 30, the two-year yield was 4.56%, the ten-year was 4.94%, and the thirty-year was 5.31%. The ten-year exceeded the two-year by 38 basis points. A positively sloped curve provides additional yield for extending maturity, while also exposing investors to larger price swings if long-term rates rise.
Credit markets are sending a more nuanced message than a simple risk-on or risk-off label suggests. Investment-grade and high-yield spreads narrowed from October 23 through October 29, but both widened on October 29. Our high-yield model still has more bearish than bullish inputs. We are reducing the allocation without assuming that a broad default cycle has begun. Mortgage trend confirmation is stronger, making that sector the preferred active overweight.
Rates, Credit, and Borrower Cash Flows
Bond returns come from several sources: income, changes in government yields, changes in credit spreads, and, where applicable, currency movements and embedded options. A strong coupon can cushion volatility. It cannot guarantee a positive total return when yields or spreads rise.
The latest spread readings help separate compensation for interest-rate exposure from compensation for corporate risk. On October 29, the ICE BofA U.S. Corporate Index option-adjusted spread was 0.89%, or 89 basis points. The comparable high-yield spread was 3.26%, or 326 basis points. These were down from 91 and 338 basis points on October 23, respectively, but up from 86 and 314 the previous day. That is partial improvement, with a late setback, rather than an uninterrupted recovery. These spreads are not all-in yields or forecasts of default losses.
At the issuer level, we are watching interest coverage, liquidity, debt maturities, and free cash flow after capital spending. Fixed-rate debt can delay the effect of higher borrowing costs until refinancing. Floating-rate debt passes higher reference rates through more quickly. Capital investment can build future earning power while consuming cash today. Bondholders need repayment capacity through that spending cycle, even when the equity growth story is compelling.
Energy costs can also divide borrowers. An exporter may benefit from higher commodity revenue while a transport company or energy-intensive manufacturer faces margin pressure. The ECB highlighted rising energy prices and the risk of higher inflation alongside weaker growth in its October 29 decision. That combination can challenge nominal duration and credit at the same time. We therefore avoid treating a slowing economy as an automatic reason to add every type of bond.
Our allocation changes follow the sector evidence. The macroeconomic backdrop provides context and identifies risks to monitor. It is not a substitute for the models, and a count of bullish indicators is not an allocation formula. The U.S. Aggregate and Global Aggregate models also cover broader markets than their corresponding corporate sleeves. Their signals inform those discussions without establishing corporate-only recommendations.
Holdings
Fixed Income Sector
US 1-3 Month T-bill
US 3-7 Year Treasury
US 10-20 Year Treasury
TIPS (short-term)
US Mortgage-Backed
US Floating Rate
US Corporate
US High Yield
International Corporate Bond
Emerging Market Bond
Outlook (relative to benchmark)
Neutral
Neutral
Neutral
Neutral
Overweight
Neutral
Underweight
Underweight
Neutral
Underweight
Position Details
U.S. TREASURIES — NEUTRAL
We retain neutral exposure to short, intermediate, and long Treasuries. The long-Treasury model has improved since October: technical momentum is now bullish alongside the credit-default-swap relationship. The technical cross and inflation-expectations inputs remain bearish, while the equity-market-trend input is neutral. This is a more balanced picture, but it is not a broad endorsement of long duration.
The chart below shows the 25-day relative-strength average below the 100-day average. A bullish momentum signal can occur before a trend crossover, particularly when it measures recovery from an extreme. We acknowledge the improvement while waiting for stronger confirmation that long Treasuries are regaining sustained leadership.
The October 30 yield curve offers different trade-offs by maturity. Short Treasuries limit price sensitivity and preserve flexibility. Intermediate bonds balance reinvestment risk and duration. Long bonds offer the greatest potential price response if yields fall, but the thirty-year yield of 5.31% does not remove their exposure to inflation uncertainty and changes in the premium investors demand for committing capital for decades.
A growth disappointment could support government bonds even as it hurts corporate credit. A renewed inflation shock could have the opposite effect on nominal duration. Neutral allocations keep both possibilities in view.
Figure 1. The relative trend remains bearish despite improving momentum.
U.S. TIPS — NEUTRAL
Short-term TIPS remain neutral. Commodity trends, momentum mean reversion, the high-yield-spread relationship, and inflation expectations are bullish. Technical RSI and the moving-average cross are bearish. Compared with October, the RSI reading has weakened, leaving a constructive inflation backdrop without complete price confirmation.
The selected commodity chart shows its shorter smoothing above its longer smoothing. This supports the model’s inflation-sensitive relationship, but commodity prices are only one part of consumer inflation. September’s 3.6% headline PCE inflation and 3.1% core reading illustrate why inflation protection remains relevant. TIPS principal adjusts with CPI, rather than PCE.
Real yields matter as much as the inflation adjustment. On October 30, Treasury’s five-year real par yield was 2.25% and its ten-year real yield was 2.60%. Comparing those with same-maturity nominal par yields produces approximate inflation-compensation gaps of 2.46 and 2.34 percentage points. These simple differences are not forecasts or pure measures of expected inflation. Liquidity, risk premiums, and differences between the curves also matter.
The neutral allocation preserves inflation protection while limiting reliance on a further rise in inflation expectations. Shorter maturities generally reduce real-rate sensitivity compared with longer TIPS, but a fund can still lose value when real yields rise. The broad TIPS model provides context for the short-term sleeve without implying identical maturity exposure.
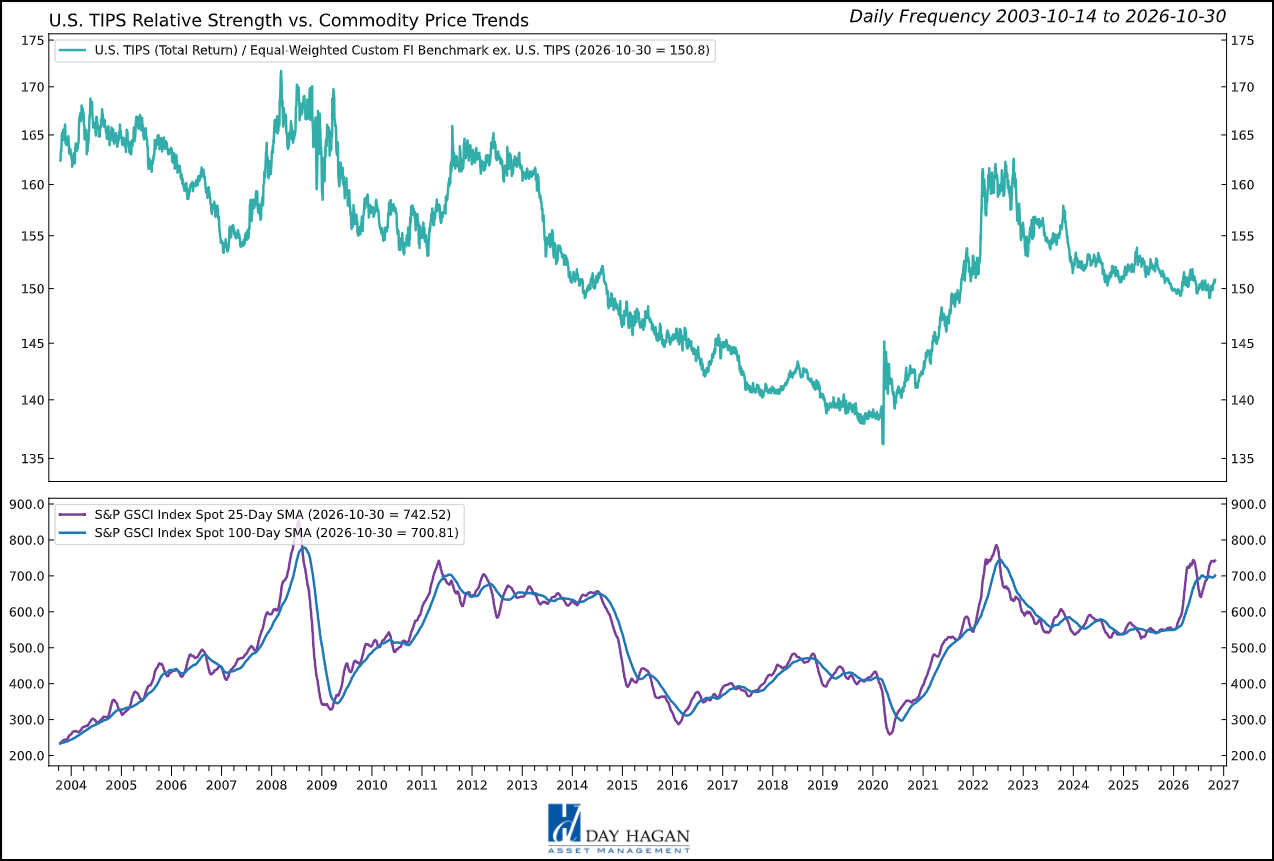
Figure 2: Commodity trends support inflation protection while TIPS price signals remain mixed.
U.S. MORTGAGE-BACKED SECURITIES — OVERWEIGHT
Mortgage-backed securities move to overweight. The moving-average cross and relative-strength slope have turned bullish since October, joining RSI, the ten-year-yield relationship, and the high-yield-spread relationship. Inflation expectations are now bearish. Five favorable readings out of six show broader support, with the strongest improvement in the price confirmation that was missing from last month’s case.
The chart below shows the five-day relative-strength average above its fifty-day average. We view that as support for increasing exposure, alongside the other favorable inputs. It does not establish that every mortgage coupon or structure offers the same value.
Freddie Mac’s October 29 survey put the average thirty-year mortgage rate at 7.24%, down from 7.32% a week earlier and 7.40% in mid-October. That is a rate paid by borrowers, not the yield on an MBS portfolio. Refinancing incentives depend on the difference between prevailing mortgage rates and each homeowner’s existing coupon, after costs. Lower rates can increase prepayments on newer, higher-coupon loans while leaving older, low-coupon loans largely unaffected.
For agency MBS, the principal portfolio issues often involve rate volatility, prepayments, and extension risk. Falling rates can return principal when reinvestment yields are lower. Rising rates can keep principal outstanding longer. Greater rate stability would make these cash flows easier to assess, but the overweight rests on improved model evidence rather than an assumption that volatility has disappeared
Figure 3: The positive relative moving-average crossover supports the higher allocation.
U.S. FLOATING RATE NOTES — NEUTRAL
Floating-rate securities remain neutral with four bullish inputs. The technical cross, technical momentum, OIS swap-rate relationship, and VIX-extremes measure are favorable. The relative-strength slope is bearish. Since October, the slope has weakened while VIX extremes have improved from neutral to bullish.
The chart below compares the three-year OIS rate with its smoothing. Its bullish signal describes the model’s relationship with floating-rate relative performance. The three-year OIS rate is not the coupon paid on the portfolio and should not be treated as a guaranteed path for future policy.
The Fed’s unchanged 3.75%–4.00% range maintains the current policy setting, but income resets depend on each instrument’s reference rate, spread, and reset schedule. Floating coupons can help when short rates rise. They can also fall when policy eases, leaving less opportunity for price appreciation than comparable fixed-rate bonds in a rate rally.
Credit quality remains essential. Treasury floaters, investment-grade corporate floaters, and leveraged loans are different exposures. Low interest-rate duration does not eliminate default or liquidity risk. Higher coupons paid to investors can increase interest expense for a credit-sensitive borrower. Neutral retains the income flexibility of floating rates without making the portfolio overly dependent on short rates staying elevated.
Figure 4: The OIS relationship remains favorable for floating-rate relative performance. However, it is nearing a potential sell signal.
U.S. IG CORPORATE BONDS — UNDERWEIGHT
U.S. investment-grade corporates remain underweight. The broader model is now evenly split: option-adjusted spreads, the dollar relationship, and the technical cross are bullish. Implied bond volatility, credit-default swaps, and price mean reversion are bearish. That is an improvement from October, but the model is not a corporate-only composite. The Aggregate universe also includes government and securitized bonds.
The chart below uses a smoothed rate of change in corporate OAS and a reversal rule. Its latest plotted value of 5.91 is a percentage rate-of-change measure, not a 5.91% credit spread. A bullish model state does not mean spreads are low, falling every day, or sufficient compensation for every issuer. The distinction matters when a reversal signal coexists with unsettled credit conditions.
The ICE BofA investment-grade OAS was 89 basis points on October 29. We assess that credit premium separately from the Treasury yield embedded in a corporate bond’s total yield. A borrower can remain financially sound while its bonds lose value because government yields rise or investors demand a larger spread.
Refinancing needs, acquisition financing, shareholder distributions, and capital spending can change the credit picture before a rating changes. We favor attention to cash generation and balance-sheet flexibility, especially where new investment absorbs cash ahead of future revenue. The underweight reflects the supplied allocation and mixed evidence. It does not imply that the portfolio expects widespread investment-grade defaults or that all corporate issuers have weakened.
Figure 5: The broad Aggregate OAS reversal signal is bullish but does not measure a corporate spread level.
U.S. HIGH YIELD — UNDERWEIGHT
High yield moves from overweight to underweight. The technical cross and VIX moving-average relationship have turned bearish since October. Breadth and the small-cap equity trend remain bearish. The absolute total-return moving-average cross has improved to bullish, and the OAS-reversal signal remains bullish. The resulting four-bearish, two-bullish mix supports a more cautious assessment.
The selected chart shows the five-day relative-strength average below the sixty-three-day average. The improvement in absolute return is welcome, but high yield can rise while lagging other bond sectors. That difference between absolute recovery and relative leadership helps explain why we are reducing exposure despite two favorable indicators.
The high-yield OAS was 326 basis points on October 29, versus 338 on October 23 and 314 on October 28. The recent narrowing has not been a straight line. The bullish spread-reversal input and bearish relative trend can coexist because they examine different transformations and horizons. Neither is a substitute for the full weight of evidence.
For lower-rated borrowers, the central issue is whether operating cash flow can cover interest and upcoming maturities without relying on unusually favorable refinancing markets. Sluggish real household spending and persistent input costs can pressure businesses with limited pricing power. Conversely, continued economic growth gives many issuers room to manage their liabilities. Our underweight recognizes deteriorating market confirmation without converting a mixed outlook into a blanket recession or default forecast.
Figure 6: Weak relative trends argue for reducing the high-yield allocation.
INTERNATIONAL IG CORPORATE BONDS — NEUTRAL
International investment-grade corporates remain neutral. The composite model has improved to four bullish inputs: equity risk/VIX, relative-strength slope, the moving-average cross, and credit-default swaps. OAS is neutral. October’s weaker volatility and spread signals have improved, but the broader global model should not be described as an international corporate-only composite.
The selected relative-strength-slope chart illustrates the favorable supplied classification. The improvement supports retaining diversified exposure. It does not automatically require an overweight in the corporate sleeve, whose credit mix and currency treatment can differ from those of the model universe.
The ECB held its deposit rate at 2.50% on October 29. Its statement warned that a more prolonged energy shock could lift inflation and reduce growth, while financing conditions had tightened. That is a difficult combination for energy-dependent businesses and argues for attention to margins, refinancing terms, and the ability to pass through costs.
Currency and hedging can materially change returns for a U.S. investor. Currency appreciation can add to an unhedged local bond return, while depreciation can offset it. Hedging reduces that translation exposure but introduces costs and imperfect offsets. Neutral preserves geographic and issuer diversification while the corporate allocation awaits a more consistent combination of valuation, operating fundamentals, and model confirmation.
Figure 7: Global Aggregate relative-strength improvement supports modest continued international exposure.
EMERGING MARKET BONDS — OVERWEIGHT
Emerging-market bonds move from overweight to underweight. The composite model now has bearish currency, emerging-equity momentum, and relative-strength-slope inputs. Commodity strength and the absolute moving-average cross are bullish. This is a material change from October, when currency, equity, and relative-strength relationships were favorable.
The selected chart shows the smoothed twenty-one-day rate of change in emerging-market equities at −7.30%, below its zero threshold. This is an equity-momentum input to the bond model, not a reported return on the emerging-market bond portfolio. It signals weaker cross-market support even as the absolute bond trend has improved.
Dollar-denominated bonds avoid direct local-currency translation of contractual payments for a dollar-based investor. Their issuers can still face currency risk. A borrower earning local currency must obtain dollars to service dollar debt, making reserves, export receipts, refinancing access, and maturity schedules important. Higher U.S. real yields can also increase competition for global capital.
Commodity conditions cut both ways. Strong prices can help exporters while increasing costs and external funding pressure for importers. The bullish commodity indicator therefore does not establish that every emerging sovereign or company benefits. We reduce exposure while looking for a recovery in currency and equity momentum and firmer relative trends. Country selection remains important, but the supplied allocation calls for less aggregate risk.
Figure 8: Negative emerging-equity momentum weakens support for dollar-denominated EM debt.
Catastrophic Stop Model
The Catastrophic Stop model remains a separate risk-control input for equities and fixed-income exposures that are highly correlated with equities. The latest value is 54.55%. The model still favored remaining invested at that reading, but the margin above its sell threshold has narrowed.
A reading below 40% for two consecutive days would generate a risk off signal. The latest model update reflected weaker shipping momentum, Russell 3000 supply and demand, and equity breadth, partly offset by excessive pessimism. Those observations reinforce the need to monitor equity-sensitive credit without implying that the model has already triggered a reduction.
Sector sizing and the Catastrophic Stop serve different purposes. High yield and emerging markets can be underweight because their sector evidence has weakened while the broader stop model remains above its threshold. Conversely, a sector overweight does not override a risk-control signal.
Figure 9: The Catastrophic Stop model recommends a fully invested position relative to the benchmark. Because the model uses indices to extend its history, the historical illustration is considered hypothetical.
Hypothetical and historical past performance is not indicative of future results. There can be no assurance that any investment or strategy will achieve its objectives or avoid substantial losses or have comparable results. This information is provided for illustrative purposes only and is not a prediction, projection, or guarantee of future performance. Hypothetical results do not reflect actual trading, were derived using the benefit of hindsight, and may not reflect material economic and market events. Actual results vary and depend on many factors and subject to risk and uncertainties.
Conclusion
We enter the month favoring mortgages, retaining balanced Treasury and inflation-protected exposure, and reducing the high-yield and emerging-market allocations. The mortgage overweight has stronger price confirmation than it did in October. Credit opportunities still exist, but the portfolio has less exposure to lower-quality and externally sensitive borrowers.
We will watch whether credit participation broadens, relative trends recover, and inflation pressure eases without a sharper loss of purchasing power. At the issuer level, cash generation after investment and the cost of refinancing remain central. We will also monitor how government borrowing and policy expectations affect long-term yields. Portfolio decisions will follow the evidence as it changes. This strategy uses price, valuation, economic, liquidity, and sentiment measures to make objective allocation decisions.
For more information, please contact us at:
Day Hagan Asset Management
1000 S. Tamiami Trl
Sarasota, FL 34236
Toll Free: (800) 594-7930
Office Phone: (941) 330-1702
Website: https://dayhagan.com or https://dhfunds.com
© 2026 Day Hagan Asset Management
This material is for educational purposes only. Further distribution is prohibited without prior permission. Please see the information on Disclosures and Fact Sheets here: https://dhfunds.com/literature. Charts with models and return information use indices for performance testing to extend the model histories, and they should be considered hypothetical. All Rights Reserved.
Sources
Supplied research. November holdings image, current indicator classifications, October letter, and fixed_income_All_Fixed_Income_Sectors_Bundle.pdf. Selected charts end October 29, 2026.
Federal Reserve. FOMC statement, October 28, 2026. https://www.federalreserve.gov/newsevents/pressreleases/monetary20261028a.htm
Bureau of Economic Analysis. GDP advance estimate for Q3, released October 29, 2026. https://www.bea.gov/news/2026/gdp-advance-estimate-3rd-quarter-2026
Bureau of Economic Analysis. Personal Income and Outlays for September, released October 29, 2026. https://www.bea.gov/news/2026/personal-income-and-outlays-september-2026
U.S. Treasury. Daily Treasury par yield curve, October 30, 2026. https://home.treasury.gov/resource-center/data-chart-center/interest-rates/TextView?type=daily_treasury_yield_curve&field_tdr_date_value_month=202610
U.S. Treasury. Daily Treasury real par yield curve, October 30, 2026. https://home.treasury.gov/resource-center/data-chart-center/interest-rates/TextView?type=daily_treasury_real_yield_curve&field_tdr_date_value_month=202610
ICE Data Indices via FRED. U.S. Corporate Index option-adjusted spread. October 29 observation, updated October 30. https://fred.stlouisfed.org/series/BAMLC0A0CM
ICE Data Indices via FRED. U.S. High Yield Index option-adjusted spread. October 29 observation, updated October 30. https://fred.stlouisfed.org/series/BAMLH0A0HYM2
Freddie Mac. Primary Mortgage Market Survey, October 29, 2026. https://www.freddiemac.com/pmms
European Central Bank. Monetary policy decisions, October 29, 2026. https://www.ecb.europa.eu/press/pr/date/2026/html/ecb.mp261029~9a493adf17.en.html
Day Hagan Smart Sector® Fixed Income ETF
Symbol: SSFI
Disclosures
The data and analysis contained within are provided “as is” and without warranty of any kind, either express or implied. The information is based on data believed to be reliable, but it is not guaranteed. Day Hagan DISCLAIMS ANY AND ALL EXPRESS OR IMPLIED WARRANTIES, INCLUDING, BUT NOT LIMITED TO, ANY WARRANTIES OF MERCHANTABILITY, SUITABILITY, OR FITNESS FOR A PARTICULAR PURPOSE OR USE. All performance measures do not reflect tax consequences, execution, commissions, and other trading costs, and as such, investors should consult their tax advisors before making investment decisions, as well as realize that the past performance and results of the model are not a guarantee of future results. The Smart Sector® Strategy is not intended to be the primary basis for investment decisions, and the usage of the model does not address the suitability of any particular investment for any particular investor.
Using any graph, chart, formula, model, or other device to assist in deciding which securities to trade or when to trade them presents many difficulties, and their effectiveness has significant limitations, including that prior patterns may not repeat themselves continuously or on any particular occasion. In addition, market participants using such devices can impact the market in a way that changes the effectiveness of such devices. Day Hagan believes no individual graph, chart, formula, model, or other device should be used as the sole basis for any investment decision and suggests that all market participants consider differing viewpoints and use a weight-of-the-evidence approach that fits their investment needs.
Past performance does not guarantee future results. No current or prospective client should assume future performance of any specific investment or strategy will be profitable or equal to past performance levels. All investment strategies have the potential for profit or loss. Changes in investment strategies, contributions or withdrawals, and economic conditions may materially alter the performance of your portfolio. Different types of investments involve varying degrees of risk, and there can be no assurance that any specific investment or strategy will be suitable or profitable for a client’s portfolio. Historical performance results for investment indexes and/or categories generally do not reflect the deduction of transaction and/or custodial charges or the deduction of an investment management fee, the incurrence of which would have the effect of decreasing historical performance results. There can be no assurances that a portfolio will match or outperform any particular benchmark. Comparisons to indices are inherently unreliable indicators of future performance. The strategies used to generate the performance vary from those used to generate the returns depicted in the benchmarks. Investors cannot directly invest in an index.
The information contained herein is provided for informational purposes only and should not be construed as investment advice or a recommendation to buy or sell any security. The securities, instruments, or strategies described may not be suitable for all investors, and their value and income may fluctuate. Past performance is not indicative of future results, and there is no guarantee that any investment strategy will achieve its objectives, generate profits, or avoid losses.
This material is intended to provide general market commentary and should not be relied upon as individualized investment advice. Investors should consult with their financial professional before making any investment decisions based on this information.
The material may contain “forward-looking” information that is not purely historical in nature. Such information may include, among other things, projections, forecasts, estimates of market returns, and proposed or expected portfolio composition. Day Hagan Asset Management, its affiliates, employees, or third-party data providers shall not be liable for any loss sustained by any person relying on this information. All opinions and views expressed are subject to change without notice and may differ from those of other investment professionals within Day Hagan Asset Management or Ashton Thomas Private Wealth, LLC.
Accounts managed by Day Hagan Asset Management or its affiliates may hold positions in the securities discussed and may trade such securities without notice.
Day Hagan Asset Management is a division of and doing business as (DBA) Ashton Thomas Private Wealth, LLC, an SEC-registered investment adviser. Registration with the SEC does not imply a certain level of skill or training.
This material is for educational purposes only. Further distribution is prohibited without prior permission. Please see the information on Disclosures and Fact Sheets here: https://dhfunds.com/literature. Charts with models and return information use indices for performance testing to extend the model histories, and they should be considered hypothetical. All Rights Reserved.
All hypothetical results are presented for illustrative purposes only. Back testing and other statistical analysis is provided in use simulated analysis and hypothetical circumstances to estimate how it may have performed prior to its actual existence. The results obtained from "back-testing" information should not be considered indicative of the actual results that might be obtained from an investment or participation in a financial instrument or transaction referencing the Index. The Firm provides no assurance or guarantee that the products/securities linked to the strategy will operate or would have operated in the past in a manner consistent with these materials. The hypothetical historical levels have inherent limitations. Alternative simulations, techniques, modeling or assumptions might produce significantly different results and prove to be more appropriate. Actual results will vary, perhaps materially, from the simulated returns presented.
© 2026 Day Hagan Asset Management
Disclosure
Federal Reserve (Fed) — The central bank of the United States, responsible for setting monetary policy and short-term interest rates.
U.S. Treasuries — Bonds issued by the U.S. government; they are widely used as benchmarks for interest rates and as defensive assets in portfolios.
T-bill (Treasury bill) — A short-term U.S. government security, typically maturing in one year or less.
Duration — A measure of a bond’s sensitivity to changes in interest rates; higher duration usually means greater price movement when yields change.
Yield — The income return on a bond, usually expressed as an annual percentage of its price.
Investment-Grade (IG) Corporate Bonds — Corporate bonds with relatively high credit quality and lower default risk than high-yield bonds.
High-Yield (HY) Bonds — Lower-rated corporate bonds that offer higher yields because they carry higher credit risk.
Private Credit — Non-bank lending, often directly to companies, outside the public bond markets.
TIPS (Treasury Inflation-Protected Securities) — U.S. government bonds designed to protect investors from inflation by adjusting principal based on inflation.
Breakeven Inflation Rate — The market’s implied inflation expectation, calculated as the difference between nominal Treasury yields and TIPS yields.
Real Yield — A bond yield after adjusting for inflation; often referenced in connection with TIPS.
Nominal Yield — A bond yield not adjusted for inflation.
Inflation Expectations — The market’s view of future inflation, which influences both bond yields and asset prices.
Mortgage-Backed Securities (MBS) — Bonds backed by pools of home mortgages; investors receive cash flows from underlying mortgage payments.
Agency MBS — Mortgage-backed securities issued or guaranteed by U.S. government-related agencies, generally viewed as having high credit quality.
Floating Rate Notes (FRNs) — Bonds whose interest payments reset periodically based on a short-term reference rate, reducing interest-rate sensitivity.
SOFR (Secured Overnight Financing Rate) — A key U.S. benchmark short-term interest rate used in loans, derivatives, and floating-rate instruments.
OIS (Overnight Index Swap) Rate — A rate derived from swaps tied to overnight interest rates, often used to gauge policy-rate expectations.
Primary Issuance — The sale of new bonds into the market by governments or companies.
Spread — The yield difference between one bond and a benchmark, often used to measure compensation for credit risk.
Option-Adjusted Spread (OAS) — A spread measure that adjusts for embedded bond options, commonly used in corporate bonds and mortgage-backed securities.
Credit Default Swap (CDS) — A derivative contract used to insure against bond default risk; rising CDS levels often signal greater credit concern.
Carry — The return earned from holding a bond or credit asset, assuming market conditions remain stable.
Refinancing Risk — The risk that a borrower will face higher costs or difficulty when replacing maturing debt with new debt.
Emerging Market (EM) Bonds — Debt issued by governments or companies in developing economies.
Hard-Currency Debt — Emerging-market debt issued in a major foreign currency, usually U.S. dollars or euros.
Local-Currency Debt — Emerging-market debt issued in the borrower’s domestic currency, making returns more sensitive to exchange-rate movements.
Risk-On / Risk-Off — Market environments where investors are either more willing to buy riskier assets (“risk-on”) or prefer safer assets (“risk-off”).
RSI (Relative Strength Index) — A technical indicator used to assess whether an asset may be overbought or oversold.
VIX — A widely followed measure of U.S. equity market volatility, often called the market’s “fear gauge.”