
Day Hagan Smart Sector® with Catastrophic Stop Strategy Update June 2025
A downloadable PDF copy of the Article:
Day Hagan Smart Sector® with Catastrophic Stop Strategy Update June 2025 (pdf)
Executive Summary
In May, the S&P 500 experienced a remarkable surge of 6.15%, marking its best performance for the month since 1990. This rally was driven by a combination of strong corporate earnings, declining inflation, easing trade tensions, and robust economic indicators. Notably, the earnings season for Q1 2025 played a pivotal role, with 90% of S&P 500 companies reporting by May 9, and 78% surpassing earnings per share (EPS) expectations, which was well above the 10-year average of 75%.
The blended earnings growth rate was 13.1% year-over-year, reflecting significant improvement from 12.8% the previous week and 7.1% at the end of March. This marked the second consecutive quarter of double-digit earnings growth, reinforcing investor confidence. Key sectors, including Information Technology, Healthcare, Communications Services, and Utilities, led the charge, with tech giants such as Apple, Microsoft, Alphabet, and NVIDIA contributing approximately 45% of the net earnings growth for Q1.
Despite a narrowing outperformance margin over the broader market, companies like Meta and Microsoft further fueled the rally with post-earnings gains, driven by increased business spending on artificial intelligence. Economic data releases presented a mixed bag of signals. The Commerce Department’s advance GDP report indicated a surprising 0.3% contraction in Q1, the first in three years, which raised concerns about potential economic slowdown. However, a late rally on April 30 suggested that investors viewed this contraction as temporary, particularly in light of the strong 0.7% increase in March consumer spending, which exceeded expectations. This resilience in consumer activity, which accounts for over two-thirds of U.S. economic output, was bolstered by cooling inflation at 2.3% in April, a near match for the Federal Reserve’s 2% target. Low jobless claims and steady wage growth further supported a sense of economic stability.
Although challenges remained, the market remained risk-on, focusing on productivity gains that suggested businesses were achieving higher output with fewer employees. Trade policy also played a critical role during this month, with the Trump administration’s tariff policies introducing significant uncertainty.
Optimism surged when the administration delayed and scaled back certain tariffs on Chinese goods, alleviating tensions and particularly benefiting tech and energy stocks sensitive to global supply chain disruptions. Analysts noted that while tariff risks persisted, the market’s favorable reaction to tariff relief highlighted the importance of clear policy in shaping investor sentiment. By the end of May, the forward 12-month price-to-earnings (P/E) ratio for the S&P 500 had risen to 21.2, slightly above the 5-year average of 19.9, suggesting a cautious optimism in light of prevailing economic and geopolitical factors.
Turning to our primary equity risk model, the Catastrophic Stop, the model’s level increased to 77.27% as of Friday, May 30 (where 0 represents the worst conditions and 100 represents the best). Measures calling breadth thrusts (periods of high demand), reversals from extreme oversold conditions, volume supply vs. demand, high-yield credit spreads (OAS), economic activity, and high-yield bond breadth are bullish. The Day Hagan Daily Market Sentiment Composite has moved further into the excessive optimism zone. This is not unusual after significant declines; historically, the model has often shown extreme pessimism that quickly transitions into excessive optimism. We interpret this rapid movement similarly to a “breadth thrust.” With sentiment indicators, we go with the flow until it reaches an extreme and reverses. In other words, we will rate this indicator as neutral until it reverses back below 70.
The message of the models is to maintain a full equity benchmark allocation.
Holdings
Sector
Consumer Discretionary
Consumer Staples
Communication Services
Energy
Financials
Health Care
Industrials
Information Technology
Materials
Real Estate
Utilities
Outlook (relative to benchmark weighting)
Overweight
Overweight
Overweight
Underweight
Neutral
Neutral
Neutral
Neutral
Neutral
Underweight
Underweight
Sector Review
Consumer Discretionary: The Composite model improved into June, with measures of short-term trend, mean reversion from oversold lows, price momentum, new highs vs. new lows, relative forward P/E, and increases in consumer credit and housing starts bullish. The still-elevated interest rate environment is a headwind. The net result is an increase in exposure to overweight.
Commentary: In May, the Consumer Discretionary sector of the S&P 500 recorded a notable increase of 9.4%, ahead of the broader index’s gain of 6.15%. This growth was largely driven by a rebound in consumer confidence, as evidenced by the Conference Board’s Consumer Confidence Index, which rose to 98.0—up by 12.3 points—following a U.S.-China tariff truce. Key players, including Amazon, Tesla, and Carnival, saw significant improvements in their stock performance, although concerns over potential tariff threats to the EU and Apple created temporary market volatility. First-quarter earnings indicated resilience, with firms such as Netflix and Ralph Lauren expected to surpass projections due to improved operational efficiencies. The Consumer Discretionary Select Sector SPDR (XLY) benefited from strong performances by major holdings like Amazon and Tesla. Investors should remain vigilant regarding changes in tariff policies and trends in consumer spending, as these factors could significantly influence the sector. Looking ahead to 2026, analysts forecast robust earnings growth of 14.6% for the sector.
Figure 1: A reversal in interest rates would be bullish for the Consumer Discretionary sector (and the market in general).
Consumer Staples: The composite model has been upgraded to overweight. Measures of short-term trend, relative price momentum, relative net new highs, breadth, food sales increases, short interest, and decelerating economic growth projections support this defensive play. There are some signs of near-term overbought conditions and a moderation in food price inflation (good for America, not as good for food company profits), which are headwinds. The net result is an increase in exposure.
Commentary: The S&P 500 Consumer Staples sector recorded a modest gain of 1.7%, underperforming the broader index’s increase. This sector, which includes consumables such as food, beverages, and household products, offered a reliable option for risk-averse investors amid economic fluctuations. Contributing factors included a decline in inflation and a rise in consumer spending. Improved relations regarding U.S.-China tariffs aided supply chains, benefiting major players such as Procter & Gamble and Walmart. However, looming EU tariffs and increasing input costs resulting from previous trade disruptions are expected to constrain profit margins, with flat operating earnings growth projected for 2025, a decrease from the 3.7% growth in 2024. The Consumer Staples Select Sector SPDR ETF (XLP) mirrored the trend, driven by leading firms like Costco, Walmart, and PepsiCo. Costco experienced a 4% increase following strong Q1 same-store sales, while Walmart rose by 3.2%, buoyed by e-commerce growth. Investors should closely monitor inflation rates and tariff discussions, as the consumer staples sector continues to offer a stable investment avenue amid market uncertainty.
Figure 2: Increasing food sales is constructive. Looking now for margin improvement.
Communication Services: The composite model remains overweight, supported by indicators calling the technical and operating environment. Trend, overbought/oversold, deviation from trend, and valuations are supportive.
Commentary: The sector experienced a notable 9.6% increase, surpassing the overall index. This surge was primarily driven by advancements in AI technology and a high demand for content, coupled with a decrease in inflation and an increase in consumer spending, which enhanced advertising revenues for major players such as Alphabet and Meta. Furthermore, easing U.S.-China trade tensions reduced supply chain issues affecting media and telecom companies. However, the sector faces challenges, such as potential EU tariffs and ongoing regulatory scrutiny regarding data privacy, which could impact the forecasted operating earnings growth of 10.5% for 2025, down from 29.5% in the previous year, due to increasing content creation costs. The sector benefited from this upward trend, with leading stocks like Alphabet and Meta recording gains. Netflix’s subscriber base surged 7% thanks to live sports streaming, while AT&T, despite facing debt concerns, continued to expand its 5G services.
Figure 3: Last month, we highlighted the Communication Services sector exiting extreme oversold conditions. This continues to be the case.
Energy: The composite model remains in negative territory, with measures of relative strength, volatility, breadth, cash flow generation, inventories, and spot pricing negative. We do note some near-term oversold conditions and continue to look for a better entry point once our models improve.
Commentary: In May, the S&P 500 Energy sector experienced a 0.3% increase, lagging behind the overall index. Oil prices were highly volatile, influenced by escalating tensions in the Middle East and ongoing OPEC+ production increases, which slowed the operations of major companies like ExxonMobil. A truce in U.S.-China tariffs initially alleviated supply chain concerns, enhancing refining margins. However, proposed tariffs by Trump on the EU and a significant 34% levy imposed by China on U.S. goods led to a decline in the sector towards the end of the month, underscoring the geopolitical risks at play. Investors are forecasting a 14.6% decline in earnings for the sector in 2025, with a rebound in 2026. The sector reflected this volatility. ExxonMobil gained 5% following solid first-quarter refining profits, while Chevron increased by 4.2% due to offshore production achievements. EOG Resources surged 6%, benefiting from improved shale efficiency. Investors should remain vigilant regarding geopolitical developments, particularly U.S.-China trade relations and Middle East stability, as the energy sector continues to offer significant cash flow potential amidst global uncertainties.
Figure 4: The 5-week point change in inventories is negative. Improvement in the composite model’s shorter-term technical measures would support an increase in exposure.
Financials: The composite model improved into June, supported by short-term price trends, relative oversold conditions, lower volatility, and a widening yield curve. Negative indicators include lower upside momentum, a weaker U.S. dollar, slowing bank loan growth, and modestly wider credit spreads. Valuations and business credit conditions are neutral. We are neutral.
Commentary: The S&P 500 Financials sector experienced a 4.3% gain, trailing behind the overall index’s increase, primarily due to ongoing geopolitical tensions and economic uncertainty. A mid-month truce in U.S.-China tariffs provided a brief boost, particularly benefiting banks like JPMorgan, which reported stronger loan demand. However, concerns surfaced as proposed tariffs on the EU and a looming 145% tariff threat on China triggered a 4% drop in the sector, highlighting its vulnerability to trade issues. Even with inflation cooling to 2.3% in April and a 0.7% increase in consumer spending, a contraction of 0.3% raised concerns about a recession, leading to a revised operating earnings growth forecast of 3.5% for 2025, down from 15.9% in 2024. Strong contributions came from leading holdings like JPMorgan, which rose 4.2% due to solid Q1 loan growth, and Berkshire Hathaway, which was up 3.8%. Visa and Mastercard navigated regulatory scrutiny over fees yet maintained stability.
Figure 5: Relatively subdued volatility (vs. the rest of the sectors) is rated positive.
Health Care: The composite model improved from last month to neutral. Negative inputs include relatively short-term trends, momentum, longer-term breadth, and a decline in healthcare personal expenditures. Positive supports include lower volatility (indicating defensive characteristics), the CPI for medical care increasing (showing healthcare pricing power remains in effect), and valuations being relatively cheaper. We are now neutral and will look to add once more technical indicators turn positive.
Commentary: The S&P 500 Health Care sector experienced a 5.7% decrease, falling short of the broader index. Continued uncertainty about a truce in U.S.-China trade tensions alleviated concerns regarding drug supply chains. Additionally, geopolitical tensions, including proposed EU tariffs by Trump and ongoing FTC investigations into drug pricing, pressured major pharmaceutical companies. Nonetheless, the 2025 projected operating earnings growth for the sector is 15.1%, compared to 5.2% in 2024. Volatility in the market was triggered by the nomination of Robert F. Kennedy Jr. for the Department of Health and Human Services, although his more moderate stance on vaccines helped stabilize investor sentiment. Key players, including Eli Lilly, UnitedHealth, Johnson & Johnson, and AbbVie, showed varied performance; Lilly dropped 12% after losing a major formulary deal, while UnitedHealth fell 18% amid leadership changes and retracted guidance. In contrast, Johnson & Johnson and AbbVie remained stable, supported by advancements in GLP-1 therapies.
Figure 6: The Health Care sector is oversold. A reversal from these levels would be encouraging.
Industrials: The composite model’s level remained neutral with short-term momentum, oversold conditions, breadth, CRB trends, industrial production, and the weaker U.S. dollar positive. Increased volatility relative to history, decelerating cash flows, higher valuations (based on sales trends), and lower oil prices (causing a contraction in the energy complex) are negative. We remain neutral.
Commentary: The S&P 500 Industrials sector demonstrated notable strength, advancing 8.6% year-to-date. The initial resolution of U.S.-China tariff disputes early in the month alleviated supply chain concerns, benefiting major manufacturers like Caterpillar and Boeing. The sector capitalized on strong first-quarter earnings, showcasing an 11% growth primarily fueled by infrastructure investment. However, fears of potential tariffs on the EU and alarming reports regarding tariff threats from China introduced temporary market jitters. Geopolitical stability, bolstered by a trade agreement between the U.S. and the U.K., provided further support. The sector’s projected earnings growth for 2025 is estimated at 5.6%, an improvement from the previous year’s -0.3%. The sector benefited from key holdings, including General Electric, Caterpillar, Boeing, and Union Pacific.
Figure 7: The rising tide of commodity pricing has historically been constructive for the Industrials sector (indicating increased economic activity), as long as it wasn’t due to supply chain pressures.
Information Technology: The composite model improved with the June update. The reversal from significant oversold conditions supported by lower valuations, higher short interest, positive earnings revision breadth, and relative price momentum remains supportive. We are modestly increasing exposure.
Commentary: The S&P 500 Information Technology sector achieved remarkable growth, rising 10.8% and maintaining its status as the largest sector, accounting for 31.7% of the index’s market capitalization. This surge was largely fueled by advancements in artificial intelligence (AI), with key players such as NVIDIA and Microsoft capturing the growing demand for AI infrastructure. Other major players, including Apple and Broadcom, also exhibited gains despite tariff uncertainties, reflecting resilience in the face of geopolitical tensions. Notably, hedge funds have shown increased interest in the tech sector, particularly in semiconductors, indicating a bullish outlook. However, the sector is facing potential risks, with the operating earnings growth forecast for 2025 at 16%, slightly down from 21% in 2024. Investors are advised to remain attentive to changes in trade policies and AI regulations, particularly as high valuations (P/E ratio of 28.9x) in the sector may lead to increased volatility.
Figure 8: Lower inflation expectations (smoothed 21-day point change) remain subdued but have recently increased slightly. A rise above the 1.5 SD line (blue) would be concerning.
Materials: The composite model improved. Measures of short-term trend, oversold conditions, breadth, valuations, and industrial capex are at historically low levels and are poised for a reversal. We will look to add exposure should our shorter-term indicators improve. We note that uptrends in gold, silver, natural gas, and the improvement in emerging market equities are constructive.
Commentary: The Materials sector experienced a 2.8% increase, falling short of the index’s growth but demonstrating resilience in a volatile commodity environment. A U.S.-China tariff truce eased supply chain challenges mid-month, benefiting key players like Dow and Freeport-McMoran in the chemicals and metals segments. However, proposed tariffs by the Trump administration on the EU and a temporary 145% tariff threat from China created uncertainty, contributing to a decline in materials stocks due to concerns about export restrictions. While rising commodity prices, particularly a 5% increase in copper driven by tensions in the Middle East, supported mining companies, operating earnings growth for Q1 2025 slowed to 5.6%, up from -8.0% in 2024, primarily due to tariff-induced cost pressures. Noteworthy gains were noted by Linde, Freeport-McMoran, Sherwin-Williams, and Dow.
Figure 9: Looking for a reversal from oversold extremes before increasing exposure.
Real Estate: The composite model declined with the June update due to a deterioration in relative breadth, weakness in the homebuilding industry, weaker business credit conditions, and a Citigroup Economic Surprise Index reading below 0%. We remain neutral.
Commentary: In May, the S&P 500 Real Estate sector experienced a 0.8% increase, underperforming the overall index. Proposed tariffs on the EU and ongoing tensions in the Middle East introduced apprehension about rising construction costs, leading to an operating earnings growth projection of -5.5% for 2025, down from 4.3% the previous year. Geopolitical uncertainties and potential regulatory changes further complicated the outlook. Key contributors include Prologis, American Tower, Equinix, and Crown Castle. Prologis saw a rise due to increased warehouse demand, while American Tower benefited from an increase linked to 5G leasing activity.
Figure 10: An improving Citi U.S. Economic Surprise Index is constructive for real estate. Nonetheless, rates and oversupply are still an issue.
Utilities: The composite model decreased entering June, with negative relative price momentum, short-term relative trend, and short-term overbought indicators. Additionally, measures of economic activity are mixed. The relative dividend yield remains an attractive characteristic. The net result is a neutral exposure relative to the benchmark.
Commentary: In May, the S&P 500 Utilities sector gained 3.4%, underperforming the index. Last month was marked by OPEC+ threatening and then implementing production increases. Our view is that prices are still under pressure. Nonetheless, geopolitical uncertainties, such as proposed EU tariffs and instability in the Middle East, could quickly shift concerns to potential increases in energy prices. Consequently, the operating earnings growth forecast for the sector was adjusted downward to 8.9% for 2025, compared to 9.2% in 2024, influenced by regulatory challenges. Additionally, concerns over rising interest rates created pressure on capital-intensive utilities. The sector can serve as a defensive option, with key holdings including NextEra Energy, Southern Company, Duke Energy, and Constellation Energy. We continue to monitor geopolitical influences and Federal Reserve policies as utilities, despite offering consistent dividends, navigate challenges from “higher for longer” interest rates and global market disruptions.
Figure 11: The earnings yield for the Utilities sector is near historically low levels relative to the calculated yield on the 10-year Treasury. For the sector to move appreciably higher, rates need to be lower.
Catastrophic Stop Update
The Catastrophic Stop model combines time-tested, objective indicators designed to identify high-risk periods for the equity market. The model entered June recommending a fully invested equity allocation relative to the benchmark.
The Catastrophic Stop model level increased to 77.27% as of Friday, May 30 (where 0 represents the worst conditions and 100 represents the best). Measures calling breadth thrusts (periods of high demand), reversals from extreme oversold conditions, volume supply vs. demand, high-yield credit spreads (OAS), economic activity, and high-yield bond breadth are bullish. The Day Hagan Daily Market Sentiment Composite has moved further into the excessive optimism zone. This is not unusual after significant declines; historically, the model has often shown extreme pessimism that quickly transitions into excessive optimism. We interpret this rapid movement similarly to a “breadth thrust.” With sentiment indicators, we go with the flow until it reaches an extreme and reverses. In other words, we will rate this indicator as neutral until it reverses back below 70.
The weight of the evidence suggests that the recent decline is not expected to extend into a significant downtrend. Of course, if our model flips negative (below 40% for two consecutive days), signaling more substantial problems, we will raise cash immediately.
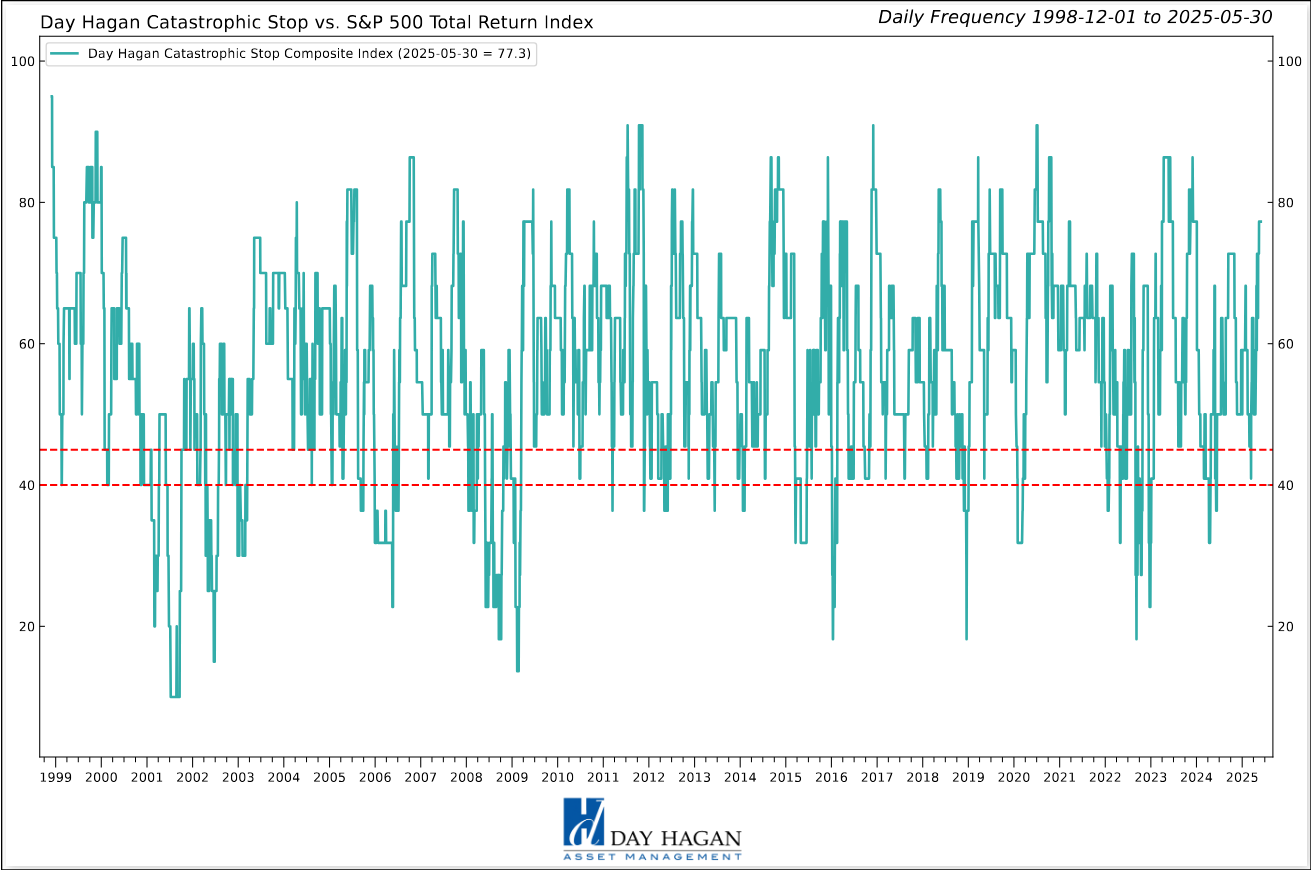
Figure 12: The Catastrophic Stop model recommends a fully invested equity position (relative to the benchmark). Note: The model’s levels prior to 5-1-2025 have been archived. As of that date, the model was modified to include Breadth Thrust and Oversold Mean Reversion clusters. Due to the use of indices to extend model history, the model is considered hypothetical.
The Day Hagan Daily Market Sentiment Composite (below) has recently moved into the excessive optimism zone from last month’s levels, denoting excessive pessimism. If the composite reverses back below 70, it would be considered a headwind for stocks. Currently, the trend is your friend.
Figure 13: S&P 500 Index vs. Day Hagan Daily Market Sentiment Composite
Our goal is to stay on the right side of the prevailing trend, introducing risk management when conditions deteriorate. Currently, the uptrend remains intact. The broader-based composite models calling U.S. economic growth, international economic growth, inflation trends, liquidity, and equity demand remain constructive. The Catastrophic Stop model is positive, and we are aligned with the message. If our models shift to bearish levels, we will raise cash.
This strategy uses measures of price, valuation, economic trends, monetary liquidity, and market sentiment to make objective, unemotional, rational decisions about how much capital to place at risk and where to place that capital.
For more information, please contact us at:
Day Hagan Asset Management
1000 S. Tamiami Trl
Sarasota, FL 34236
Toll Free: (800) 594-7930
Office Phone: (941) 330-1702
Website: https://dayhagan.com or https://dhfunds.com
This material is for educational purposes only. Further distribution is prohibited without prior permission. Please see the information on Disclosures and Fact Sheets here: https://dhfunds.com/literature. Charts with models and return information use indices for performance testing to extend the model histories, and they should be considered hypothetical. All Rights Reserved. (© Copyright 2025 Day Hagan Asset Management.)
Day HaganSmart Sector®
With Catastrophic Stop ETF
Symbol: SSUS
Disclosures
The data and analysis contained within are provided "as is" and without warranty of any kind, either express or implied. The information is based on data believed to be reliable, but it is not guaranteed. Day Hagan DISCLAIMS ANY AND ALL EXPRESS OR IMPLIED WARRANTIES, INCLUDING, BUT NOT LIMITED TO, ANY WARRANTIES OF MERCHANTABILITY, SUITABILITY, OR FITNESS FOR A PARTICULAR PURPOSE OR USE. All performance measures do not reflect tax consequences, execution, commissions, and other trading costs, and as such, investors should consult their tax advisors before making investment decisions, as well as realize that the past performance and results of the model are not a guarantee of future results. The Smart Sector® Strategy is not intended to be the primary basis for investment decisions and the usage of the model does not address the suitability of any particular in Fixed Income vestment for any particular investor.
Using any graph, chart, formula, model, or other device to assist in deciding which securities to trade or when to trade them presents many difficulties and their effectiveness has significant limitations, including that prior patterns may not repeat themselves continuously or on any particular occasion. In addition, market participants using such devices can impact the market in a way that changes the effectiveness of such devices. Day Hagan believes no individual graph, chart, formula, model, or other device should be used as the sole basis for any investment decision and suggests that all market participants consider differing viewpoints and use a weight-of-the-evidence approach that fits their investment needs.
Past performance does not guarantee future results. No current or prospective client should assume future performance of any specific investment or strategy will be profitable or equal to past performance levels. All investment strategies have the potential for profit or loss. Changes in investment strategies, contributions or withdrawals and economic conditions may materially alter the performance of your portfolio. Different types of investments involve varying degrees of risk, and there can be no assurance that any specific investment or strategy will be suitable or profitable for a client’s portfolio. Historical performance results for investment indexes and/or categories generally do not reflect the deduction of transaction and/or custodial charges or the deduction of an investment management fee, the incurrence of which would have the effect of decreasing historical performance results. There can be no assurances that a portfolio will match or outperform any particular benchmark.
Day Hagan Asset Management is registered as an investment adviser with the United States Securities and Exchange Commission. SEC registration does not constitute an endorsement of the firm by the Commission nor does it indicate that the adviser has attained a particular level of skill or ability.
There may be a potential tax implication with a rebalancing strategy. Re-balancing involves selling some positions and buying others, and this activity results in realized gains and losses for the positions that are sold. The performance calculations do not reflect the impact that paying taxes would have, and for taxable accounts, any taxable gains would reduce the performance on an after-tax basis. This reduction could be material to the overall performance of an actual trading account. Day Hagan does not provide legal, tax or accounting advice. Please consult your tax advisor in connection with this material, before implementing such a strategy, and prior to any withdrawals that you make from your portfolio.
There is no guarantee that any investment strategy will achieve its objectives, generate dividends or avoid losses.
© 2025 Day Hagan Asset Management
