
Day Hagan Smart Sector® with Catastrophic Stop Strategy Update July 2024
A downloadable PDF copy of the Article:
Day Hagan Smart Sector® with Catastrophic Stop Strategy Update July 2024 (pdf)
Catastrophic Stop Update
The Catastrophic Stop model combines time-tested, objective indicators designed to identify high-risk periods for the equity market. The model (Figure 1) held steady during June and entered July with a fully invested equity allocation recommendation.
Figure 1: Catastrophic Stop Model vs. S&P 500 Total Return Index
It is important to note that the Breadth factor remains negative (Figure 2), suggesting relatively low market participation. Meanwhile, the Sentiment factor (Figure 3) is close to the Excessive Optimism zone. This indicates that investors are currently focused on the big companies leading the market this year. In fact, the median S&P 500 stock is up just over 3% this year, and only 25.15% of S&P 500 stocks have outperformed the index year-to-date (Figure 4).
Figure 2: ACWI Breadth Factor illustrates a lack of broad-based participation.
Figure 3: NDR Daily Trading Sentiment Composite near excessive optimism levels.
Figure 4: The percentage of stocks outperforming the S&P 500 YTD is just 25.15%.
Other technical measures within the Catastrophic Stop models remain generally bullish outside of breadth, with the exception of the Breadth Thrust and Oversold Mean Reversion factors, which are neutral. Overall, the model’s external (operating environment-related) indicators remain positive, though other indicators we track that evaluate the economic landscape are showing signs of fatigue. Nonetheless, measures of financial stress, such as Option Adjusted Spreads (Figure 5), indicate the probability of an extended downturn is relatively low.
Figure 5: OAS for Corporates, High Yield, Mortgages, and Agencies remain below long-term averages.
Sector Outlook
Sector
Consumer Discretionary
Consumer Staples
Communication Services
Energy
Financials
Health Care
Industrials
Information Technology
Materials
Real Estate
Utilities
Outlook (relative to benchmark weighting)
Neutral
Underweight
Neutral
Neutral
Neutral
Overweight
Neutral
Overweight
Underweight
Underweight
Underweight
Sector Commentary
As we’ve discussed over the past few months, the capping effect continues to evolve. The Technology Select Sector SPDR Fund (XLK) rebalanced the top 3 holdings on June 21. Nvidia’s weighting increased to 20.6% (from under 5%), while Apple was reduced to 4.36% (versus over 24% in the GICS Information Technology sector). In response, we exited the Semiconductor ETF exposure (SMH) we added at the beginning of the month (to true-up the NVDA weighting) but continued holding the MAGS ETF to account for the Apple underweighting in XLK.
Data dependency has gained popularity (our strategy is founded upon it) as the market fluctuates with each new economic data point. Investors often overlook the adage that “one data point does not make a trend.” With zero days to expiration options in play and a growing presence of algo/systematic traders, prices can swing dramatically after unexpected economic reports. Even the Federal Reserve has emphasized its data dependency.
Yet, in its June meeting, it resisted the trend of reacting to the latest data. Despite encouraging Consumer Price Index (CPI) inflation news, the Fed maintained its outlook, moving from expecting 2-3 rate cuts this year to just one. FactSet projects Q2 2024 revenue growth of 4.6% year-over-year and earnings per share (EPS) growth of 9.0%, marking the strongest period since Q1 2022. This would be the 15th consecutive quarter of positive revenue growth, with 10 out of 11 sectors showing growth, except for Materials. The net profit margin is expected at 12.0%, up from 11.8% in Q1 and 11.6% a year ago. For Q3 2024 and beyond, FactSet anticipates 5.5% revenue growth and 13.6% earnings growth.
We remain constructive, with positive but slowing macro data leading into a seasonally strong July and earnings season. Moreover, should the Fed cut rates with the S&P 500 near all-time highs, which it has done 20 times since 1980, the market has historically risen, averaging a 14% return over the following year. Additionally, corporate balance sheets show a positive financing surplus, suggesting continued share buybacks or debt reduction, supporting credit. Money market fund assets hit a record $6.12 trillion, potentially moving back into risk assets. Valuation is not seen as a significant market catalyst (yet); compared to the Tech Bubble, the S&P 500 is trading lower at a forward P/E of 20.9x versus 25.2x.
We note that a time correction has been in place for months for most indices and sectors except for the major capitalization-weighted indexes (especially large-cap growth). We are starting to see green shoots in previously underperforming sectors and are looking to our models for confirmation that the trends are sustainable. Central Bank policies, especially away from the U.S., are moving toward less restrictive stances. Lastly, July has a positive bias, though there can be some weakness toward the end of the month.
While geopolitical risks remain high, necessitating the inclusion of risk management triggers such as the Catastrophic Stop, our overall view based on the message of the models remains constructive.
Sector Review
Consumer Discretionary: The overall model has improved and now resides in neutral territory. The increase is due to recent positive short-term momentum and an expanding number of new highs, indicating broadening upside participation. Relative valuations are favorable, earnings surprises have generally been to the upside, and consumer credit conditions remain supportive. On the negative side, higher interest rates and the resulting slowdown in discretionary consumer spending are headwinds. Even McDonald’s (MCD) recently missed estimates as consumers became more cost-conscious. Amazon’s (AMZN) view on consumer spending is also somewhat cautious. It notes that customers are trading down on price and seeking out deals. Consumer spending appears to be weaker in Europe than in the U.S. Amazon pointed to some softness in the global economic environment, particularly in Europe, with consumers being more restrained in spending. We’re monitoring these developments closely. The net result is a neutral allocation relative to the benchmark.
Figure 6: Higher rates negatively impacting consumer spending and consumer discretionary stocks.
Consumer Staples: The current underweight allocation is backed by weak internal (technical) and external (operating environment) indicators. Several measures—including trend, OBOS, breadth, valuation, food inflation, growth in food sales, and the cumulative short-interest ratio for staples stocks—are showing negative trends. While stocks like PG, COST, WMT, KO, and PEP are generally considered stable, the sector’s various valuation measures reside toward the high end of the 20-year range. It’s worth noting that the defensive appeal of the sector may become significant if the markets slow down. For instance, the Citi G10 Economic Surprise Index has recently turned negative, which has historically been positive for defensive stocks.
Figure 7: Economic weakness eventually benefits defensive areas of the market.
Communication Services: Most internal and external indicators are negative, but there are a couple of green shoots, with two indicators, trend and long-term momentum, turning positive with this month’s update. Sales growth trends and credit spreads for the sector are also supportive. The sector is expected to benefit from continued advancements in AI, which can enhance efficiencies in digital content and advertising and improve customer engagement through hyper-personalization. Key players like Meta Platforms and Alphabet are well-positioned to leverage these AI-driven opportunities, potentially driving further revenue growth. We are neutral relative to the benchmark.
Figure 8: Relative price momentum has improved (bottom clip of chart above).
Energy: Both the Internal and External composites are mixed. For example, negative factors include momentum, OBOS, rolling volatility, valuation (based on cash flow), and inventories. Positive supports include breadth improvement, pessimistic crude futures crowd sentiment, crude spot prices, and the U.S. dollar. Recently, OPEC+ extended 3.6 mbd of existing cuts until the end of 2025, focusing on undercompliance. We view the OPEC announcement as providing a floor for global crude oil prices in 2024. However, we will maintain our current exposure until our technical indicators show that investors are once again accumulating energy stocks, indicating recognition of a potential supply/demand imbalance. At this juncture, the weight of the evidence is inconclusive as the model seeks to identify the next major trend. Until it does, we remain with a neutral allocation.
Figure 9: Inventories are approaching the low levels that have historically been associated with support.
Financials: Internal and External indicators are mixed. Measures of trend, relative volatility, economic activity, bank loan growth, valuations, and the yield curve are negative. Business conditions, credit spreads, and a stronger dollar are favorable. We do note that the sector is relatively oversold, and should indicators reverse higher, it would signal an increase in exposure is warranted. Currently, the net result of the indicators is a neutral weighting.
Figure 10: Oversold conditions are evident in the Financials sector, though not to the degree seen in 2020 and early 2023.
Health Care: Even with the excitement around weight-loss drugs, the sector’s returns have been average, with YTD results being the fifth worst of the 11 sectors. The sector’s technical indicators are still mixed, but the operating environment is improving. Indicators calling medical CPI, HC company aggregate book values, and aggregate HC company credit spreads are supportive. Additionally, personal expenditures for health care are gradually increasing. With elections ahead, we’re keeping an eye on proclamations around changes to Medicare/Medicaid and regulatory risk. We are now slightly overweight as the technical indicators turn positive, indicating that the overall trend has likely reversed.

Figure 11: Short-term relative momentum shows signs of a reversal from oversold levels
Industrials: This month’s update has improved the model slightly into neutral mode. Measures of short-term relative price trends and volatility have turned positive. A review of the operating environment for cyclicals indicates that recent trends in the U.S. dollar, U.S. industrial production, commodities, and aggregate sector cash flows are supportive. Conversely, valuations and the recent pullback in oil prices are headwinds (valuations remain at the higher end of the 20-year range while economic activity shows signs of slowing). While obvious factors support aerospace and defense (about 16.8% of the sector), economic uncertainty remains a headwind. In GE’s (the largest holding in the sector) latest earnings report, GE Aerospace, Commercial Engines, Defense, and Propulsion grew nicely. The net result is now a neutral exposure relative to the benchmark.

Figure 12: Rising consumer confidence supports cyclicals/industrials.
Information Technology: We remain overweight the sector, with internal and external indicators leaning marginally more positively. Net new highs are expanding and other breadth indicators are nearing buy signal inflection points. Perhaps it’s time for the troops to help the generals. As mentioned last month, the sector is overbought, but overbought levels can persist. At this point, a decisive reversal has not occurred. Upside positioning is extended, and with investors still very optimistic, earnings must hit all cylinders. NVDA is now trading at 25.3x forward sales (not earnings), vs. 13.6x for Microsoft and 8.4x for Apple.
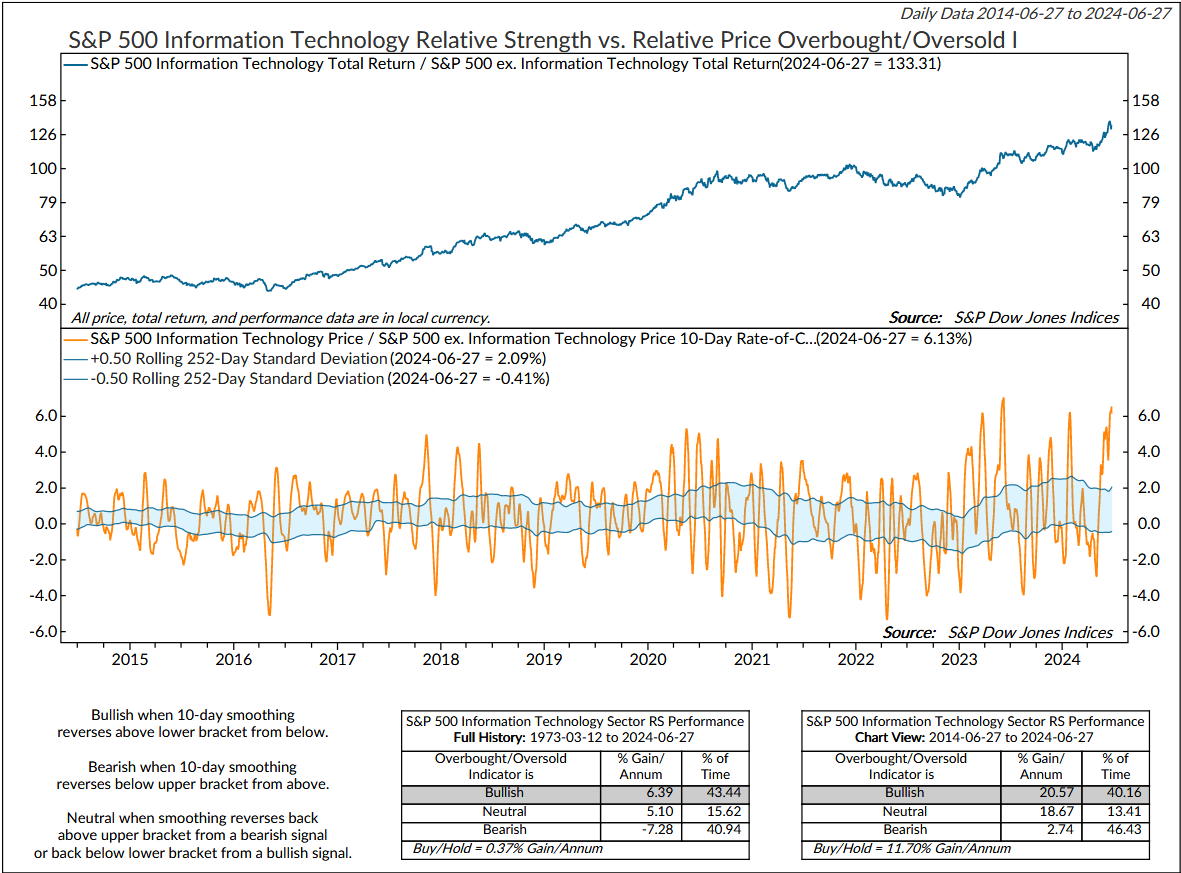
Figure 13: Go with the flow until it reaches an extreme and reverses. This particular OBOS indicator will flip to a sell signal when the 10-day rate of change declines below the top bracket.
Materials: We remain underweight. Internal indicators are negative, and external indicators are mixed but lean negative. The performance of this diverse sector (including metals, chemicals, and construction materials) is closely tied to global economic conditions. Measures of industrial production for materials and a substantial decline in copper spot prices confirm our view that economic activity is decelerating. We will look to upgrade when the technical indicators confirm an uptrend is developing.
Figure 14: Strength in Emerging Markets (especially China and India) has typically been bullish for the Materials sector. However, so far this cycle, prices haven’t responded, which is consistent with the overall bearish message of our Materials sector model.
Real Estate: Like last month, we are underweight the sector. It is the only sector with a negative return YTD. CRE is still a risk, with over $1 trillion in CRE loans coming due throughout the rest of this year. Based on Q1 earnings, aggregate FFO was flat, but the divergence by sector was stark. Retail, telecommunications, and apartment FFOs were solid. Industrial and office REITs were weak. The model’s technical indicators are bearish overall. At the same time, the external backdrop is mixed, based on an evaluation of employment, interest rate trends, industrial production for construction supplies, business credit conditions, and economic activity.
Figure 15: The Citi Economic Surprise Index’s negative reading, while positive for defensive sectors, has historically been negative for Real Estate.
Utilities: High interest rates have been a headwind, making fixed-income alternatives more attractive and increasing borrowing costs for utilities. However, regulated utilities can often pass increased costs to consumers, helping sustain their earnings outlook. As an AI beneficiary, Utilities moved higher due to the expected increase in energy consumption, however, investors appear to have largely played out that theme. This is confirmed by measures of trend, momentum, OBOS, and breadth all negative. We are moving back to an underweight in the sector.
Figure 16: S&P 500 Utilities Relative Strength vs. Relative Price Momentum
Our goal is to stay on the right side of the prevailing trend, introducing risk management when conditions deteriorate. Currently, the uptrend remains intact. As has been the case for all of 2024, the broader-based composite models calling U.S. economic growth, international economic growth, inflation trends, liquidity, and equity demand remain constructive. The Catastrophic Stop model is positive, and we are aligned with the message. If our models shift to bearish levels, we will raise cash.
This strategy uses measures of price, valuation, economic trends, monetary liquidity, and market sentiment to make objective, unemotional, rational decisions about how much capital to place at risk and where to place that capital.
For more information, please contact us at:
Day Hagan Asset Management
1000 S. Tamiami Trl
Sarasota, FL 34236
Toll Free: (800) 594-7930
Office Phone: (941) 330-1702
Website: https://dayhagan.com or https://dhfunds.com
Charts courtesy Ned Davis Research (NDR). © Copyright 2024 NDR, Inc. Further distribution prohibited without prior permission. All Rights Reserved. See NDR Disclaimer at www.ndr.com/copyright.html. For data vendor disclaimers refer to www.ndr.com/vendorinfo.
Day Hagan/Ned Davis Research
Smart Sector® With Catastrophic Stop ETF
Symbol: SSUS
Disclosures
The data and analysis contained within are provided "as is" and without warranty of any kind, either express or implied. The information is based on data believed to be reliable, but it is not guaranteed. Day Hagan DISCLAIMS ANY AND ALL EXPRESS OR IMPLIED WARRANTIES, INCLUDING, BUT NOT LIMITED TO, ANY WARRANTIES OF MERCHANTABILITY, SUITABILITY, OR FITNESS FOR A PARTICULAR PURPOSE OR USE. All performance measures do not reflect tax consequences, execution, commissions, and other trading costs, and as such, investors should consult their tax advisors before making investment decisions, as well as realize that the past performance and results of the model are not a guarantee of future results. The Smart Sector® Strategy is not intended to be the primary basis for investment decisions and the usage of the model does not address the suitability of any particular in Fixed Income vestment for any particular investor.
Using any graph, chart, formula, model, or other device to assist in deciding which securities to trade or when to trade them presents many difficulties and their effectiveness has significant limitations, including that prior patterns may not repeat themselves continuously or on any particular occasion. In addition, market participants using such devices can impact the market in a way that changes the effectiveness of such devices. Day Hagan believes no individual graph, chart, formula, model, or other device should be used as the sole basis for any investment decision and suggests that all market participants consider differing viewpoints and use a weight-of-the-evidence approach that fits their investment needs.
Past performance does not guarantee future results. No current or prospective client should assume future performance of any specific investment or strategy will be profitable or equal to past performance levels. All investment strategies have the potential for profit or loss. Changes in investment strategies, contributions or withdrawals and economic conditions may materially alter the performance of your portfolio. Different types of investments involve varying degrees of risk, and there can be no assurance that any specific investment or strategy will be suitable or profitable for a client’s portfolio. Historical performance results for investment indexes and/or categories generally do not reflect the deduction of transaction and/or custodial charges or the deduction of an investment management fee, the incurrence of which would have the effect of decreasing historical performance results. There can be no assurances that a portfolio will match or outperform any particular benchmark.
Day Hagan Asset Management is registered as an investment adviser with the United States Securities and Exchange Commission. SEC registration does not constitute an endorsement of the firm by the Commission nor does it indicate that the adviser has attained a particular level of skill or ability.
There may be a potential tax implication with a rebalancing strategy. Re-balancing involves selling some positions and buying others, and this activity results in realized gains and losses for the positions that are sold. The performance calculations do not reflect the impact that paying taxes would have, and for taxable accounts, any taxable gains would reduce the performance on an after-tax basis. This reduction could be material to the overall performance of an actual trading account. Day Hagan does not provide legal, tax or accounting advice. Please consult your tax advisor in connection with this material, before implementing such a strategy, and prior to any withdrawals that you make from your portfolio.
There is no guarantee that any investment strategy will achieve its objectives, generate dividends or avoid losses.
© 2024 Day Hagan Asset Management
