
Day Hagan Smart Sector® International Strategy Update June 2026
A downloadable PDF copy of the Article:
Day Hagan Smart Sector® International Strategy Update June 2026 (pdf)
Executive Summary
Global equities entered June with a more complicated setup than the spring rally suggested. By month-end, the macro picture looked less forgiving than it had earlier in the spring. Investors still favored companies with clear profit drivers, but the broader case for risk assets became more dependent on inflation cooling, fuel prices staying contained, and central banks avoiding a policy mistake. U.S. data showed price pressure was still filtering through household budgets, while revised growth figures suggested demand was not as firm as first reported. Business surveys were mixed, with factory activity helped by technology spending and inventory planning, while services showed less follow-through.
Outside the U.S., the message was uneven. China’s May factory survey slipped to the edge of expansion as new orders softened, even though advanced manufacturing continued to outpace weaker consumer-linked areas. Europe faced a tougher trade-off as inflation concerns met slower activity. The U.K. flash PMI moved into contraction, while Japan remained exposed to currency and import-cost pressures. The takeaway was selective exposure, not broad optimism.
In Australia, the economic picture tilted toward slower growth with stubborn price pressure. April employment fell, and the jobless rate reached its highest level since 2021, while monthly CPI cooled only because of fuel-tax relief; core inflation still ticked higher as energy costs spread through the economy. That left the Reserve Bank of Australia with less room to ease and made banks, miners, and domestic cyclicals more sensitive to incoming data.
Canada looked steadier. April PMI releases pointed to improving activity, with the Ivey PMI rising to a seven-month high and the composite PMI nearly back to expansion, yet labor-market signals were softer, and Bank of Canada officials highlighted structural hiring challenges. Canadian banks generally outpaced expectations in capital markets, wealth, and domestic lending, although housing, insolvencies, and trade exposure kept the equity story selective.
China remained the swing factor. May’s official manufacturing PMI slipped to the expansion line, while April industrial output and retail sales undershot forecasts. The data supported a view of uneven demand: property, employment, and consumption were soft, while high-tech and equipment manufacturing continued to attract capital.
In Europe, France and Germany offered different versions of the same pressure. French inflation rose to a 27-month high in May, though below forecasts, while consumer confidence fell, and purchasing managers’ data showed demand pulled forward by inflation concerns. Germany confirmed first-quarter growth, helped by exports, but May PMI readings signaled another contraction in private-sector activity, and services remained under pressure.
Data for other developed markets showed that Japan’s first-quarter GDP outpaced expectations, supported by exports, but the yen, energy imports, and Bank of Japan policy kept the outlook finely balanced. Switzerland’s first-quarter growth accelerated, led by industry, services, and exports, reinforcing its quality profile despite franc strength. The United Kingdom looked more interesting than it has in some time: business confidence improved in May, but retail surveys, consumer-services sentiment, and a sub-50 composite PMI showed that higher prices and softer demand still mattered. Overall, the global equity backdrop favored a balanced approach. Investors had reason to focus on companies with dependable earnings, pay close attention to currency moves that could help or hurt returns, and avoid moving too aggressively before central banks provided more clarity on interest rates.
Holdings
Core: Developed Market Positions (approximately 65% of equity holdings)
Country
Australia
Canada
China
France
Germany
Japan
Switzerland
United Kingdom
Outlook
Underweight
Overweight
Neutral
Underweight
Underweight
Overweight
Underweight
Neutral
Explore: Emerging Market Positions (approximately 35% of equity holdings)
Malaysia
Brazil
Philippines
Hong Kong
Mexico
Position Details
Core: Developed Market Commentary
Approximately 65% of the strategy is allocated across eight of the largest markets in the ACWI ex-U.S. Index. The fund overweights and underweights the largest non-U.S. equity markets based on macro, fundamental, behavioral, and technical indicators.
Australia: Australia’s composite model is more cautious than it was earlier in the year. Most of the country’s indicators are negative, including trend, interest-rate sensitivity, technical strength, and earnings yield. The brighter spots are gold exposure and lower beta, which can help when global markets become less steady. The valuation picture is not especially cheap either. MSCI Australia trades at 17.7 times forward earnings, 2.6 times book value, and 11.6 times cash flow.
The economic data support a selective view. Australia’s May composite PMI fell to 47.8 from 50.4, showing that private-sector activity moved back into contraction. Inflation has cooled from earlier peaks, but it has not fallen enough to make the Reserve Bank of Australia comfortable. The RBA kept policy tight, and that matters for banks, housing, consumers, and rate-sensitive sectors. Australia still has useful exposure to commodities, miners, banks, and defensive dividend payers. However, slower activity and less attractive earnings-yield signals argue against treating the market as a broad opportunity. The better approach is to focus on companies with stronger balance sheets, pricing power, and exposure to global demand for resources.
Figure 1: Relative earnings show signs of improvement. If confirmed by an improvement in technical indicators, it would indicate that an upgrade is warranted.
Canada: Canada still looks better than many of its economic numbers suggest. The market indicators are mostly supportive, with positive readings from trend, mean reversion, technical strength, and relative earnings yield. That tells us investors are still finding reasons to own Canada. The main concerns are weaker leading indicators and a less helpful Canadian dollar. MSCI Canada trades at 16.5 times forward earnings, 2.8 times book value, and 13.3 times cash flow, which is reasonable but not deeply discounted.
The economy is mixed, but the market has some clear leadership areas. Energy, pipelines, banks, materials, gold, and infrastructure remain important drivers. Canada’s PMI data recently improved, with the composite reading moving closer to expansion, but this does not mean demand is strong across the board. Inflation is still above the Bank of Canada’s target, unemployment has moved higher, and housing remains a source of risk. The Bank of Canada has kept rates steady while watching energy prices, trade policy, and consumer stress. For investors, Canada offers a useful mix of income, commodities, and financial exposure. The risk is that softer growth eventually weighs on bank credit quality and earnings revisions.
Figure 2: During May, the Canadian dollar strengthened relative to the U.S. dollar.
China: China remains a market with opportunity, but also plenty of uncertainty. The indicators are split. Price momentum, trend, and the currency signal are negative, while the mean reversion, PMI, and credit spread signals are more supportive. In plain English, China looks inexpensive, and policy support is helping, but the market still lacks a clean growth story. MSCI China trades at 11.1 times forward earnings, 1.4 times book value, and 11.5 times cash flow, which is low compared with most developed markets.
The May economic data showed why investors remain divided. China’s official manufacturing PMI slipped to 50.0 from 50.3, right at the line between expansion and contraction. New orders and export demand were softer, while high-tech manufacturing and equipment production remained stronger. Consumer demand remains uneven, and the property market continues to drag on confidence. Policy support is likely to continue, but investors want to see it flow through to household spending and private-sector activity. China may appeal to investors looking for valuation support and policy upside, but it still requires patience. The strongest areas remain tied to advanced manufacturing, technology self-sufficiency, electric vehicles, and companies less dependent on property or weak consumer confidence.
Figure 3: High-yield credit spreads often represent risk-on versus risk-off attitudes. Lower spreads potentially indicate risk on, which would be constructive for China.
France: France looks challenging from an indicator standpoint. Several signals are negative, including trend, short-term momentum, leading indicators, the technical scorecard, and valuation. The positive readings come from market breadth and dividend yield, which means there are still investable parts of the market, but the broad country signal is not strong. MSCI France trades at 14.6 times forward earnings, 2.1 times book value, and 10.9 times cash flow.
The economic data also argues for caution. France’s May composite PMI fell to 43.5 from 47.6, showing a deeper contraction in private-sector activity. Inflation also moved higher, with energy playing a major role. That creates a difficult mix for investors because companies face weaker demand while households face higher costs. The ECB remains focused on inflation, so rate relief may not come soon enough to help the economy in the near term. France still has world-class companies in luxury goods, healthcare, industrials, and consumer brands. The issue is that leadership is narrow and tied to global demand. For a portfolio, France may still deserve exposure, but the focus should be on companies with global revenue, strong margins, and less dependence on the domestic economy.
Figure 4: The technical outlook for France’s equity market remains negative.
Germany: Germany is a mixed story. Some indicators are encouraging, including market breadth, relative moving averages, and dividend yield. Others are less favorable, including manufacturing confidence, fund flows, the euro signal, and the broader technical scorecard. That fits the current environment. Germany has high-quality global companies, but the economy is still dealing with weak industrial demand, energy costs, and trade uncertainty. MSCI Germany trades at 14.7 times forward earnings, 1.9 times book value, and 8.2 times cash flow, making it one of the more reasonably valued developed markets.
The latest data shows improvement is still uneven. Germany’s composite PMI rose slightly to 48.6 from 48.4, but it stayed below 50, which points to contraction. Manufacturing was nearing stabilization, but services remained under pressure. Germany’s economy is also sensitive to China, global capital spending, energy prices, and the euro. That creates both risk and opportunity. Investors should look for companies tied to automation, defense, electrification, infrastructure, and global industrial upgrades. The valuation case is better than in some markets, but Germany still needs stronger orders, stronger export momentum, and greater confidence among manufacturers before the broad market case becomes easier to make.
Figure 5: ETF fund flows are among the few indicators that remain supportive of Germany.
Japan: Japan still has one of the cleaner market setups in the group. The indicators are mostly positive, including absolute trend, relative trend, technical strength, valuation, and the yen signal. The main concerns are weaker forward earnings-growth signals, sentiment risk, and exposure to China’s cycle. MSCI Japan trades at 17.4 times forward earnings, 2.0 times book value, and 12.5 times cash flow, which is reasonable given the improvement in corporate governance and shareholder returns.
The economic backdrop is not perfect, but it remains constructive. Japan’s May composite PMI eased to 51.1 from 52.2, still pointing to expansion. The weak yen remains a major factor. It helps exporters and companies with overseas earnings, but it also raises import costs for households and businesses, especially because Japan depends heavily on imported energy. The Bank of Japan is moving carefully, since tightening too quickly could hurt growth, while waiting too long could add pressure to the yen. For investors, Japan’s appeal continues to come from exporters, automation, industrial technology, buybacks, and corporate reform. The risk is that the trade becomes too crowded or that yen volatility starts to hurt sentiment.
Figure 6: Japan’s valuation score is outpacing the average score of the other countries in our universe.
Switzerland: Switzerland remains a high-quality market, but the signals are not as strong as investors might expect. The positive indicators are breadth and dividend yield. The weaker signals include trend, short-term momentum, fund flows, relative yield, and moving-average slope. That means Switzerland still has defensive appeal, but it is not showing broad relative strength. Valuation is also on the higher side. MSCI Switzerland trades at 18.4 times forward earnings, 4.1 times book value, and 15.3 times cash flow.
The economic picture explains both the appeal and the concern. Inflation remains low compared with most major markets, giving the Swiss National Bank more flexibility. That is helpful for domestic financial conditions. At the same time, growth signals are subdued, manufacturing remains under pressure, and the strong franc can weigh on exporters’ reported earnings. Switzerland’s market is heavily influenced by healthcare, consumer staples, industrial quality, and wealth management. Those areas can be attractive when investors want steadier earnings and global revenue exposure. The challenge is price. Investors are already paying a premium for quality, so earnings delivery matters. Switzerland can still play a useful role in a diversified regional portfolio, but it is not a cheap market.
Figure 7: ETF flows showing signs of stalling.
United Kingdom: The U.K. looks more interesting than it did for much of the past few years, but the signals are not all pointing in the same direction. Positive indicators include the moving-average signal, the pound-dollar relationship, and sentiment. Negative indicators include price momentum, valuation scorecard, and credit-spread signals. MSCI U.K. trades at 12.7 times forward earnings, 2.3 times book value, and 9.4 times cash flow, making it one of the lower-multiple developed markets in the group.
The economy is still sending mixed messages. The May composite PMI fell to 48.5 from 52.6, with services moving into contraction while manufacturing remained stronger. Inflation is still a concern, and the Bank of England has to balance slower growth against the risk that higher energy and wage costs keep prices elevated. The U.K. market offers exposure to energy, banks, defense, global consumer companies, miners, and dividend income. Those are useful building blocks in a global portfolio. The main issue is that low valuation alone is not enough. Investors need earnings to hold up, credit conditions to stay manageable, and the pound to avoid becoming a headwind.
Figure 8: Sentiment showing initial signs of optimism, which is constructive.
Emerging Market Positions
Approximately 30% of the strategy is allocated across five markets from a pool of more than 20 smaller markets. Selection is based on a multifactor technical ranking system that uses trend and mean-reversion indicators. The process seeks to identify oversold opportunities in global equity markets that are likely to mean-revert from lower levels and to exhibit mild pullbacks from long-term uptrends.
Current Holdings:
Malaysia
Brazil
Philippines
Hong Kong
Mexico
Explore: Emerging Market Commentary
Malaysia:
Malaysia currently combines potentially reasonable valuations, low inflation, and improving manufacturing momentum. MSCI Malaysia trades at 14.2 times forward earnings, 1.6 times book value, and 10.6 times cash flow, which leaves room for value investors to pay attention without requiring an aggressive growth story. The country also benefits from exposure to banks, semiconductors, utilities, energy, and domestic consumer companies.
Recent data support a more constructive view. Malaysia’s manufacturing PMI rose to 51.6 in April from 50.7, the highest reading in four years. Output improved, and companies increased inventories as they prepared for supply chain and shipping uncertainties. Some of that strength may reflect stockpiling rather than final demand, but it still shows that activity is moving in the right direction. Inflation remains low, unemployment is contained, and Bank Negara Malaysia has kept policy steady. For a short-term allocation, Malaysia offers a balanced mix of earnings stability, technology supply-chain exposure, and macro calm. The main risks are slower global trade, weaker electronics demand, and any reversal in commodity or currency trends.
Brazil:
Brazil’s market is relatively inexpensive, and the economy is showing better momentum than many expected. MSCI Brazil trades at 8.4 times forward earnings, 1.8 times book value, and 5.4 times cash flow. Those valuations are low compared with most major markets, which could create upside potential if inflation eases, rates begin to decline, or commodity-linked earnings hold up.
Recent data has been constructive. First-quarter GDP expanded 1.1% from the prior quarter, supported by household spending, investment, agriculture, and services. Manufacturing also improved, with the PMI rising to 52.6 in April from 49.0. That matters because Brazil’s equity market often responds well when growth is firm and commodities are supportive. Banks, energy, materials, utilities, and domestic financials could benefit if investors become more comfortable with the policy outlook. The main challenge remains inflation, which is still above the central bank’s target range. The Selic rate is also high, which can pressure consumers and valuations. Still, Brazil’s low multiples and improving activity make it one of the more interesting short-term emerging-market opportunities.
Philippines:
The Philippines is also supported by lower valuations, and investor expectations already appear cautious. MSCI Philippines trades at 9.2 times forward earnings, 1.5 times book value, and 8.4 times cash flow. That sets a lower bar for positive surprises, especially if inflation begins to cool or domestic demand firms up. The market offers exposure to banks, property, infrastructure, utilities, consumer spending, and remittances.
The recent data has been mixed, but that may be part of the opportunity. Manufacturing softened in April, with the PMI falling below 50, and first-quarter GDP came in below expectations. Inflation also moved higher, which complicates the policy outlook. Even so, the Philippines remains a domestic-demand market with long-term demographic support and room for infrastructure investment. The setup could improve quickly if inflation data stabilizes and the central bank gains more room to support growth. The valuation discount gives the market a potential cushion, while banks and consumer-related companies could benefit if sentiment turns. The key risks are sticky inflation, weaker household spending, and pressure on the peso.
Hong Kong:
Hong Kong looks potentially attractive as a short-term recovery and China-linked optionality trade. MSCI Hong Kong trades at 14.8 times forward earnings, 1.3 times book value, and 11.6 times cash flow. The low price-to-book ratio is especially notable because the market includes banks, insurers, property companies, exchanges, travel-linked businesses, and China-facing financial firms. If investor sentiment toward China improves, Hong Kong could be among the first markets to respond.
The economic data have not been one-sided, but there are encouraging pieces. First-quarter GDP grew 5.9% from a year earlier and 2.9% from the prior quarter, helped by exports, private consumption, tourism, and financial activity. Retail sales remained positive, and cross-border travel continues to help parts of the economy. The PMI stayed below 50, so the recovery is not yet broad, but it also leaves room for improvement if policy support in China gains traction. The Hong Kong dollar peg limits local monetary flexibility, but it also offers currency stability for investors. For a short-term allocation, Hong Kong may be appealing for portfolios seeking exposure to China's reopening, financial activity, tourism, and depressed valuations.
Mexico:
The Mexican market offers exposure to nearshoring, banks, airports, consumer companies, telecom, materials, and infrastructure. MSCI Mexico trades at 13.0 times forward earnings, 2.4 times book value, and 9.4 times cash flow. That valuation is not as low as Brazil’s, but it is still reasonable given Mexico’s strategic position in North American supply chains.
Recent data have been soft, which explains why the market has not fully rewarded the nearshoring story. First-quarter GDP contracted from the prior quarter, and manufacturing PMI stayed below 50 as new orders and export demand weakened. However, inflation has been moving in a favorable direction, giving Banxico more flexibility after an extended period of tight policy. For short-term investors, that creates a possible setup where modestly better inflation, easier policy, or firmer U.S. demand could improve sentiment. Mexico also has company-level strengths that may not require a booming economy, including airports, select banks, consumer staples, and infrastructure-related firms. The main risks are slower U.S. growth, currency volatility, and a manufacturing recovery that takes longer than expected.
Catastrophic Stop Model
The Catastrophic Stop model combines time-tested, objective indicators designed to identify high-risk periods for the equity market. The model entered June recommending a fully invested equity allocation relative to the benchmark.
The weight of the evidence suggests that any weakness is unlikely to extend into a significant downtrend at this time. Of course, if our model triggers a sell signal (below 40% for two consecutive days), indicating more substantial problems, we will raise cash immediately.
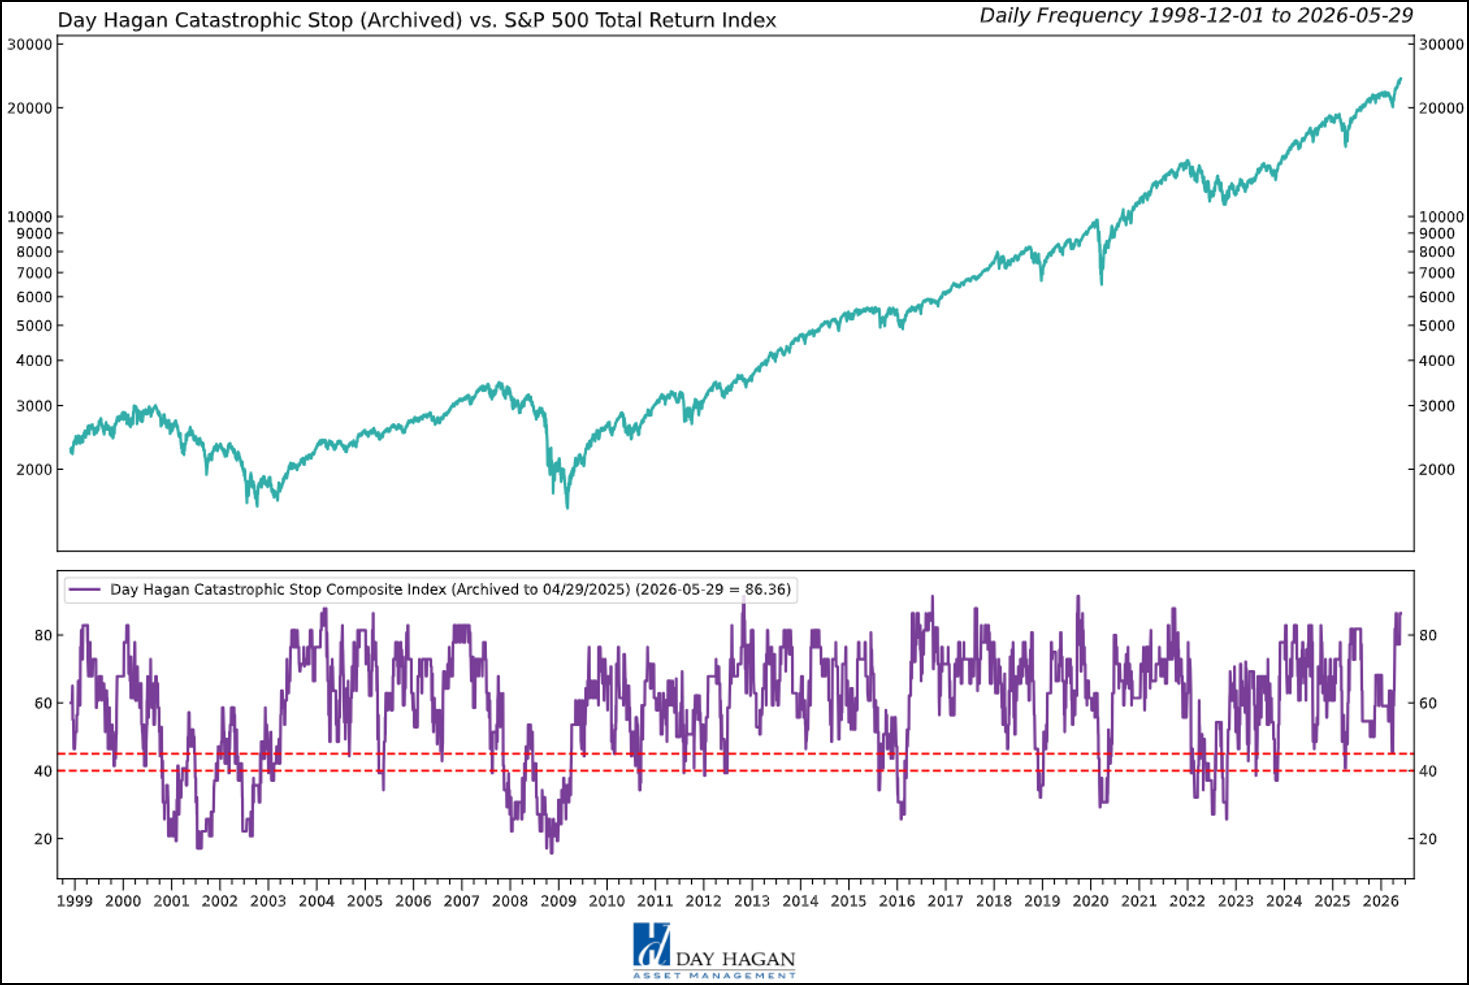
Figure 9: The Catastrophic Stop model recommends a fully invested equity position (relative to the benchmark). Because the model uses indices to extend its history, it is considered hypothetical.
Hypothetical and historical past performance is not indicative of future results. There can be no assurance that any investment or strategy will achieve its objectives or avoid substantial losses or have comparable results. This information is provided for illustrative purposes only and is not a prediction, projection, or guarantee of future performance. Hypothetical results do not reflect actual trading, were derived using the benefit of hindsight, and may not reflect material economic and market events. Actual results vary and depend on many factors and subject to risk and uncertainties.
This chart compares the S&P 500 with the Day Hagan Daily Market Sentiment Composite. The current composite reading is 89.43, well above the +70 upper bracket, indicating elevated or optimistic sentiment. Historically, readings above this level often suggest a strong risk appetite and a positive market tone, but they can also indicate the market is becoming stretched in the short term. This is not necessarily bearish by itself; rather, it suggests investors are already leaning bullish, so near-term upside may be more vulnerable to consolidation, volatility, or disappointment. The way we incorporate these types of models into our outlook is to "Go with the flow until it reaches an extreme and reverses." We're still going with the flow, but headwinds are building.
This strategy uses measures of price, valuation, economic trends, liquidity, and market sentiment to make objective, rational, and unemotional decisions about how much capital to risk and where to allocate it.
For more information, please contact us at:
Day Hagan Asset Management
1000 S. Tamiami Trl
Sarasota, FL 34236
Toll Free: (800) 594-7930
Office Phone: (941) 330-1702
Website: https://dayhagan.com or https://dhfunds.com
© 2026 Day Hagan Asset Management
This material is for educational purposes only. Further distribution is prohibited without prior permission. Please see the information on Disclosures and Fact Sheets here: https://dhfunds.com/literature. Charts with models and return information use indices for performance testing to extend the model histories, and they should be considered hypothetical. All Rights Reserved. (© Copyright 2026 Day Hagan Asset Management.)
Day Hagan Smart Sector® International ETF
Symbol: SSXU
Strategy Description
The Smart Sector® International strategy combines three quantitative investment strategies: Core International, Explore International, and Catastrophic Stop.
The Process Is Based On The Weight Of The Evidence
Core Allocation
The fund begins by overweighting and underweighting the largest non-U.S. equity markets based on proprietary models.
Each of the models utilizes market-specific, weight-of-the-evidence composites of fundamental, economic, technical, and behavioral indicators to determine each area’s probability of outperforming the ACWI, for example. U.S. Markets are weighted accordingly relative to benchmark weightings.
Explore Allocation
To select smaller markets, the fund uses a multi-factor technical ranking system to choose the top markets. The markets with the highest rankings split the non-core model allocation equally.
When Market Risks Become Extraordinarily High — Reduce Your Portfolio Risk
The model remains fully invested unless the Catastrophic model is triggered, whereupon the equity-invested position may be trimmed by up to 50%.
The Catastrophic Stop model combines time-tested, objective indicators designed to identify periods of high risk for the broad U.S. equity market. The model uses price-based, breadth, deviation from trend, fundamental, economic, interest rate, behavioral, and volatility-based indicator composites.
When Market Risks Return To Normal — Put Your Money Back To Work
When the Catastrophic Stop model moves back to bullish levels, indicating lower risk, the strategy will reverse toward being fully invested.
Disclosures
The data and analysis contained within are provided “as is” and without warranty of any kind, either express or implied. The information is based on data believed to be reliable, but it is not guaranteed. Day Hagan DISCLAIMS ANY AND ALL EXPRESS OR IMPLIED WARRANTIES, INCLUDING, BUT NOT LIMITED TO, ANY WARRANTIES OF MERCHANTABILITY, SUITABILITY, OR FITNESS FOR A PARTICULAR PURPOSE OR USE. All performance measures do not reflect tax consequences, execution, commissions, and other trading costs, and as such, investors should consult their tax advisors before making investment decisions, as well as realize that the past performance and results of the model are not a guarantee of future results. The Smart Sector® Strategy is not intended to be the primary basis for investment decisions, and the usage of the model does not address the suitability of any particular investment for any particular investor.
Using any graph, chart, formula, model, or other device to assist in deciding which securities to trade or when to trade them presents many difficulties, and their effectiveness has significant limitations, including that prior patterns may not repeat themselves continuously or on any particular occasion. In addition, market participants using such devices can impact the market in a way that changes the effectiveness of such devices. Day Hagan believes no individual graph, chart, formula, model, or other device should be used as the sole basis for any investment decision and suggests that all market participants consider differing viewpoints and use a weight-of-the-evidence approach that fits their investment needs.
Past performance does not guarantee future results. No current or prospective client should assume future performance of any specific investment or strategy will be profitable or equal to past performance levels. All investment strategies have the potential for profit or loss. Changes in investment strategies, contributions or withdrawals, and economic conditions may materially alter the performance of your portfolio. Different types of investments involve varying degrees of risk, and there can be no assurance that any specific investment or strategy will be suitable or profitable for a client’s portfolio. Historical performance results for investment indexes and/or categories generally do not reflect the deduction of transaction and/or custodial charges or the deduction of an investment management fee, the incurrence of which would have the effect of decreasing historical performance results. There can be no assurances that a portfolio will match or outperform any particular benchmark. Comparisons to indices are inherently unreliable indicators of future performance. The strategies used to generate the performance vary from those used to generate the returns depicted in the benchmarks. Investors cannot directly invest in an index.
The information contained herein is provided for informational purposes only and should not be construed as investment advice or a recommendation to buy or sell any security. The securities, instruments, or strategies described may not be suitable for all investors, and their value and income may fluctuate. Past performance is not indicative of future results, and there is no guarantee that any investment strategy will achieve its objectives, generate profits, or avoid losses.
This material is intended to provide general market commentary and should not be relied upon as individualized investment advice. Investors should consult with their financial professional before making any investment decisions based on this information.
The material may contain “forward-looking” information that is not purely historical in nature. Such information may include, among other things, projections, forecasts, estimates of market returns, and proposed or expected portfolio composition. Day Hagan Asset Management, its affiliates, employees, or third-party data providers shall not be liable for any loss sustained by any person relying on this information. All opinions and views expressed are subject to change without notice and may differ from those of other investment professionals within Day Hagan Asset Management or Ashton Thomas Private Wealth, LLC.
Accounts managed by Day Hagan Asset Management or its affiliates may hold positions in the securities discussed and may trade such securities without notice.
Day Hagan Asset Management is a division of and doing business as (DBA) Ashton Thomas Private Wealth, LLC, an SEC-registered investment adviser. Registration with the SEC does not imply a certain level of skill or training.
This material is for educational purposes only. Further distribution is prohibited without prior permission. Please see the information on Disclosures and Fact Sheets here: https://dhfunds.com/literature. Charts with models and return information use indices for performance testing to extend the model histories, and they should be considered hypothetical. All Rights Reserved. (© Copyright 2026 Day Hagan Asset Management.)
All hypothetical results are presented for illustrative purposes only. Back-testing and other statistical analysis is provided in use simulated analysis and hypothetical circumstances to estimate how it may have performed prior to its actual existence. The results obtained from "back-testing" information should not be considered indicative of the actual results that might be obtained from an investment or participation in a financial instrument or transaction referencing the Index. The Firm provides no assurance or guarantee that the products/securities linked to the strategy will operate or would have operated in the past in a manner consistent with these materials. The hypothetical historical levels have inherent limitations. Alternative simulations, techniques, modeling or assumptions might produce significantly different results and prove to be more appropriate. Actual results will vary, perhaps materially, from the simulated returns presented.
© 2026 Day Hagan Asset Management
Definitions:
S&P/ASX 200 – Designed to measure the performance of the 200 largest index-eligible stocks listed on the Australian Securities Exchange by float-adjusted market capitalization.
PMI — A survey-based economic indicator that measures business activity in sectors such as manufacturing and services; readings above 50 generally indicate expansion, while readings below 50 indicate contraction.
CPI — A measure of inflation that tracks changes in the prices consumers pay for goods and services over time.
Core Inflation — Inflation excluding more volatile items, typically food and energy, used to gauge underlying price trends.
Federal Reserve (Fed) — The central bank of the United States, responsible for monetary policy, interest rates, and financial stability.
ECB — The European Central Bank, responsible for setting monetary policy for countries that use the euro.
Bank of Japan (BoJ) — Japan’s central bank, responsible for monetary policy, interest rates, and financial conditions in Japan.
Bank of Canada (BoC) — Canada’s central bank, responsible for setting policy rates and managing inflation and economic stability.
Bank of England (BoE) — The United Kingdom’s central bank, responsible for monetary policy and financial stability.
SNB — The Swiss National Bank, responsible for monetary policy and maintaining price stability in Switzerland.
PBoC — The People’s Bank of China, which manages monetary policy, liquidity, and key lending benchmarks in China.
S&P 500 — A major U.S. stock market index tracking 500 large publicly traded U.S. companies; widely used as a benchmark for the U.S. equity market.
DJIA — The Dow Jones Industrial Average, a price-weighted stock index of 30 large U.S. companies, often used as a headline indicator of the U.S. stock market.
Nasdaq Composite — A stock market index composed largely of companies listed on the Nasdaq exchange, with especially heavy representation from technology and growth stocks.
STOXX 600 — A broad European stock index that tracks 600 large, mid, and small companies across Europe.
Nikkei 225 — A major Japanese stock market index tracking 225 prominent Japanese companies.
TSX — Canada’s main stock market benchmark, often referring to the S&P/TSX Composite Index.
CAC 40 — France’s main stock market index, tracking 40 major French companies.
DAX — Germany’s main stock market index, tracking major German listed companies.
FTSE 100 — The leading U.K. stock market index, tracking 100 large companies listed in London.
Shanghai Composite — A major Chinese stock index tracking stocks listed on the Shanghai Stock Exchange.
Shenzhen Component — A major Chinese stock index tracking companies listed on the Shenzhen Stock Exchange.
ACWI ex-U.S. Index — The MSCI All Country World Index excluding the United States; a benchmark for developed and emerging equity markets outside the U.S.
10-Year Yield — The interest rate paid on a 10-year government bond; a key benchmark for long-term borrowing costs and valuation.
Bund Yield — The yield on German government bonds, often used as a benchmark for euro-area sovereign debt.
Gilt Yield — The yield on U.K. government bonds, commonly called gilts.
OAT Yield — The yield on French government bonds.
Policy Rate — The benchmark interest rate set by a central bank to influence borrowing costs, inflation, and economic activity.
Basis Point (bp) — One one-hundredth of a percentage point; 25 basis points equals 0.25%.
Relative Strength — A measure of how a market, sector, or asset performs compared with another market or benchmark.
Overweight / Underweight / Neutral — Portfolio positioning terms: overweight means above benchmark allocation, underweight means below benchmark allocation, and neutral means roughly in line with the benchmark.