
Day Hagan/Ned Davis Research Smart Sector® International Strategy Update February 2023
A downloadable PDF copy of the Article:
Day Hagan/Ned Davis Research Smart Sector® International Strategy Update February 2023 (pdf)
Catastrophic Stop Update
The NDR Catastrophic Sell Stop model combines time-tested, objective indicators designed to identify high risk periods for the equity market. The model (Figure 1, chart at right) remains with a fully invested equity allocation recommendation, as the composite score improved toward month-end.

Figure 1: Smart Sector Catastrophic Stop Sell Model image.
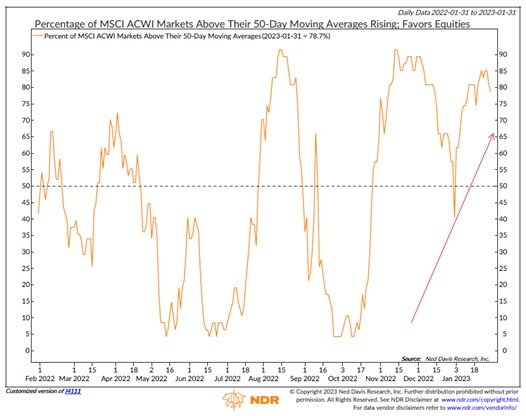
Figure 2: Percentage of MSCI ACWI Markets Above Their 50-Day Moving Averages Rising: Favors Equities
Stronger breadth measures drove the model improvement. The percentage of global equity markets above their 50-day moving average rose to 85%, well above the 50% positive threshold for the model (Figure 2, chart at left). In terms of external influences, high yield and Emerging Market bond breadth improved, which was offset by extremely optimistic, short-term stock market sentiment.
If the relative strength of stocks vs. bonds, stock volume demand outpaces supply, and global shipping rates improve, then it could indicate the rally could be sustained. Conversely, if the stock market weakens in the near-term and investors return to fears of a recession, the stock market rally could be short-lived.
Global Market Update
The ACWI ex. U.S. Total Return Index soared by more than 800 basis points in January. November (up 11%) and January produced the strongest monthly returns for the index since 2020. Among the strongest performing markets were Czech Republic, Mexico, Netherlands, Ireland, and Italy, while the largest underperformers included Turkey, the United Arab Emirates, India, Egypt, and Norway.
The global economy ended 2022 on a weak note, according to the latest global S&P Global Purchasing Managers’ Index (PMI). The global composite PMI was little changed in December, edging up 0.2 points to 48.2. This marked the fifth straight month of contraction and the second-lowest reading since the initial COVID lockdowns in 2020. Both the services and manufacturing sectors registered declines in tandem for the fourth straight month, a condition also last observed in early 2020. The latest level in the composite is historically consistent with a 0.4% contraction in global real Gross Domestic Product (GDP) growth.
The near-term economic outlook is murky. Although global output contracted at a slightly slower pace, overall new orders shrank at the fastest pace since May 2020. Moreover, history suggests that the past year’s tight monetary policy will continue to negatively impact the global economy for at least the next six months. The future output index (gauges expectations over the next year) improved, but it remained at historically low levels, suggesting some caution about the outlook.
However, there may be some tentative signs of stabilization ahead. The global bullwhip, a measure of new orders relative to inventories, ticked up for a second straight month, as businesses continued to pare back the massive inventory accumulated in late 2021/early 2022 (Figure 3, chart at bottom). Also, global supply chain pressures continued to ease, with the supplier delivery index rising to its highest level since January 2020.
Entering February, the non-U.S. equity Core model overweighted China, Germany, Australia, and France, while underweighting Japan, the U.K., and Canada. The Explore model favored Mexico, Netherlands, and Thailand.
Figure 3: Global PMI vs. Central Bank Breadth
Core Allocations
China’s allocation remains above benchmark weighting. The persistence of China’s zero-COVID policy was greatly to blame for last year’s economic slowdown. Consistent lockdowns, testing, and quarantines had seen consumer confidence slump to a record low, retail sales plunge, and passenger mobility fall to a fraction of its pre-COVID level. Once China’s economy fully reopens, there may be a sharp pick-up in economic activity, particularly coming from the consumer. Among the 47 All Country World Index components, the China index has been the strongest performer, up over 50% since October. Technical indicators (internals) such as trend and price momentum reflect China’s recent strength. Emerging Market high yield credit spreads have been narrowing (Figure 4, chart at right), indicating reduced risks.

Figure 4: Emerging Markets High Yield Credit Spreads are Narrowing: Reflects Reducing Risks

Figure 5: France Markit Manufacturing Purchasing Managers’ Index (PMI)
France’s allocation continues to be above benchmark weighting. The case for eurozone recession remains intact, but it is likely to be mild. A fall in energy prices, due in part to warmer-than-normal weather, fiscal subsidies, and still-high savings and job retention have cushioned the economy. The economy could come out of its downturn as early as the second quarter, in tandem with the Chinese economic recovery. In fact, France’s manufacturing PMI crossed into expansionary territory this month (Figure 5, chart at left) as it has risen from its lows over the last quarter. Earnings growth remains positive on a year-over-year basis. The trend has improved as the market trades above its 50- and 200-day moving averages.
Japan continues to be significantly below benchmark allocation. Weak trend, breadth (Figure 6, chart at right), and momentum indicators reflect challenged near-term earnings growth, unattractive valuations, and economic activity softening as evidenced by falling inflation swaps. The Bank of Japan is forecasting inflation will fall back below its target by March 2024. Until that changes, traders expecting imminent policy normalization may be disappointed.

Figure 6: Japan 50-Day Net New Highs/Lows Continues to Deteriorate: Bearish for the Region.

Figure 7: U.K. Equity Risk Premium (ERP) Reversing Lower from an Extreme: Bearish for the Region.
The U.K. fell further below benchmark allocation. Relative to other regions, the U.K. has worsening leading economic indicators, optimistic sentiment, and a flattening yield curve. In the summer of 2021, more than 80% of U.K. companies had positive analyst earnings revisions. That number is now less than 55%. The market’s equity risk premium is showing less of an opportunity (Figure 7, chart at left). The spread between the U.K.’s earnings yield and 10-year yield is rolling over from an elevated level.
Explore Opportunities
Among the top-ranked Explore markets are Mexico, Netherlands, and Thailand:
Mexico, Netherlands, and Thailand have favorable price trends as their 50-day moving averages trade above their 200-day moving averages.
Over the last 21 days, Thailand is more than two standard deviations oversold, which historically has provided a near-term bounce opportunity.
Mexico has a low market capitalization-to-GDP ratio, which typically indicates a favorable valuation.
Thailand and Mexico’s cyclically adjusted price-to-earnings ratios (long-term valuation metrics) are trading below their historical medians.
Mexico is one of the few economies with a Composite Leading Indicator reading in expansionary territory.
Thailand has an elevated manufacturing PMI and it is in the expansionary zone (Figure 8, chart at bottom).
Additionally, once China’s economy fully reopens, tourism will likely surge to markets such as Thailand, providing an additional economic boost.
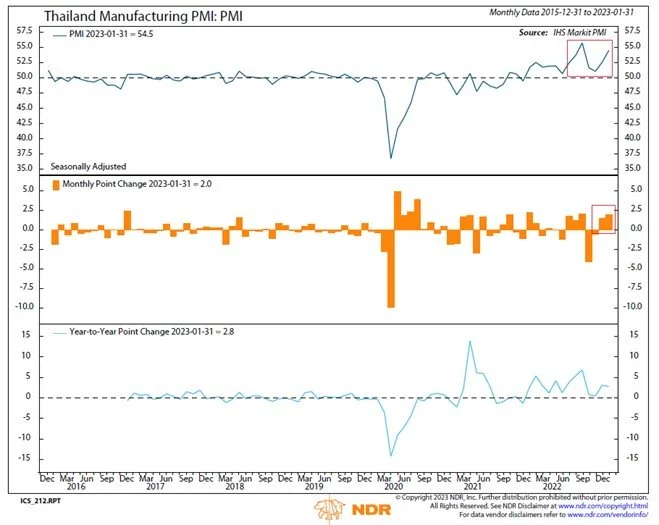
Figure 8: Thailand Manufacturing PMI: PMI
Summary
At the start of January, the Catastrophic Stop model recommended a fully invested position according to the Core and Explore international allocation models. The Core model overweighted China, Germany, Australia, and France, while underweighting Japan, the U.K., and Canada. The Explore model favored Mexico, Netherlands, and Thailand. The international models combine macro, fundamental, technical, and sentiment indicators to determine opportunities and identify risks in an objective, weight-of-the-evidence approach.
NDR Strategists contributing to this publication: Brian Sanborn, CFA, Ed Clissold, CFA, Rob Anderson, CFA, Thanh Nguyen, CFA, Tim Hayes, CMT, Joe Kalish
For more information, please contact:
Day Hagan Asset Management
1000 S. Tamiami Trl
Sarasota, FL 34236
Toll-Free: (800) 594-7930
Office Phone: (941) 330-1702
Day Hagan/Ned Davis Research
Smart Sector® International ETF
Symbol: SSXU
Strategy Description
The Smart Sector® International strategy combines three Ned Davis Research quantitative investment strategies: The Core International, Explore International, and the NDR Catastrophic Stop
The Process Is Based On The Weight Of The Evidence
Core Allocation
The fund begins by overweighting and underweighting the largest non-U.S. equity markets based on Ned Davis Research’s proprietary models.
Each of the models utilizes market-specific, weight-of-the-evidence composites of fundamental, economic, technical, and behavioral indicators to determine each area’s probability of outperforming the ACWI ex. U.S. Markets are weighted accordingly relative to benchmark weightings.
Explore Allocation
To select smaller markets, the fund uses a multi-factor technical ranking system to choose the top markets. The markets with the highest rankings split the non-Core model allocation equally.
When Market Risks Become Extraordinarily High — Reduce Your Portfolio Risk
The model remains fully invested unless the Ned Davis Research Catastrophic Sell Stop (CSS) model is triggered, whereupon the equity-invested position is trimmed to 50%.
The NDR Catastrophic Sell Stop model combines time-tested, objective indicators designed to identify periods of high risk for the global equity market. The model uses price-based, breadth, deviation from trend, fundamental, economic, interest rate, behavioral, and volatility-based indicator composites.
When Market Risks Return To Normal — Put Your Money Back To Work
When the NDR CSS model moves back to bullish levels, indicating lower risk, the strategy immediately moves back to fully invested.
Ned Davis Research Disclaimers
The data and analysis contained within are provided "as is" and without warranty of any kind, either express or implied. The information is based on data believed to be reliable, but it is not guaranteed. NDR DISCLAIMS ANY AND ALL EXPRESS OR IMPLIED WARRANTIES, INCLUDING, BUT NOT LIMITED TO, ANY WARRANTIES OF MERCHANTABILITY, SUITABILITY OR FITNESS FOR A PARTICULAR PURPOSE OR USE. All performance measures do not reflect tax consequences, execution, commissions, and other trading costs, and as such investors should consult their tax advisors before making investment decisions, as well as realize that the past performance and results of the model are not a guarantee of future results. The Smart Sector® Strategy is not intended to be the primary basis for investment decisions and the usage of the model does not address the suitability of any particular in investment for any particular investor.
Using any graph, chart, formula, model, or other device to assist in deciding which securities to trade or when to trade them presents many difficulties and their effectiveness has significant limitations, including that prior patterns may not repeat themselves continuously or on any particular occasion. In addition, market participants using such devices can impact the market in a way that changes the effectiveness of such devices. NDR believes no individual graph, chart, formula, model, or other device should be used as the sole basis for any investment decision and suggests that all market participants consider differing viewpoints and use a weight of the evidence approach that fits their investment needs.
Disclosures
Past performance does not guarantee future results. No current or prospective client should assume future performance of any specific investment or strategy will be profitable or equal to past performance levels. All investment strategies have the potential for profit or loss. Changes in investment strategies, contributions or withdrawals and economic conditions may materially alter the performance of your portfolio. Different types of investments involve varying degrees of risk, and there can be no assurance that any specific investment or strategy will be suitable or profitable for a client’s portfolio. Historical performance results for investment indexes and/or categories generally do not reflect the deduction of transaction and/or custodial charges or the deduction of an investment management fee, the incurrence of which would have the effect of decreasing historical performance results. There can be no assurances that a portfolio will match or outperform any particular benchmark.
Day Hagan Asset Management is registered as an investment adviser with the United States Securities and Exchange Commission. SEC registration does not constitute an endorsement of the firm by the Commission nor does it indicate that the adviser has attained a particular level of skill or ability.
References to “NDR” throughout refer to Ned Davis Research, Inc. Clients engaging in this strategy will be advised by Day Hagan and will not have a contractual relationship with NDR. Day Hagan purchases signals from NDR, and Day Hagan is responsible for executing transactions on behalf of its clients and has discretion in how to implement the strategy.
NDR is a registered as an investment adviser with the Securities and Exchange Commission (SEC). NDR serves as the Signal Provider in connection with this strategy. The information provided here has not been approved or verified by the SEC or by any state or other authority. Additional information about NDR also is available on the SEC's website at https://www.adviserinfo.sec.gov/. This material is provided for informational purposes only and is not intended as an offer or solicitation with respect to the purchase or sale of any security or other financial instrument or to participate in any trading strategy. NDR’s strategies, including the model discussed in this publication, are intended to be used only by sophisticated investment professionals.
There may be a potential tax implication with a rebalancing strategy. Re-balancing involves selling some positions and buying others, and this activity results in realized gains and losses for the positions that are sold. The performance calculations do not reflect the impact that paying taxes would have, and for taxable accounts, any taxable gains would reduce the performance on an after-tax basis. This reduction could be material to the overall performance of an actual trading account. NDR does not provide legal, tax or accounting advice. Please consult your tax advisor in connection with this material, before implementing such a strategy, and prior to any withdrawals that you make from your portfolio.
There is no guarantee that any investment strategy will achieve its objectives, generate dividends or avoid losses.
© 2023 Ned Davis Research, Inc. | © 2023 Day Hagan Asset Management, LLC
© Copyright Ned Davis Research, Inc. All Rights Reserved | These materials are historical and intended to be used only as examples, and do not necessarily reflect current views or advice of NDR or its representatives.
