
Day Hagan Catastrophic Stop Update October 17, 2025
The Day Hagan Catastrophic Stop model closed at 50% on Friday. The model continues to indicate that investors should maintain their benchmark equity exposure.
Figure 1: The Catastrophic Stop model would generate a sell signal by closing below 40% for two consecutive days.
The markets are now trying to digest 1) “Massive Tariffs on China” (President Trump’s term) of “100%” due to China’s new rare-earth mineral export restrictions, 2) a government shutdown (reducing the availability of economic data), and 3) potential uncertainty around upcoming Q3 earnings reports. (Not to mention the impacts to the Japanese carry trade, geopolitical risks, etc.)
While it seems like the markets have a lot to deal with, and we’re definitely on our toes trying to peer through the crosscurrents, we reiterate our view that U.S. economic data remains constructive, inflation pressures are likely to trend lower, the Fed is more dovish than hawkish, global central banks are generally leaning dovish, global financial liquidity is positive, and U.S. corporate earnings are expected to continue to grow at a double-digit pace into 2026 (charts below).
Not to bury the lead, but if the equity markets do retrace significantly, absent an economic shock or massive negative earnings revisions, given the current data, it would likely be a buying opportunity. We’ll be monitoring our models for signs of selling exhaustion, oversold extremes, and excessive pessimism to identify potential turning points. As long as corporate earnings and guidance hold up, we will likely maintain this view.
In light of the turbulence, it’s helpful to revisit the events of March–April 2025 for context. History often provides a useful perspective. Below are several key takeaways from that period.
Summary of the points (TL;DR): In March–April 2025, markets fell sharply as U.S. “Liberation Day” tariffs ignited global stagflation fears. The S&P 500 lost nearly 20% (intraday), Treasuries sold off, and the Tech sector led declines. Inflation stayed elevated, delaying Fed rate-cut hopes. Growth forecasts were trimmed, volatility spiked, and defensive sectors briefly outperformed before a partial rebound. It took 90 trading days (129 calendar days) from the February 19th peak for the S&P 500 to regain new highs.
Details:
The slide began in March when markets initially entered correction territory (S&P 500 down ~10% from its February 19th peak) amid rising concerns about aggressive U.S. trade policy and weakening growth signals.
A key trigger was the “Liberation Day” tariffs announced on April 2, 2025, under which a 10% baseline tariff on most imports (and much higher reciprocal tariffs on specific countries) was imposed, spooking investors with fears of global retaliation and economic stagflation.
In response to the tariff shock, global markets plunged in a two-day crash: the S&P 500 lost ~4.8% on April 3 and ~6% on April 4; the Dow and Nasdaq also saw historic drops.
The Tech sector led losses (supply-chain/China exposure, duration sensitivity). Staples held up best on the worst day as investors rotated into defensive stocks.
Investors also poured out of bonds during the turmoil, pushing Treasury yields sharply higher (10-year yields spiked toward ~4.5%) as confidence in U.S. debt holdings faltered and inflation risk surged. It was one of the biggest weekly jumps in a decade, and the curve steepened sharply.
The policy and market shock compounded already fragile macro sentiment: growth expectations were being scaled back globally, and uncertainty over U.S. fiscal policy and trade regimes was elevated.
Inflation was a core concern heading into the decline. In March, median household one-year inflation expectations rose to ~3.6%. Core inflation (excluding volatile items) in mid-2025 was still running above levels consistent with the Fed’s target (e.g., median 12-month core inflation ~3.5%).
The tariff shock added a new inflationary impulse, making central bankers more wary of easing prematurely; Fed Chair Powell warned that tariffs could delay the return to 2% inflation and rebuffed pressure for immediate rate cuts.
In Fed communications and forecasts around that period, the Fed cut its 2025 growth outlook (e.g., from ~2.1% to ~1.7%) and flagged the possibility of two rate cuts later in the year, though emphasized a data-dependent stance.
Market participants had been anticipating rate cuts in 2025, but the downturn and inflation jitters pushed back expectations. Some strategists scaled back the count of cuts, and the Fed minutes in May showed tension between growth risks and inflation control. As the month ended, officials signaled “hold for longer,” watching inflation and labor, while traders still penciled in the first cut around June (later pushed back).
The VIX jumped; fears of foreign retaliation (EU/China) and a stronger dollar initially pressured risk assets broadly.
Through late April, tech snapped back on earnings and yields cooled from the peak, but stayed elevated vs. early-March levels.
Figure 2: It took 90 trading days to recover from the last tariff shock.
The net takeaway is that despite ongoing worries about economic growth, inflation, elevated interest rates, valuations, supply-chain strains, and rising geopolitical tensions, investors ultimately looked beyond the potential tariff disruptions—refocusing on resilient corporate earnings and rekindling their enthusiasm for artificial intelligence.
Below are several shorter-term charts where one can analyze market conditions during the March/April decline vs. now (based on Friday’s close).
Figure 3: Short-term equity moves are highly dependent on systematic, algorithmic, risk parity, and ODTE (zero days to expiration options) investors. Increases in volatility can lead to these segments selling stocks (relative to volatility). However, the subsequent reversals have historically been quick. Unless the fundamental backdrop changes, vol indicators like the ones below can be used to identify buy opportunities.
Figure 4: The MOVE Index (Merrill Lynch Option Volatility Estimate) measures expected volatility in U.S. Treasury markets, reflecting investor uncertainty about interest rates and bond market risk. It moves inversely to equity prices. This needs to hold.
Figure 5: One differentiator between Liberation Day and now could be the rate backdrop. If rates hold lower, it will help support our view that investors are likely looking past the recent tariff upheaval.
Figure 6: We’re watching A/D lines, new highs/new lows, and percentage of stocks above various moving averages to identify potential washout points. As you can see, in April, the number of S&P 500 stocks above their respective 50-day MAs got as low as 5%. If that were to occur, it would be a strong short-term oversold signal.
Figure 7: The S&P 500’s 10-day rate of change (using a 5-month z-score) is another way of measuring OBOS. This indicator is getting close to significantly oversold levels.
Figure 8: The previous five charts provide shorter-term views. The chart below shows 52-week new highs minus new lows (smoothed by 5 periods). It identifies secular oversold conditions. Note the signal near the April lows. If that were to occur again, we would likely view it very positively (again, with the caveat that the fundamentals hold up reasonably well).
Figure 9: The Day Hagan Daily Market Sentiment Index is neutral. However, a move below 30 and a reversal back above that level would generate a buy signal.
Figure 10: Positioning indicators and composites remain elevated, but as shown by the vol-targeting equity allocation chart below, some of the froth has already been worked off. You can see where positioning was at the 2020, 2022, 2024, and 2025 lows. These charts are very helpful in identifying the level of potential demand.
Figure 11: We can’t help but wonder if this pullback is creating a better opportunity for a year-end rally. Will President Trump soften the rhetoric? It didn’t take long, or much in the way of finding common ground, for the equity market to regain its uptrend last time.
Figure 12: U.S. economic activity is constructive for equities. The Atlanta Fed’s GDPNow model estimates Q3 GDP to be 3.8%. That’s probably high, but it does indicate that activity is positive. To date, the Citigroup Economic Surprise Index (not shown) is also in positive territory, indicating that U.S. economic releases have been beating estimates, on average, over the last three months.
Figure 13: Global liquidity, based on M2 Money Supply, remains positive.
Figure 14: Based on the 5-year breakeven inflation rate, inflation pressures are diminishing.
Figure 15: With regard to earnings, FactSet reports that the “S&P 500 will likely report earnings growth above 13% for Q3.” For calendar year 2026, “analysts are projecting earnings growth of 13.8% and revenue growth of 6.6%.” If these forecasts hold up, it’s a bullish underpinning for equities.
Figure 16: Earnings revisions, to date, are positive and supportive.
Upcoming Economic Releases:
Monday is a bank holiday, so that’s going to create more uncertainty.
Powell speaks on Tuesday (given market conditions, I would expect a more dovish tone), and NFIB data will be released.
Beige Book on Wednesday.
Possibly the PPI, Retail Sales, and Initial Unemployment Claims on Thursday.
Friday, possibly Housing data and TIC data.
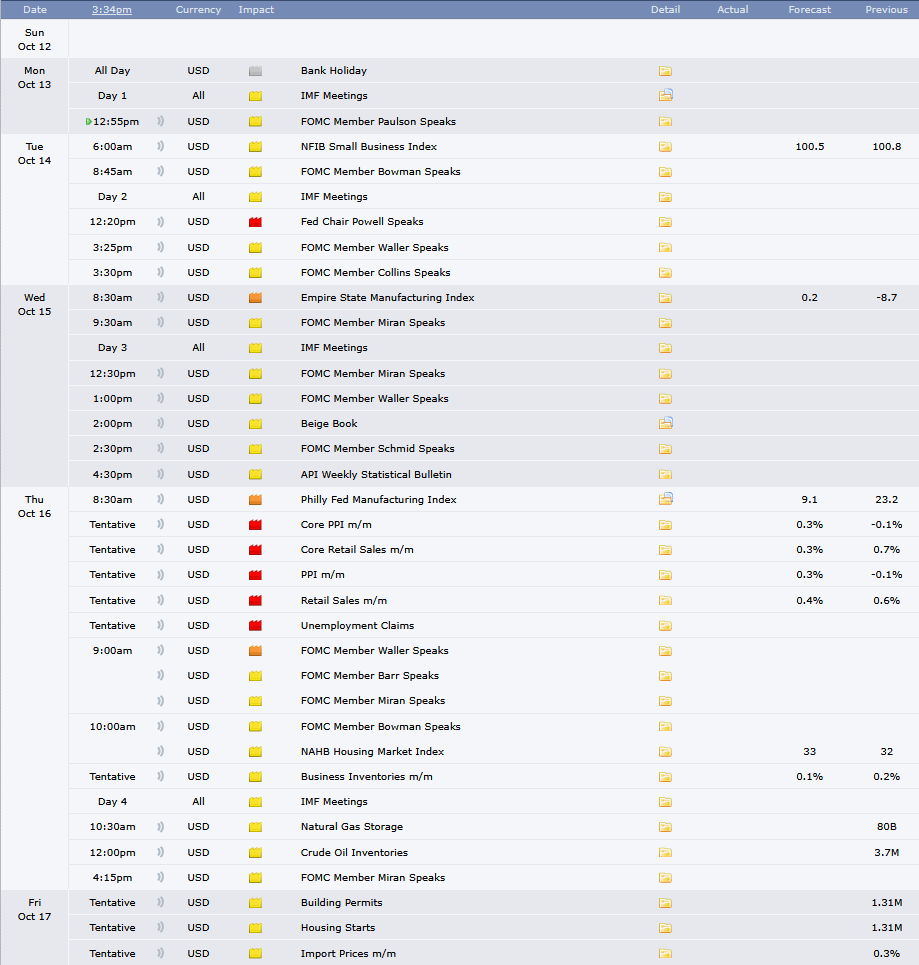
Figure 17: Economic Calendar for the week
Bottom Line: Global markets are facing renewed volatility due to the possibility of “Trade War 2.0.” The tariffs may threaten key U.S. tech and manufacturing supply chains, with sectors from semiconductors to autos bracing for disruption. Investors are now watching for a possible Trump-Xi meeting, while earnings and data will dominate the week. Major banks will report results, offering insight into loan demand, credit quality, and economic momentum, while the potential release of PPI and retail sales tests inflation and consumer resilience amid higher import costs. Fed Chair Powell’s Tuesday speech may shape expectations on policy risks from tariffs and the shutdown. Tech and healthcare earnings will further gauge economic and geopolitical stress.
While we expected near-term consolidation, we didn’t expect the magnitude of the tariff salvo. As long as economic activity holds up and, more importantly, corporate earnings continue to grow, we aren’t expecting a big bear market.
For more details on each sector and current model levels, please visit our research page at https://dayhagan.com/research.
This strategy utilizes measures of price, valuation, economic trends, monetary liquidity, and market sentiment to make objective, rational, and unemotional decisions about how much capital to place at risk and where to allocate that capital.
If you would like to discuss any of the above or our approach to investing in more detail, please don’t hesitate to schedule a call or webinar. Please call Tyler Hagan at 941-330-1702 to arrange a time that is convenient for you.
I hope you have a wonderful week,
Sincerely,
Donald L. Hagan, CFA
Chief Investment Strategist, Partner, Co-Founder
This material is for educational purposes only. Further distribution is prohibited without prior permission. Please see the information on Disclosures and Fact Sheets here: https://dhfunds.com/literature. Charts with models and return information use indices for performance testing to extend the model histories, and they should be considered hypothetical. All Rights Reserved. © Copyright 2025 Day Hagan Asset Management. Data sources: Day Hagan Asset Management, 3Fourteen Research, J.P. Morgan, Goldman Sachs, Barchart, StreetStats, Atlanta Fed, St. Louis Fed, Koyfin, Yardeni, MarketEar, S&P Global, SPDR, FactSet.
Disclosures
S&P 500 Index – An unmanaged composite of 500 large capitalization companies. This index is widely used by professional investors as a performance benchmark for large-cap stocks.
S&P 500 Total Return Index – An unmanaged composite of 500 large capitalization companies. This index is widely used by professional investors as a performance benchmark for large-cap stocks. This index assumes reinvestment of dividends.
Sentiment – Market sentiment is the current attitude of investors overall regarding a company, a sector, or the financial market as a whole.
Important Disclosures:
The information contained herein is provided for informational purposes only and should not be construed as investment advice or a recommendation to buy or sell any security. The securities, instruments, or strategies described may not be suitable for all investors, and their value and income may fluctuate. Past performance is not indicative of future results, and there is no guarantee that any investment strategy will achieve its objectives, generate profits, or avoid losses.
This material is intended to provide general market commentary and should not be relied upon as individualized investment advice. Investors should consult with their financial professional before making any investment decisions based on this information.
Data and analysis are provided “as is” without warranty of any kind, either express or implied. Day Hagan Asset Management, its affiliates, employees, or third-party data providers shall not be liable for any loss sustained by any person relying on this information. All opinions and views expressed are subject to change without notice and may differ from those of other investment professionals within Day Hagan Asset Management or Ashton Thomas Private Wealth, LLC.
Accounts managed by Day Hagan Asset Management or its affiliates may hold positions in the securities discussed and may trade such securities without notice.
Day Hagan Asset Management is a division of and doing business as (DBA) Ashton Thomas Private Wealth, LLC, an SEC-registered investment adviser. Registration with the SEC does not imply a certain level of skill or training.
For more information, please contact us at:
Day Hagan Asset Management
1000 S. Tamiami Trail, Sarasota, FL 34236
Toll-Free: (800) 594-7930
Office Phone: (941) 330-1702
Websites: https://dayhagan.com or https://dhfunds.com
© 2025 Day Hagan Asset Management