
A downloadable PDF copy of the Article:
Summary
We remain invested, with a selective approach and clear risk controls. Strong earnings and broader participation beyond technology support equities, while relatively contained credit spreads suggest the recent decline remains orderly. Inflation, elevated borrowing costs, and the cash demands of AI spending warrant caution. Our Catastrophic Stop Model remains above its sell threshold. If it falls below 40% for two consecutive days, we will reduce stock exposure and increase cash. This week’s elections and employment data will help assess policy uncertainty and the durability of economic growth.
Our Catastrophic Stop Model continues to support staying invested in stocks. Its October 30 reading of 54.55% remains above the level that would trigger a reduction in equity exposure. The model monitors conditions associated with major market declines and helps guide our risk decisions. Market pullbacks remain possible, so we continue to watch for deterioration. Our plan is clear: if the model falls below 40% for two consecutive days, we will reduce stock exposure and increase cash to potentially limit the impact of a more serious downturn.
Figure 1: The model remains constructive, although its margin of safety is still narrow. A reading below 40% for two consecutive days would trigger a sell signal and call for reduced equity exposure or higher cash levels.
Note: Hypothetical and historical past performance is not indicative of future results. There can be no assurance that any investment or strategy will achieve its objectives or avoid substantial losses or have comparable results. This information is provided for illustrative purposes only and is not a prediction, projection or guarantee of future performance. Hypothetical results do not reflect actual trading, were derived using the benefit of hindsight, and may not reflect material economic and market events. Actual results vary and depend on many factors and subject to risk and uncertainties.
Shipping momentum continued to weaken last week, signaling caution. The Baltic Dry Index measures rates for transporting commodities such as iron ore, coal, and grain. Its short-term trend has slipped below its longer-term average as cargo demand trails available shipping capacity. War-related insurance costs and disruptions complicate the picture, but do not establish that this signal is misleading. We are monitoring it alongside market breadth and other economic indicators for confirmation of broader weakness.
Figure 2: Shipping momentum has weakened. This is a caution flag.
Buying pressure barely exceeds selling pressure across the Russell 3000, leaving stocks with less support beneath the surface. The indicator’s decline toward zero signals weakening demand, even as the S&P 500 remains near its highs. This warrants closer monitoring. A sustained move below zero would indicate that selling pressure has gained control.
Figure 3: Equity breadth statistics are mixed, oscillating around the 0% threshold.
Sentiment has dropped to 20.93, below the chart’s lower threshold of 30, signaling pronounced pessimism even as the S&P 500 remains near its highs. From a contrarian perspective, this can be encouraging because expectations are subdued. However, pessimism alone does not confirm a market bottom or guarantee that stocks will rebound.
Figure 4: Sentiment remains pessimistic.
Market participation is improving. About 46% of Russell 3000 stocks now trade above their 50-day moving averages, recovering above the chart’s 45% threshold. However, more than half remain below that trend measure. The rebound is encouraging, but broader participation is needed to strengthen confidence in the S&P 500’s advance near recent highs.
Figure 5: Breadth improving into other sectors outside of tech.
High-yield bond breadth has recovered to 1.19, moving above zero and away from the −10 warning threshold. This suggests selling pressure has eased, providing modest support for stocks. However, the reading remains close to neutral. Sustained improvement would strengthen confidence that the recent weakness in riskier bonds is fading rather than temporarily pausing.
Figure 6: High-yield breadth improving as yields retreat
Credit spreads have widened modestly but remain below their historical averages, supporting the view that the recent stock decline is orderly. Corporate bond markets show limited signs of financial stress or sharply rising default concerns. However, relatively narrow spreads offer investors less compensation for credit risk and limited protection against further deterioration.
Figure 7: U.S. Credit spreads (OAS) still relatively tight.
The scorecard’s 4.33 out of 10 reading points to a challenging market that still offers opportunities. Strong earnings growth, lower Treasury yields, and broader stock participation provide support. However, inflation, weak consumer purchasing power, heavy government borrowing, and questions about returns on AI spending limit confidence. The message is to remain invested selectively, favor companies delivering earnings and cash flow, and maintain disciplined risk controls. Improving participation is encouraging, but the overall backdrop warrants measured expectations.
Figure 8: The Scorecard’s message is stay invested while containing excess risk.
Portfolio Outlook
Leadership is broadening beyond technology. Energy, health care, consumer staples, financials, and materials trade above both their 50-day and 200-day averages, while technology and communication services show weaker momentum. The SPY remains below its 50-day average but above its 200-day, suggesting a near-term correction within a still-positive longer-term trend.
Figure 9: S&P 500 Sector Fundamentals and Technicals. Technical shading: green = strong; yellow = neutral/mixed; red = weak. ChartExchange daily closes and FactSet. YTD exclude distributions. MA = simple average. RSI uses Wilder smoothing.
Sector Weekly Update:
For the week ended Friday, October 30, 2026, the S&P 500 declined 0.57%, the Nasdaq Composite fell 2.00%, and the Dow lost 0.85%. The index declines concealed broader participation. Nine of the eleven sector ETFs advanced, led by Health Care, Materials, and Utilities. Communication Services and Information Technology were the only decliners. We view this combination as evidence of investors becoming more selective, with opportunities extending beyond the companies that dominate the major indexes.
Third-quarter earnings remain supportive, but strong growth is not automatically translating into large earnings surprises. FactSet’s October 30 update showed blended S&P 500 earnings growth of 30.2%, with 60% of companies reporting. Although 82% exceeded earnings estimates, aggregate earnings were only 1.9% above expectations, compared with a five-year average of 7.5%. All eleven sectors were reporting earnings growth. With another 140 companies scheduled to report during the week of November 2, our focus remains on cash generation, spending discipline, and management guidance.
Consumer Discretionary gained 2.02% for the week. Amazon illustrated the tension between operating growth and investment costs. Quarterly sales increased 12%, and operating income reached $28.1 billion. However, trailing twelve-month free cash flow was negative $42.4 billion, primarily reflecting increased AI investment. Strong demand matters, but shareholders also need evidence that spending will produce adequate returns.
Consumer Staples gained 1.31%. Coca-Cola reported 7% organic revenue growth, 5% growth in global unit case volume, and 11% growth in comparable earnings per share. That combination is encouraging because it includes more products sold, rather than relying solely on higher prices.
Communication Services declined 5.32%, the weakest sector. Alphabet reported 25% revenue growth and 30% operating-income growth, showing strong momentum. Yet capital expenditures of $51.4 billion exceeded operating cash flow of $42.3 billion. The investment question is increasingly about when expanding revenue will translate into cash available after funding the buildout.
Energy gained 1.00%. ExxonMobil reported $15.4 billion in quarterly GAAP earnings and $25.7 billion in operating cash flow, compared with $7.0 billion in cash capital expenditures. Those figures highlight substantial cash generation. Our emphasis remains on capital discipline and balance-sheet strength, recognizing that favorable commodity conditions can change quickly.
Financials gained 1.09%. Visa reported 13% revenue growth and 17% growth in adjusted earnings per share. Payments volume increased 9% in constant dollars, while processed transactions rose 10%. These results indicate continued transaction activity, although growth across Visa’s global network should not be interpreted as evidence that every U.S. household is financially comfortable.
Health Care gained 3.12%, leading the sectors. Eli Lilly reported 39% revenue growth and raised its full-year revenue outlook. Mounjaro and Zepbound remained major contributors, although milestone payments and rebate adjustments also supported quarterly revenue. We see opportunities in identifiable product demand and improving company fundamentals, rather than treating health care simply as a defensive allocation.
Industrials gained 1.69%. UPS reported 6.7% revenue growth, with gains across all segments, and raised its full-year outlook and adjusted free-cash-flow target. That provides an encouraging example of improving business performance. We continue to look for companies converting revenue growth into stronger margins and cash flow, supported by credible execution.
Information Technology declined 2.03%. Microsoft reported 19% revenue growth, 21% operating-income growth, and 48% Azure revenue growth. These results demonstrate that cloud and AI demand remain substantial. Our focus is whether companies can sustain profitable growth while funding infrastructure, with particular attention to cash generation and the economic returns on additional investment.
Materials gained 2.79%, ranking second. FactSet continued to identify Materials among the sectors leading third-quarter earnings growth. We are looking for evidence that stronger profits reflect improving shipment volumes, pricing discipline, and operating efficiency. Those distinctions matter because higher energy and transportation costs can absorb the benefit of stronger selling prices.
Real Estate gained 1.41%. The advance was encouraging, but financing costs remain central to the investment case. An occupied building can still disappoint shareholders if refinancing absorbs its rental income. We favor manageable debt maturities, reliable tenants, and leases that support improving cash flow.
Utilities gained 2.04%, placing third among the eleven sector ETFs. Our focus remains on whether projected electricity demand becomes profitable business. AI infrastructure can create opportunities, but utilities need firm customer commitments, credible construction schedules, and regulatory approval to recover investment costs without placing excessive pressure on their balance sheets.
Note. Index figures are weekly price returns. Sector figures exclude distributions and may differ from dividend-adjusted ETF returns or corresponding S&P 500 sector index returns.
Figure 10: Sector Relative Strength vs. S&P 500.
Participation is strongest in energy and health care, with broad support across several other sectors. Technology’s short-term breadth remains weak, while communication services and real estate lag, reinforcing the case for looking beyond technology.
Figure 11: Breadth improvement happening in previously ignored sectors.
Volatility-targeting equity exposure remains above its five-year average but has retreated from recent highs. This suggests some selling has already occurred, while elevated allocations leave room for further reductions if market volatility rises again.
Figure 12: Vol-targeting funds’ exposure declined below +1 SD.
DBMF retains positive S&P 500 exposure of approximately 31%, below its recent peak near 47%. Its positioning suggests reduced conviction in the advance, but continued participation rather than a shift to betting against stocks.
Figure 13: Positioning indicators remain mixed, but the overall message remains “high neutral.”
Analysts have raised the S&P 500’s forward earnings estimates 6.9% over the past 63 trading days, an unusually strong pace historically, but a loss of momentum over the past couple quarters. Technology, energy, and health care lead the upgrades. However, revisions are slowing in several sectors, while communication services and consumer discretionary face outright cuts, highlighting growing differences beneath the market’s headline earnings strength.
Figure 14: Earnings continue to support equities, but weakening momentum is being monitored closely.
Seasonal patterns suggest tailwinds for the remainder of the year.
Figure 15: Updated S&P 500 cycle composite for 2026 and 2027.
The scorecard’s 4.17 out of 10 reading supports earning bond income while keeping risk controlled. Attractive starting yields, lower Treasury rates, and narrower credit spreads are positives. However, persistent inflation, heavy Treasury issuance, and limited compensation for credit risk argue against aggressively extending maturities or reaching for yield. The clearest opportunity is in higher-quality bonds with short to intermediate maturities, capturing meaningful income while preserving flexibility if inflation, interest rates, or credit conditions move against investors.
Figure 16: The scorecard supports selective bond exposure, emphasizing high credit quality and manageable interest-rate risk. Scores are equal-weight research judgment.
Interest rates remain elevated relative to most of the past 20 years despite recent declines. Bonds offer meaningful income, but mortgages above 7% keep housing expensive, and borrowing costs continue to challenge households and businesses. Lower yields also offer some relief for financing costs. However, rates remain elevated, so the decline provides modest support without removing a significant constraint on stocks and bonds.
Figure 17: Rates have pulled back slightly.
Markets are pricing further Fed tightening, with roughly a 77% chance of a December hike and a 93% probability of rates reaching 4.25%–4.50% by April. This points to continued borrowing pressure and limited near-term relief.
Figure 18: Rate hike expectations potentially being pushed back.
U.S. Economic Releases:
Last week’s releases showed solid growth without broad labor-market stress. GDP expanded at a 3.4% annualized pace, consumer confidence improved, and unemployment claims remained low. Spending grew faster than income, while manufacturing signals were mixed. Core inflation rose 0.3% monthly despite easing employment-cost growth, leaving the Fed little reason to rush into cuts.
Watch Tuesday’s midterms and Friday’s jobs report for shifts in policy expectations and labor-market strength. ISM surveys, wages, inflation expectations, and bank lending standards will help assess growth momentum, price pressures, and credit availability.
Figure 19: Economic release calendar. Source: Forexfactory.com
Midterm years have historically been uneven for stocks. From 1931 through 2025, the S&P 500 averaged a 4.7% calendar-year price gain in midterm years, versus 9.6% in other years. The average midterm path was weakest around September. The picture improved after voting: the chart shows an average 14.8% price gain in the 12 months following Election Day since 1950. These are historical averages, not a forecast. Economic conditions, earnings, and interest rates still shape each cycle.
Figure 20: Whether a midterm year or not, equities have tended to find a bottom during the September/October period.
A Democratic congressional takeover could potentially increase conflict with the White House over spending, taxes, immigration, and regulation. Divided government would constrain major policy changes, but budget standoffs and fiscal uncertainty could unsettle investors. If domestic and foreign investors lose confidence in Washington’s ability to manage debt and govern predictably, we believe higher Treasury yields and lower stock valuations could follow. The equity risk is a higher premium for policy uncertainty, especially with inflation and borrowing costs already elevated.
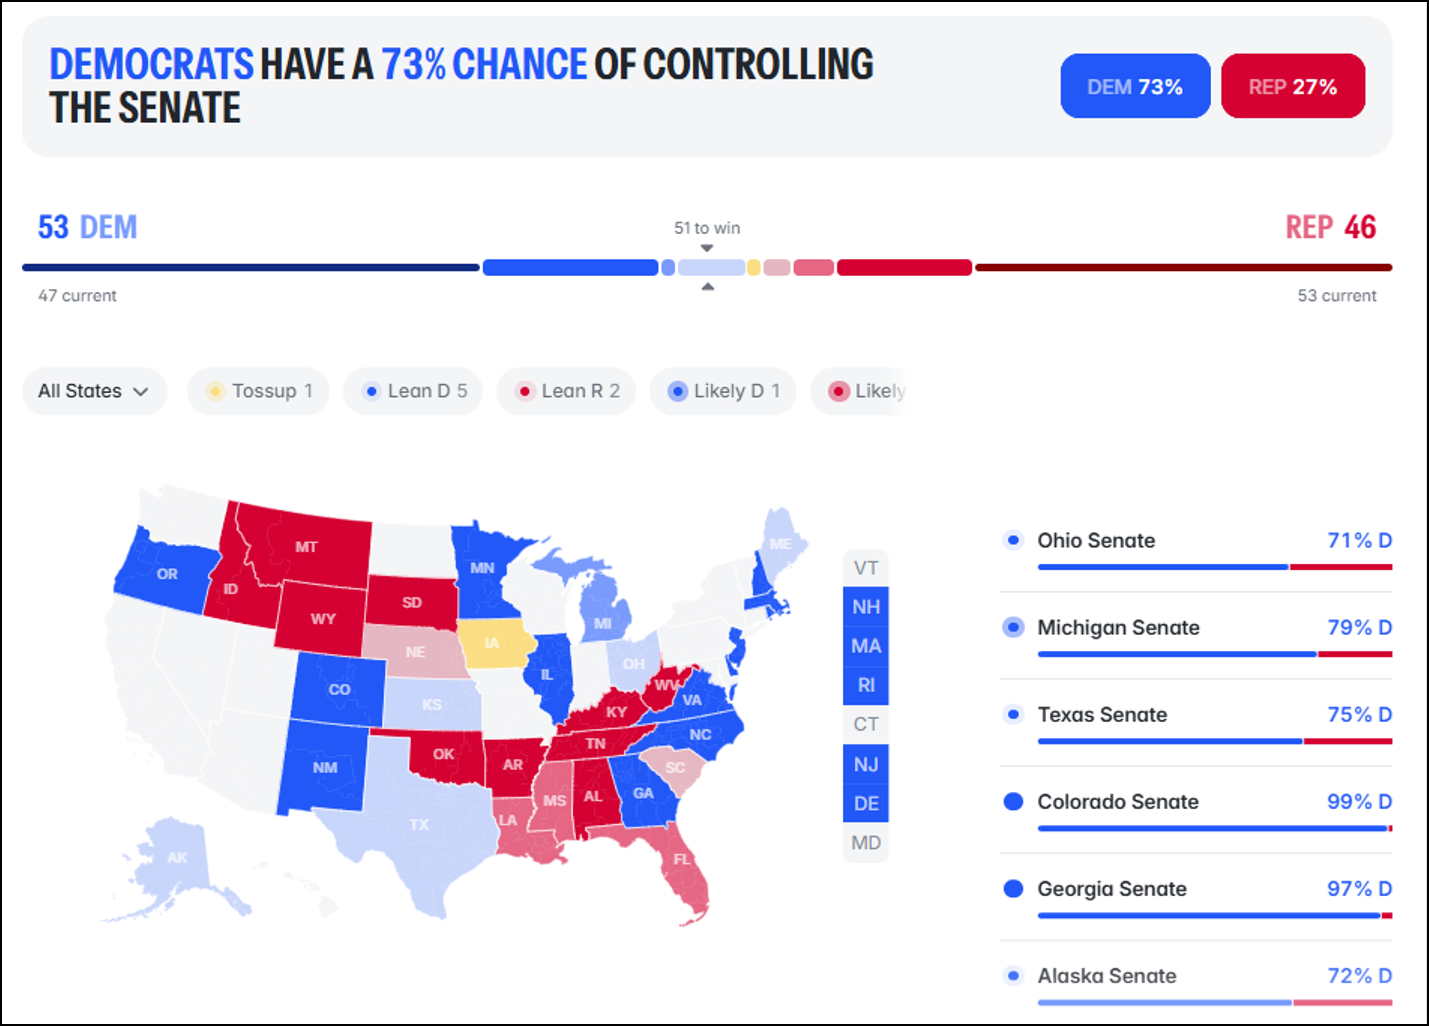
Figure 21: History shows that following elections, markets tend to do well. Is this time different? It looks to us like investors are already positioning for potential disruptions, which can be positive.
Source: Polymarket.us., as of November 2, 2026. Probabilities reflect prediction-market trading activity and participants' expectations regarding potential election outcomes. These probabilities are subject to change and may be influenced by market sentiment, trading volume, and liquidity. They do not represent statistically determined probabilities or guarantees of actual election results.
Bottom Line
We remain invested, with opportunities broadening beyond technology. Health care, materials, and utilities led last week’s gains, while technology and communication services weakened. Strong earnings support equities, but sector selection increasingly depends on cash generation, spending discipline, and financing costs. AI demand remains substantial, yet its investment requirements are pressuring cash flow. Elsewhere, product demand in health care and improving transaction and shipping activity offer encouraging company-level evidence. Inflation, interest rates, and this week’s elections and jobs report remain important inputs.
For more details on each sector and current model levels, please visit our research page at https://dayhagan.com/research.
This strategy uses measures of price, valuation, economic trends, liquidity, and market sentiment to make objective, rational, and emotion-free decisions about how much capital to place at risk and where to allocate it.
If you would like to discuss any of the above or our approach to investing in more detail, please don’t hesitate to schedule a call or webinar. Please call Tyler Hagan at 941-330-1702 to arrange a convenient time.
Sincerely,
Donald L. Hagan, CFA
Chief Investment Strategist, Partner, Co-Founder
This material is for educational purposes only. Further distribution is prohibited without prior permission. Please see the information on Disclosures here: https://dhfunds.com/literature. Charts with models and return information use indices for performance testing to extend model histories; they should be considered hypothetical. All Rights Reserved. © Copyright 2026 Day Hagan Asset Management. Data sources: Day Hagan Asset Management, 3Fourteen Research, J.P. Morgan, Goldman Sachs, Barchart, StreetStats, Atlanta Fed, St. Louis Fed, Koyfin, Yardeni, MarketEar, S&P Global, SPDR, FactSet.
Disclosures
Disclosure: The information contained herein is provided for informational purposes only and should not be construed as investment advice or a recommendation to buy or sell any security. The securities, instruments, or strategies described may not be suitable for all investors, and their value and income may fluctuate. Past performance is not indicative of future results, and there is no guarantee that any investment strategy will achieve its objectives, generate profits, or avoid losses. Investing involves risks, including loss of principal.
This material is intended to provide general market commentary and should not be relied upon as individualized investment advice. Investors should consult with their financial professional before making any investment decisions based on this information.
Bonds are subject to market and interest rate risk if sold prior to maturity. Bond values will decline as interest rates rise, and bonds are subject to availability and changes in price. Bond yields are subject to change. Corporate bonds are considered higher risk than government bonds but normally offer a higher yield and are subject to market, interest, and credit risk.
References to markets, asset classes, and sectors, are generally regarding the corresponding market index. Indexes are unmanaged statistical composites and cannot be invested in directly. Index performance is not indicative of the performance of any investment and does not reflect fees, expenses, or sales charges.
Data and analysis are provided “as is” without warranty of any kind, either express or implied. Day Hagan Asset Management, its affiliates, employees, or third-party data providers shall not be liable for any loss sustained by any person relying on this information. The materials may contain “forward-looking” information that is not purely historical in nature. Such information may include, among other things, projections, forecasts, estimates or market returns, and proposed or expected portfolio composition.
All opinions and views expressed are subject to change without notice and may differ from those of other investment professionals within Day Hagan Asset Management or Ashton Thomas Private Wealth, LLC.
Accounts managed by Day Hagan Asset Management or its affiliates may hold positions in the securities discussed and may trade such securities without notice.
Day Hagan Asset Management is a division of and doing business as (DBA) Ashton Thomas Private Wealth, LLC, an SEC-registered investment adviser. Registration with the SEC does not imply a certain level of skill or training.
There is no guarantee that any investment strategy will achieve its objectives, generate dividends, or avoid losses.
All hypothetical results are presented for illustrative purposes only. Back testing and other statistical analysis is provided in use simulated analysis and hypothetical circumstances to estimate how it may have performed prior to its actual existence. The results obtained from "back-testing" information should not be considered indicative of the actual results that might be obtained from an investment or participation in a financial instrument or transaction referencing the Index. The Firm provides no assurance or guarantee that the products/securities linked to the strategy will operate or would have operated in the past in a manner consistent with these materials. The hypothetical historical levels have inherent limitations. Alternative simulations, techniques, modeling, or assumptions might produce significantly different results and prove to be more appropriate. Actual results will vary, perhaps materially, from the simulated returns presented.
Definitions
S&P 500 Index—An unmanaged composite of 500 large-cap companies, widely used by professional investors as a performance benchmark for large-cap stocks.
S&P 500 Total Return Index – An unmanaged composite of 500 large capitalization companies. Professional investors widely use this index as a performance benchmark for large-cap stocks. This index assumes reinvestment of dividends.
Russell 3000: The Russell 3000 Index measures the performance of approximately 3,000 of the largest U.S. publicly traded companies, representing about 98% of the investable U.S. equity market.
AAII Sentiment Survey — A weekly survey measuring whether individual investors expect stocks to rise, fall, or remain unchanged over the next six months.
Backwardation — A futures-market structure in which near-term commodity prices exceed longer-dated prices, often indicating tight current supplies.
Benchmark Equity Allocation — The normal percentage of a portfolio assigned to stocks based on its investment objective and risk profile.
Breadth — The degree to which market gains or losses are shared across individual stocks. Broad participation generally strengthens a market trend.
Bull-Bear Spread — The percentage of bullish investors minus the percentage of bearish investors.
Catastrophic Stop Model — Day Hagan’s risk-management model designed to identify periods when major market deterioration may warrant reducing equity exposure.
CDS, or Credit Default Swap — A market-based measure of the perceived risk that a borrower will default. Rising CDS costs generally indicate increasing credit concern.
Contrarian Buy Signal — A signal suggesting widespread pessimism may have become excessive, potentially creating a buying opportunity.
Contrarian Sell Signal — A warning that optimism, risk-taking, or positioning may have become excessive, increasing vulnerability to disappointment.
Daily Market Sentiment Composite — Day Hagan’s 0–100 measure combining multiple indicators of investor psychology. Readings below 30 indicate excessive pessimism, while readings above 70 indicate excessive optimism.
DBMF — The iMGP DBi Managed Futures Strategy ETF, used here as a proxy for positioning among systematic, trend-following strategies.
Drawdown — The percentage decline from an investment’s previous peak to its subsequent low.
Earnings Revisions — Changes analysts make to company profit estimates. Rising estimates are generally supportive of stock prices.
Federal Funds Rate — The Federal Reserve’s primary short-term policy interest rate.
FOMC — The Federal Open Market Committee, the Federal Reserve group responsible for setting monetary policy and interest rates.
Forward Earnings — Analysts’ estimates of company profits over a future period, commonly the next 12 months.
Forward Earnings Growth Rate — The expected percentage increase in future corporate earnings compared with the prior comparable period.
Forward P/E Ratio — A stock’s price divided by expected earnings over the next 12 months. Higher readings generally indicate more demanding valuations.
Magnificent Seven — Alphabet, Amazon, Apple, Meta Platforms, Microsoft, Nvidia, and Tesla.
Maximum Drawdown — The largest peak-to-trough decline experienced during a specified period.
OAS, or Option-Adjusted Spread — The additional yield a bond provides over a comparable Treasury after adjusting for embedded options. Wider spreads generally indicate greater perceived credit risk.
Overbought — A condition in which prices have risen rapidly and may be vulnerable to a pause or pullback.
Oversold — A condition in which prices have fallen rapidly and may be positioned for a rebound.
PEG Ratio — The price-to-earnings ratio divided by expected long-term earnings growth. A lower ratio may indicate a more attractive valuation relative to anticipated growth.
Risk-Off Signal — An indication that market conditions have deteriorated enough to favor reducing exposure to riskier assets.
RSI, or Relative Strength Index — A momentum indicator ranging from 0 to 100. Readings above 70 commonly indicate overbought conditions, while readings below 30 indicate oversold conditions.
Systematic Investors — Strategies that adjust exposure using predefined rules based on trends, volatility, momentum, or other quantitative signals.
VIX — A market-based measure of expected S&P 500 volatility over the next 30 days, sometimes called the market’s fear gauge.
Volatility-Targeting Strategy — A rules-based strategy that generally reduces equity exposure when volatility rises and increases exposure when volatility falls.
WTI — West Texas Intermediate, a major U.S. crude-oil pricing benchmark.
WTI Forward Curve — The series of prices for WTI crude-oil futures across different expiration dates, reflecting supply, demand, storage, and market expectations.
Day Hagan Asset Management
1000 S. Tamiami Trail, Sarasota, FL 34236
Toll-Free: (800) 594-7930
Office Phone: (941) 330-1702
Websites:https://dayhagan.com or https://dhfunds.com
© 2026 Day Hagan Asset Management