
Day Hagan Catastrophic Stop Update February 18, 2026
A downloadable PDF copy of the Article:
The Day Hagan Catastrophic Stop model held steady at 59.09%. The model continues to indicate that investors should maintain their benchmark equity exposure.
Figure 1: The Catastrophic Stop model would generate a sell signal by closing below 40% for two consecutive days. The current message remains constructive, indicating investors should maintain benchmark equity exposure.
About the Catastrophic Stop Model (from last week, for those that didn’t have a chance to read it)
The model is a risk-regime monitor designed to detect crash conditions, not forecast prices. Its signals span market breadth, trend, sentiment, economic activity, and credit. Breadth thrusts, Russell 3000 participation, and high-yield bond breadth measure internal market health.
Currently, the signals show elevated churn but no synchronized breakdown. Breadth is mixed, not collapsing; trends remain mostly intact; and credit stress is contained. Oversold triggers appear intermittently, consistent with volatility rather than liquidation. The composite itself sits in a neutral-to-moderate risk zone, well below historical spikes in danger. In plain terms, the market looks fragile and late-cycle, but not structurally impaired or in a crash-warning regime. Positioning favors selective exposure, disciplined risk controls, and patience rather than aggressive de-risking today across asset classes.
Comparison to prior pre-crash regimes
2000 / 2007 / early 2020:
Pre-crash periods showed persistence, not churn. Breadth rolled over decisively and stayed weak, long-term trend filters flipped and failed to recover, and—most importantly—credit deteriorated first and relentlessly. High-yield spreads widened for months, HY breadth collapsed, and risk-on vs risk-off ratios broke down well before equity prices did. Signals aligned in one direction.
Today:
There is noise instead of alignment. Breadth weakens and recovers, trends wobble but hold, and credit refuses to confirm systemic stress. That divergence is the key difference. Until you see simultaneous, sustained breakdowns—especially in credit—this setup looks like drawdown risk, not pre-crash anatomy.
Turning to shorter-term measures, the Daily Market Sentiment Composite remains in neutral territory. Neither a headwind nor a tailwind. Note: The Smart Sector series February updates are available on our website. Please visit dayhagan.com/research for the latest on our sector changes, international outlook, and fixed income views.
Figure 2: Sentiment is neither overly optimistic nor pessimistic.
Volatility has increased—a development that will likely surprise no one reading this update.
We conducted a study to determine whether VIX increases consistently and reliably serve as a warning signal.
We analyzed periods during which the VIX exceeded 25 for two consecutive days—the first such occurrence in at least three months.
We identified 20 such instances since 1990. Let me now chart the S&P 500's performance surrounding these events.
Here’s a summary of the event study across these 20 instances. The key takeaway:
The signal is mildly positive, but far from definitive. Three months after the VIX first spikes above 25 following a quiet period:
Median return: +2.4%, Mean: +1.7%
60% of instances were positive—better than a coin flip, though not overwhelmingly so.
The best cases (Dec 2018, Jan 2016, Aug 2015) saw rallies of +10–12%, indicating that market fears had been overdone.
The worst cases (Jul 2008: –21%, Jun 2002: –12%) served as early warnings of more significant challenges ahead.
This pattern suggests that VIX spikes often coincide with short-term selling climaxes followed by market recoveries. However, during genuine bear markets (such as in 2002 and 2008), the spike is often just the start of further declines. Context is critical—the signal alone cannot distinguish between a buyable dip and a falling knife. VVIX readings remain highly volatile as well.
Figure 3: VIX spikes generally resolve in line with the broader direction of the prevailing primary trend. We currently view the primary trend as up.
Volatility is also elevated because the S&P 500 is in a negative-gamma environment. The gamma condition will flip to positive above SPX 6,929 (level changes throughout the day). Note that negative gamma volatility works both ways, up and down.
Figure 4: Currently, the SPX level resides within a negative gamma condition.
Interestingly, while equity market volatility has increased, the Economic Policy Uncertainty Index has declined. This recent drop is driven by a reduction in broader policy and geopolitical concerns. Frankly, we would be thrilled if investors became desensitized to the media's fearmongering.
Note: The VIX is driven by investor positioning, hedging demand, liquidity stress, earnings outlook, and technical factors. The Economic Policy Uncertainty Index is based on newspaper mentions of policy uncertainty, tax code expiration data, and forecast disagreement among economists. It reflects policy uncertainty in the real economy, not immediate trading risk.
Figure 5: While stock volatility has increased in the short term, economic policy uncertainty levels have been moving lower since peaking around Liberation Day.
As you may recall, Q1 2025 was also turbulent. The subsequent rebound was fueled by a re-acceleration in corporate profits, explosive AI-driven capex announcements, renewed optimism for Fed rate cuts, the launch of Deep Seek’s latest value AI, stronger-than-expected economic activity, tariff de-escalation, and pro-business policy expectations following the election. While these factors are now less bullish, they remain relevant. With the S&P 500 down only about 3% from its record highs, this pullback isn’t surprising. However, sector rotations beneath the surface provide important insights:
Sector rotation points to a broadening, late-cycle—though not yet recessionary—environment. Market leadership is shifting from mega-cap tech toward energy, materials, industrials, and other cyclicals. At the same time, defensives like staples and utilities are gaining traction. This pattern suggests investors expect steady growth amid inflation and rate uncertainty, and are prioritizing real assets and earnings confidence over long-duration exposures.
Figure 6: 2025 SPX performance vs. 2026 YTD.
The chart below shows the Magnificent Seven stocks (market-cap weighted) underperforming a quality stock index. A 3-month rate of change of -8.6% highlights this recent weakness. Longer-term, the damage isn’t as severe as Liberation Day 2025 or the 2022 bear market, but it’s been enough to shake out many investors. The recent spike in turnover suggests weaker holders are selling to stronger hands, which can help establish support, as new investors have a higher tolerance for downside before selling again.
Figure 7: Mag 7 vs. Quality Stocks.
Software stocks are experiencing sharply negative momentum, with a 3-month rate of change at –24.2%, near three-year lows. This marks a significant reversal from the persistent strength seen during 2023–2025.
The sector is under pressure as capital rotates to AI infrastructure, traditional SaaS models are questioned, and high valuations are challenged by slowing IT budgets and rising rates. Selling has been broad, penalizing even strong, cash-generating platforms that embrace AI and new pricing models.
The past three months brought the worst returns for software stocks outside the Tech Wreck and the Global Financial Crisis.
Few pure software names gained; relative winners include AI infrastructure, security, and public-sector platforms, which showed resilience. Names like Palantir and CrowdStrike were often cited as standouts amid the broader selloff.
Despite the correction, over the past two weeks, forward earnings forecasts for S&P 500 software names have risen, even as prices sold off. Consensus now expects software and services earnings to grow about 19% in 2026, with growth estimates for the broader tech sector (including software) revised higher since late January.
Analysts’ 2026 EPS growth expectations for technology remain “robustly positive,” with estimate revisions skewed upward rather than cut during the recent drawdown.
Similarly, other industries once viewed as at risk of AI disruption—such as insurance brokers and advertisers—have seen positive EPS revisions in 2026.
Figure 8: Stock prices retreated, but earnings forecasts increased.
Without going into too much detail (this is supposed to be a quick read), we highlight the EVA-based perspective for MSFT and ADBE below. Think of it as one of the “Generals” vs. one of the “Troops.” We also identify some standard metrics of interest.
Note: Economic Value Added (EVA) measures whether a company generates returns above its full cost of capital. It’s calculated by subtracting a capital charge (invested capital × weighted average cost of capital) from net operating profit after tax. Positive EVA reflects value creation; negative EVA signals value destruction and poor capital allocation. EVA can be loosely called a modified DCF approach.
The crosshair (red circle with a cross) shows what is currently priced into the stock. The lighter red line identifies analysts’ expectations. As you can see, investors are pricing in much more optimistic expectations than analysts. This is typically a caution flag. Furthermore, investor expectations are for EVA margins to reach levels never before seen by MSFT.
As shown in the projection table, for MSFT to be worth what it is today, EVA margins would have to improve, for example, from 24.9% to 41.4%, while revenues grew from about $314.6B to $667.2B in 5 years.
Standard metrics: More cash than debt, FCF Margin 25.34%, ROIC 22.3% vs. WACC of 10.0%
Figure 9: MSFT from an EVA perspective. Not a recommendation.
Adobe’s EVA outlook indicates investor expectations and analyst expectations are aligned. To be worth today’s price, EVA margins would have to hold steady while revenues increased from $24.3B to $36.4B over the next 5 years.
The purpose of this exercise is to show that pockets of potential Fair Value do exist, even within the software industry.
Standard Metrics: Cash almost = debt, FCF margin = 41.45%, ROIC 25.5% vs. WACC 12.1%.
Figure 10: ADBE from an EVA perspective. Not a recommendation.
Keeping an eye on the SPX RSI, which is once again approaching near-term oversold levels.
Figure 11: Short-term technical underpinnings OK.
Positioning remains neutral. Systematic and algorithmic positioning into last night’s close appeared broadly stable. Vol-control and CTA signals suggested incremental rebalancing rather than wholesale shifts.
Figure 12: Neutral positioning implies that investors or strategies are neither meaningfully long nor short. Exposure is close to the benchmark or zero, so there is limited directional conviction embedded in prices. As a result, markets may be more responsive to new information, since fresh data or catalysts can more easily push positioning in either direction.
One of the most bullish signals in today’s market is the strength of U.S. corporate earnings. Rising earnings expectations remain a powerful tailwind and a key reason the primary market uptrend remains intact.
Figure 13: Earnings trends remain supportive.
From a regime perspective, U.S. economic activity remains stable, and inflation continues to trend toward the Fed’s target. Progress is rarely linear, but the broader secular uptrend appears intact.
The Citi Economic Surprise Index (CESI) is currently at 33.5, well above its historical average of 5.9 and at the 74th percentile of its range, indicating that recent economic data has generally exceeded expectations. Overall, both the equity market and economic surprises are in healthy territory relative to their long-term history.
Figure 14: The Citi Economic Surprise Index indicates that U.S. economic releases are beating expectations, on average, over the past three months. Positive economic momentum.
Comparing the 2-year Treasury yield and the Fed Funds rate reveals how market expectations lead Fed policy. The 2-year typically moves first, reflecting where markets see equilibrium rates.
In early 2022, the 2-year yield spiked, and the Fed Funds rate followed. When the 2-year declined, Fed Funds soon moved lower as well.
The chart’s lower section highlights the 2-year minus Fed Funds spread: green when positive, red when negative.
Key observations: Currently, the 2-year is at –0.24% below the Fed Funds rate, signaling that markets anticipate a rate cut, but not much more. The historical average spread is +0.26%, so current levels are modestly below normal. The most negative readings (as low as –1.81%) occurred during past tightening cycles, with the 2-year leading the Fed lower before rate cuts.
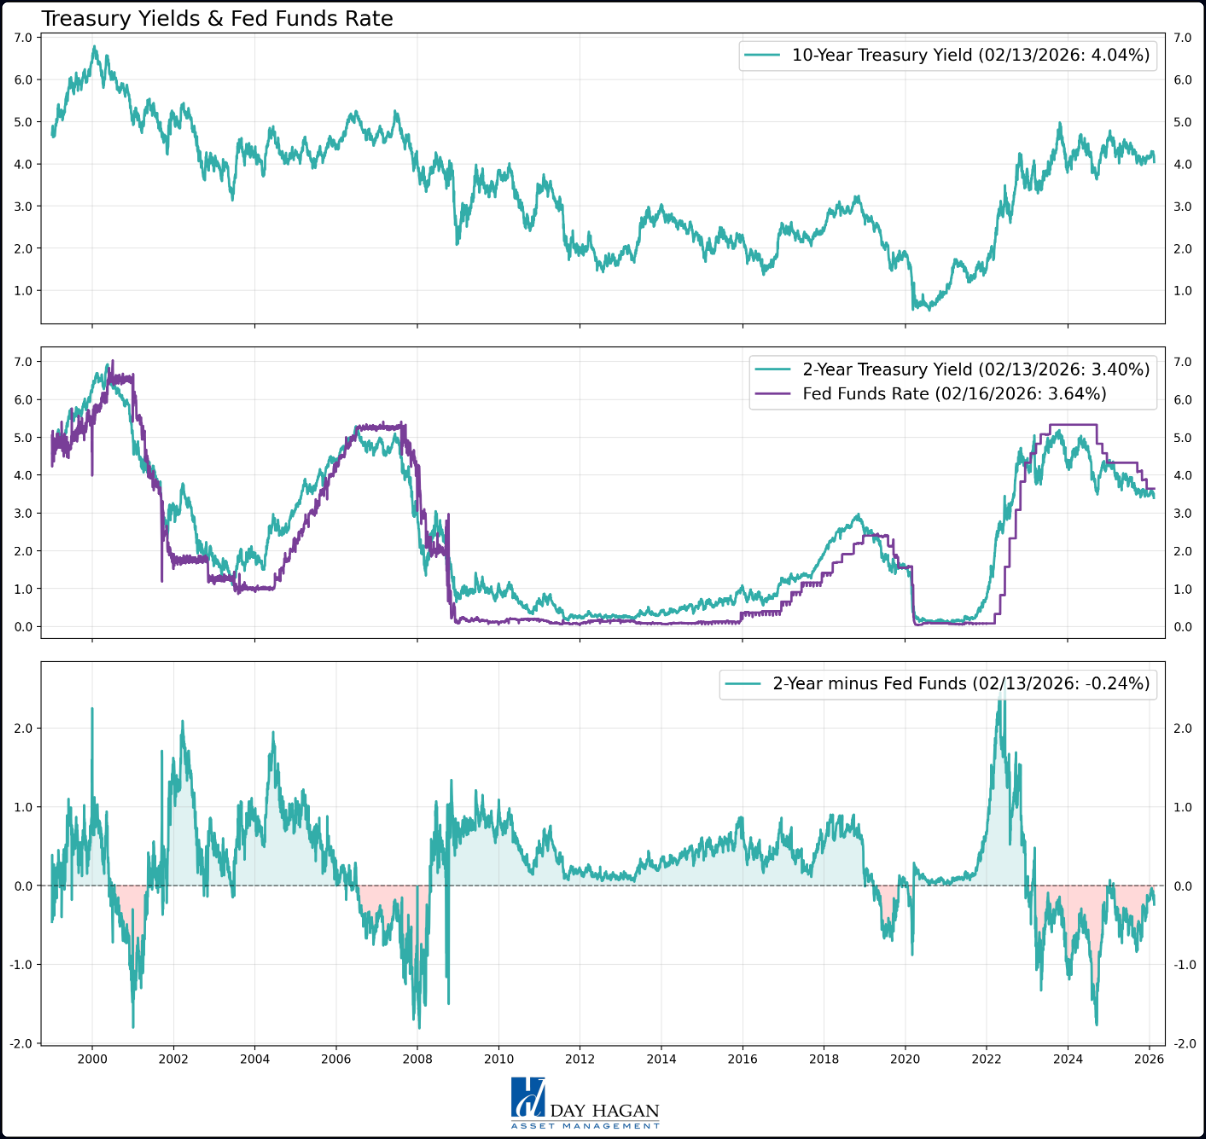
Figure 15: Bottom line, market and Fed expectations are largely aligned under this view.
The chart below analyzes how the S&P 500’s forward P/E ratio relates to subsequent 5-year returns, using monthly data from 1990 to early 2021. Historically, higher forward P/E ratios have been associated with lower future returns (correlation: -0.49, R²: 0.24), with each 1-point increase in P/E linked to a 1.15% decrease in annualized 5-year returns. The current forward P/E is 21.4, which is higher than in 89% of historical observations and implies a modest 5-year annualized return of about 2.6% based on historical relationships. This suggests that, at today’s valuation, expectations for long-term index returns are subdued compared with periods when valuations were lower. This argues for prioritizing sector rotation.

Figure 16: Supporting active management.
U.S. Economic Releases:
Last week's data supported our stable economic growth and inflation views.
Still out there: The U.S. Supreme Court has not yet ruled on the legality of President Trump’s tariff program after hearing oral arguments on November 5, 2025. The next potential opinion days are expected when the Court returns after recess, with February 24 or 25 now noted as the earliest likely session to issue decisions, though the timing remains uncertain.
Unemployment claims tomorrow.
Advance GDP, PCE, Flash Manufacturing and Services PMIs on Friday.
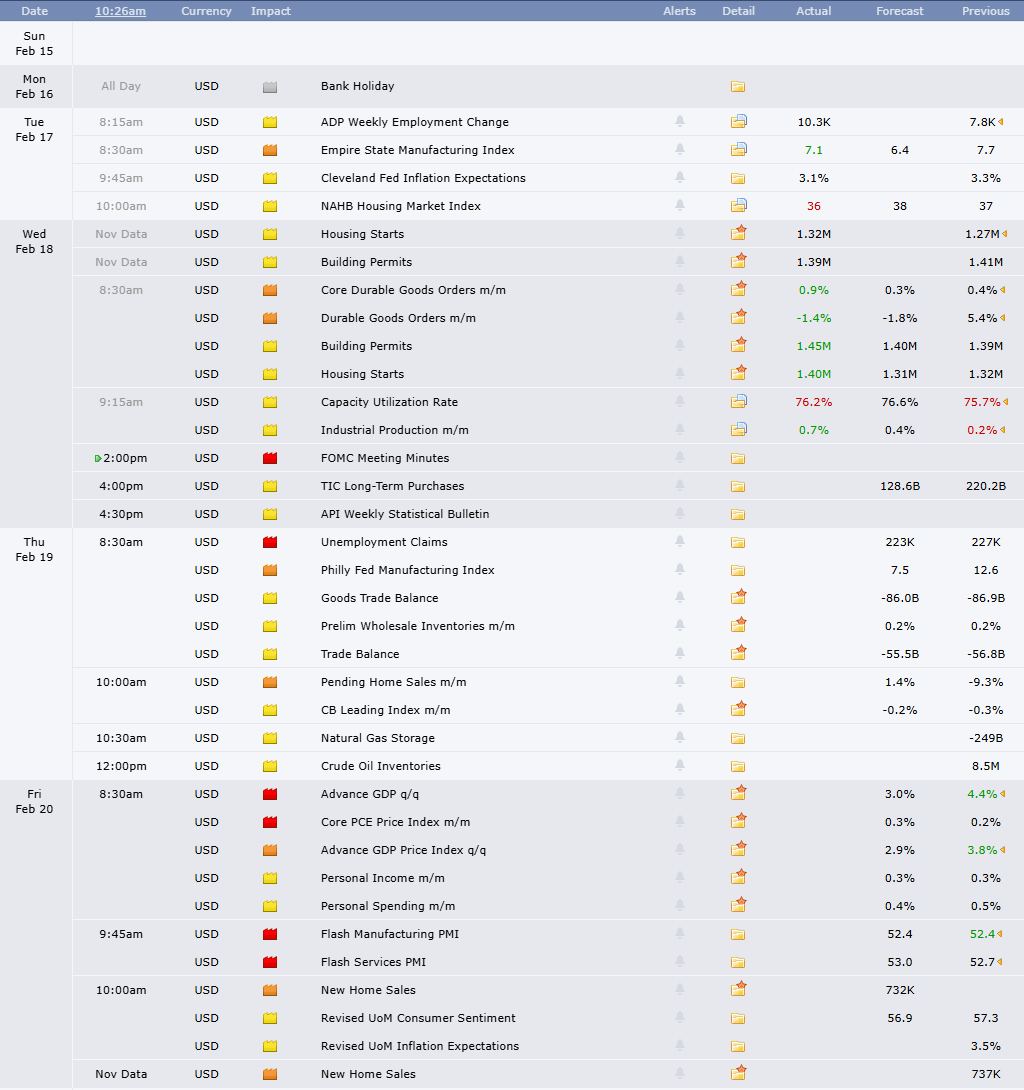
Figure 17: Economic release calendar.
Bottom Line: U.S. equities face choppy waters amid growth, inflation, and policy crosscurrents. The economy shows steady momentum—Q4 GDP tracking near 2.5% annualized growth, with consumer spending holding up despite high rates. Labor markets remain balanced: unemployment is steady at 4.3%, job growth is moderating to 130K/month, and wage pressures are easing without cracks in participation. Inflation trends favor disinflation—January CPI at 2.4% YoY (core 2.9%), services ex-housing cooling toward 3%. Trend-level progress keeps one Fed cut alive for H1 2026, though fiscal flows and geopolitics cap the pace. Earnings expectations strengthened: S&P 500 consensus now projects 14% EPS growth in 2026, with tech/software surprisingly revised higher despite the rotation. Software sector earnings growth forecasts for 2026 are 19% despite price action, signaling oversold conditions. Balanced labor plus firm fundamentals argue against recession, though volatility persists as cyclicals lead.
For more details on each sector and current model levels, please visit our research page at https://dayhagan.com/research.
This strategy uses measures of price, valuation, economic trends, liquidity, and market sentiment to make objective, rational, and emotion-free decisions about how much capital to place at risk and where to allocate it.
If you would like to discuss any of the above or our approach to investing in more detail, please don’t hesitate to schedule a call or webinar. Please call Tyler Hagan at 941-330-1702 to arrange a convenient time.
Sincerely,
Donald L. Hagan, CFA
Chief Investment Strategist, Partner, Co-Founder
This material is for educational purposes only. Further distribution is prohibited without prior permission. Please see the information on Disclosures here: https://dhfunds.com/literature. Charts with models and return information use indices for performance testing to extend the model histories, and they should be considered hypothetical. All Rights Reserved.
© Copyright 2026 Day Hagan Asset Management. Data sources: Day Hagan Asset Management, 3Fourteen Research, J.P. Morgan, Goldman Sachs, Barchart, StreetStats, Atlanta Fed, St. Louis Fed, Koyfin, Yardeni, MarketEar, S&P Global, SPDR, FactSet.
Disclosures
S&P 500 Index—An unmanaged composite of 500 large-cap companies, this index is widely used by professional investors as a performance benchmark for large-cap stocks.
S&P 500 Total Return Index – An unmanaged composite of 500 large capitalization companies. Professional investors widely use this index as a performance benchmark for large-cap stocks. This index assumes reinvestment of dividends.
Sentiment – Market sentiment is the prevailing attitude of investors toward a company, a sector, or the financial market.
CBOE Volatility Index (VIX) – A real-time index that represents the market’s expectations for the relative strength of near-term price changes of the S&P 500 Index (SPX). Because it is derived from SPX index options with near-term expiration dates, it produces a 30-day forward volatility projection. Volatility, or how quickly prices change, is often seen as a way to gauge market sentiment, particularly the degree of fear among market participants.
OBOS Indicators—The overbought/Oversold (OBOS) index relates the difference between today’s closing price and the period’s low closing price to the trade margin of the given period.
NFIB – The National Federation of Independent Business advocates for America’s small and independent business owners.
Purchasing Manager Indexes (PMIs) – Purchasing Managers’ Indexes are survey-based economic indicators designed to provide timely insight into business conditions.
FOMC Meeting – The FOMC (Federal Open Market Committee) holds eight regularly scheduled meetings per year. At these meetings, the Committee reviews economic and financial conditions, determines the appropriate stance of monetary policy, and assesses the risks to its long-term goals of price stability and sustainable economic growth.
Consumer Price Index (CPI) – Measures the monthly change in prices paid by U.S. consumers. The Bureau of Labor Statistics (BLS) calculates the CPI as a weighted average of prices for a basket of goods and services representative of aggregate U.S. consumer spending.
Disclosure: The information contained herein is provided for informational purposes only and should not be construed as investment advice or a recommendation to buy or sell any security. The securities, instruments, or strategies described may not be suitable for all investors, and their value and income may fluctuate. Past performance is not indicative of future results, and there is no guarantee that any investment strategy will achieve its objectives, generate profits, or avoid losses.
This material is intended to provide general market commentary and should not be relied upon as individualized investment advice. Investors should consult with their financial professional before making any investment decisions based on this information.
Data and analysis are provided “as is” without warranty of any kind, either express or implied. Day Hagan Asset Management, its affiliates, employees, or third-party data providers shall not be liable for any loss sustained by any person relying on this information. All opinions and views expressed are subject to change without notice and may differ from those of other investment professionals within Day Hagan Asset Management or Ashton Thomas Private Wealth, LLC.
Accounts managed by Day Hagan Asset Management or its affiliates may hold positions in the securities discussed and may trade such securities without notice.
Day Hagan Asset Management is a division of and doing business as (DBA) Ashton Thomas Private Wealth, LLC, an SEC-registered investment adviser. Registration with the SEC does not imply a certain level of skill or training.
There is no guarantee that any investment strategy will achieve its objectives, generate dividends, or avoid losses.
For more information, please contact us at:
Day Hagan Asset Management
1000 S. Tamiami Trail, Sarasota, FL 34236
Toll-Free: (800) 594-7930
Office Phone: (941) 330-1702
Websites: https://dayhagan.com or https://dhfunds.com
© 2026 Day Hagan Asset Management
