
Day Hagan Catastrophic Stop Update April 7, 2026
A downloadable PDF copy of the Article:
The Day Hagan Catastrophic Stop model increased to 59.09% from 45.45% last week. The increase was due to improvements in Equity and High-Yield breadth indicators. (Note: Both measures would return to sell signals should the markets reverse lower.) The model indicates that investors should maintain benchmark equity exposure.
Figure 1: Last week’s equity and bond breadth improvement is flowing through to the Composite score.
Equity breadth improved into Thursday’s close, with the rally spreading beyond mega-caps as advancing issues, equal-weight performance, and stocks reclaiming short-term trend measures strengthened. Participation improved, though breadth remained uneven and below bull-market peaks.
Figure 2: Breadth “fish hooking” higher from oversold levels. Note that breadth didn’t quite reach the “so bad, it’s good” level of 7% (green line) that has historically identified periods of extreme selling exhaustion.
High-yield bond breadth improved into Thursday’s close as participation widened, spreads tightened, and more issuers outperformed Treasuries. Improvement reflected easing Treasury yields, quarter-end rebalancing demand, and hopes for a de-escalation of the war in Iran, all of which supported risk appetite.
Figure 3: High-yield spreads tightened as participation broadened across the asset class.
Pessimism remains elevated because market action, options activity, and safe-haven flows still reflect a defensive tone, while trader surveys show limited enthusiasm toward the S&P 500. Ongoing worries about war-driven oil price volatility, sticky inflation, and softer growth expectations continue to weigh on risk appetite and keep sentiment subdued.
Note: When sentiment falls below 20, marking an extreme pessimism reading, the near-term backdrop has historically remained difficult. Over the following month, the median return has been -0.6%, with only a 48% success rate, suggesting that the weakness driving sentiment to such depressed levels often persists for a bit longer.
Beyond that initial period, however, the rebound has typically been much stronger. The median 3-month return rises to 6.6%, with an 81% success rate, followed by a 15.8% median gain over 6 months with an 82% success rate, and a 16.5% median return over 1 year with an 83% success rate. Each of those longer-term outcomes stands well above baseline, underscoring that extreme pessimism has often been followed by a meaningful recovery (returns and success rates are considered hypothetical, as the start date uses data from before the model was developed to analyze a greater array of market conditions).
Figure 4: These levels of pessimism are potentially constructive for the market from a contrary opinion perspective.
While breadth was evidencing modest improvement, vol-targeting strategies were reducing equity exposure. This represents a potential source of future demand.
Figure 5: Vol-targeting strategies exhibit lower equity exposure, which is favorable from a contrarian perspective.
Our proxy for managed futures funds, DBMF, shows the lowest equity exposure in three years. Again, another source of potential demand once a new uptrend is established.
Figure 6: By last Thursday’s close, many systematic and algo-related strategies had offloaded a portion of their equity risk. They’ll have to buy it back at some point.
Below is the updated chart showing performance since the Iran conflict began in earnest. We’ll say it again, remarkable given the other macro and micro conditions swirling around (private credit, decelerating economic activity, Ukraine/Russia, shutdown of shipping routes, the full weight of the knock-on effects of higher oil prices still unknown).
Figure 7: At the index level in the U.S., equity performance seems to indicate a normal and orderly retracement so far.
We also present the updated 2025 vs. 2026 YTD chart below. The similarities remain interesting.
Figure 8: Tariffs vs. Oil Shocks.
The cycle chart shows a peak in cyclical support in mid-April, coinciding with Tax Day, earnings reports, and March/Q1 economic releases. Cycle work is a second-tier indicator set for us, but we monitor it for potential headwinds/tailwinds.
Figure 9: The 2026 Cycle Composite indicates a peak in mid-April, and then choppy markets into October.
Strategists aren’t backing down from their bullish expectations. Currently, strategists forecast the S&P 500 to reach 7,561 by the end of this year.
Figure 10: A lot has to go right for the S&P 500 to meet the 7,561 forecast. Mostly, earnings will have to meet expectations, which, of course, is a function of revenues and margins.
The good news so far is that earnings expectations continue to rise. Clearly, this is a direct response to increases in energy sector earnings outweighing higher costs driven by energy prices.
Figure 11: Earnings estimates continue to increase at the index level.
Current economic surprise and ISM PMI readings point to an economy that is still expanding, but with a more complex mix beneath the surface. The Citigroup U.S. Economic Surprise Index remains positive, meaning recent data have generally come in better than economists expected. ISM Manufacturing at 52.7 shows factory activity is expanding again, while ISM Services at 54.0 says the much larger services side is still growing, though at a slower pace than in February. Together, they suggest supportive growth, but with rising price pressures and some cooling in momentum.
Figure 12: March and early-April economic data were OK on average, but showed signs of potential deceleration.
The chart below tracks Challenger net hiring by year, defined as hires minus layoffs in thousands, and compares seasonal paths from 2018 through 2026. The red 2026 line shows net hiring already deeply negative by March, around minus 166,000, weaker than most prior years and signaling softer labor demand and continued corporate caution.
Figure 13: The March employment report was healthy, but other employment-related reports indicate some fragility. We continue to rate the labor markets as “low-hire, low-fire,” but are concerned.
U.S. breakeven inflation expectations are elevated, especially at the front end. As of April 2, 2026, the 1-year breakeven stands at 5.23%, far above the 10-year at 2.36%, signaling near-term inflation fears remain intense while longer-run expectations are still relatively contained. That steep curve suggests markets see immediate price pressures as more acute than persistent long-term inflation.
Of course, everything depends on how long shipping routes remain constrained. And that is unknowable at this point.
Figure 14: Longer-term inflation expectations remain relatively well anchored, but time is working against investors as long as the Iran war continues. Note the 2-year has crept higher.
Currently, markets are largely anticipating stability, with no significant rate cuts or hikes expected. The federal funds target stands at 3.50%–3.75%. Following the strong March jobs report, CME FedWatch data indicated a 76% probability of no change through year-end 2026, a 13.3% chance of a single 25 bp hike, and a 9.7% chance of a single 25 bp cut. Another report placed the odds of a hike at about 10.1%, which is broadly consistent.
In summary, over the next 12 months, the base case is for rates to hold steady. Rate cuts remain possible but are not the primary expectation, while the likelihood of hikes, though still low, can no longer be ignored. The Fed’s March projections retained a slightly dovish tilt, signaling one cut in 2026, but recent inflation and energy concerns have led to more cautious market pricing and a flatter expected path for rates.
Figure 15: For us, the 2-year minus the Fed funds rate has proven a reliable proxy for potential Fed policy actions.
It is important to note that credit spreads (OAS) remain at the lower end of their long-term ranges. This indicates an orderly market in which fixed-income investors aren’t pricing in a major financial dislocation. Even with the problems in Private Credit.
Figure 16: OAS not spiking.
CDX NA IG 5Y CDS and CDX NA HY 5Y CDS measure the cost of buying credit default swap protection for five years on baskets of North American investment-grade and high-yield companies. Higher 5-year CDS spreads indicate that investors are paying more for protection, signaling rising concern about default risk and broader credit conditions. Lower spreads suggest that perceived credit risk is more subdued. The 5-year tenor is the standard benchmark in the CDS market, making it the most widely followed maturity.
Recently, CDS spreads have moved back up toward their historical averages after coming off unusually low levels. Investment-grade CDS remains below its long-term average, while high-yield CDS is roughly in line with its average. That tells us credit stress has increased from very calm levels, but remains broadly contained rather than signaling outright market distress. At the same time, the firmer move in lower-quality credit suggests investors are becoming more cautious and are no longer especially complacent about risk.
Figure 17: CDS indicating more concern than OAS, but both remain below or close to historical averages.
The Recession Probability series is the New York Fed’s 12-month-ahead recession model, which is built from the Treasury spread between the 10-year bond yield and the 3-month Treasury bill rate. In other words, it translates the shape of the yield curve into the probability of a recession one year ahead.
The chart shows that the S&P 500 remains near highs even as the 10-year Treasury yield stays elevated at 4.31%, while recession odds sit around 30%, close to the series’ long-run average. That implies markets are still looking through macro risk, with growth fears present but not yet signaling an imminent downturn.
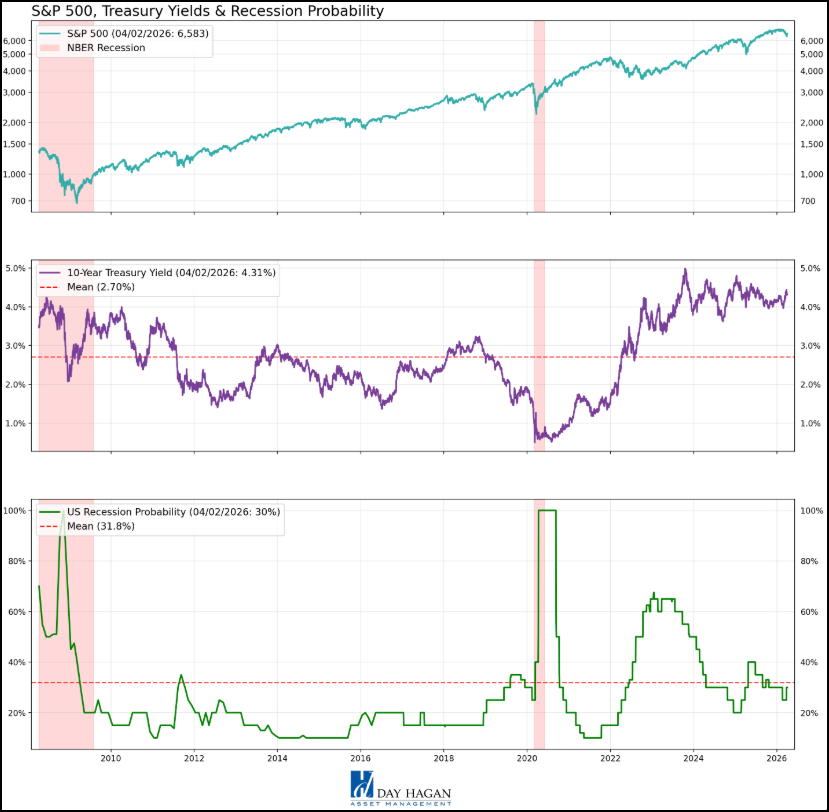
Figure 18: Recession probability based on the yield-curve. One indicator’s message…
U.S. Economic Releases:
Last week’s data supported continued economic growth (decent results from Retail Sales, Manufacturing PMIs, Vehicle Sales, Unemployment Claims, Non-Farm Employment, Unemployment Rate) and growing inflation concerns (ISM Manufacturing Prices higher). The S&P Global Final Services PMI for March was a disappointment, coming in at 49.8 (revised down from a 51.1 exp., the first drop below 50 in three years). Missed due to declines in confidence, rising cost pressures, and was worse for consumer-facing services sectors. Watching to see if this weakness extends into other economic releases. However, the ISM Services PMI released today came in at 54, lower than expected but still in expansion territory.
Note: S&P Global Services PMI comes from private survey data and broader international methodology; ISM Services PMI is a U.S.-focused supply-management survey with a longer history and different weights.
Consumer Credit, ADP Employment on Tuesday.
10-year bond auction on Wednesday! Also, FOMC Meeting Minutes, Crude Oil Inventories.
Thursday, PCE Price Index, Unemployment Claims, Spending/Income data. 30-year bond auction!
CPI Friday.
Figure 19: Economic release calendar. Source: Forexfactory.com
Bottom Line: Overall, market conditions improved modestly last week, raising the Day Hagan Catastrophic Stop model to 59.09% and supporting benchmark equity exposure. Broader participation in equities and high-yield bonds led this shift, though both could quickly reverse if markets weaken. Despite persistent pessimism—a poor short-term indicator but a constructive medium-term contrarian signal—systematic strategies and managed futures remain underexposed, leaving potential for future demand should trends improve. Macroeconomic data still point to expansion, with positive surprises and ISM readings above 50, but emerging signs of deceleration, labor-market fragility, and elevated near-term inflation expectations signal caution. Markets expect the Fed to hold rates steady over the next year. Credit markets are flashing more concern than before, but spreads and CDS levels remain orderly, not distressed. Overall, the environment appears constructive yet fragile, shaped by improving breadth, persistent pessimism, inflation risks, and cautious optimism on the earnings and economic outlooks.
For more details on each sector and current model levels, please visit our research page at https://dayhagan.com/research.
This strategy uses measures of price, valuation, economic trends, liquidity, and market sentiment to make objective, rational, and emotion-free decisions about how much capital to place at risk and where to allocate it.
If you would like to discuss any of the above or our approach to investing in more detail, please don’t hesitate to schedule a call or webinar. Please call Tyler Hagan at 941-330-1702 to arrange a convenient time.
Sincerely,
Donald L. Hagan, CFA
Chief Investment Strategist, Partner, Co-Founder
Sources:
https://www.3fourteenresearch.com/
This material is for educational purposes only. Further distribution is prohibited without prior permission. Please see the information on Disclosures here: https://dhfunds.com/literature. Charts with models and return information use indices for performance testing to extend the model histories, and they should be considered hypothetical. All Rights Reserved. © Copyright 2026 Day Hagan Asset Management. Data sources: Day Hagan Asset Management, 3Fourteen Research, J.P. Morgan, Goldman Sachs, Barchart, StreetStats, Atlanta Fed, St. Louis Fed, Koyfin, Yardeni, MarketEar, S&P Global, SPDR, FactSet.
Disclosures
The information contained herein is provided for informational purposes only and should not be construed as investment advice or a recommendation to buy or sell any security. The securities, instruments, or strategies described may not be suitable for all investors, and their value and income may fluctuate. Past performance is not indicative of future results, and there is no guarantee that any investment strategy will achieve its objectives, generate profits, or avoid losses. Investing involves risks, including loss of principal.
This material is intended to provide general market commentary and should not be relied upon as individualized investment advice. Investors should consult with their financial professional before making any investment decisions based on this information.
Data and analysis are provided “as is” without warranty of any kind, either express or implied. Day Hagan Asset Management, its affiliates, employees, or third-party data providers shall not be liable for any loss sustained by any person relying on this information. All opinions and views expressed are subject to change without notice and may differ from those of other investment professionals within Day Hagan Asset Management or Ashton Thomas Private Wealth, LLC.
Accounts managed by Day Hagan Asset Management or its affiliates may hold positions in the securities discussed and may trade such securities without notice.
Day Hagan Asset Management is a division of and doing business as (DBA) Ashton Thomas Private Wealth, LLC, an SEC-registered investment adviser. Registration with the SEC does not imply a certain level of skill or training.
There is no guarantee that any investment strategy will achieve its objectives, generate dividends, or avoid losses.
S&P 500 Index—An unmanaged composite of 500 large-cap companies, this index is widely used by professional investors as a performance benchmark for large-cap stocks.
S&P 500 Total Return Index – An unmanaged composite of 500 large capitalization companies. Professional investors widely use this index as a performance benchmark for large-cap stocks. This index assumes reinvestment of dividends.
Sentiment – Market sentiment is the prevailing attitude of investors toward a company, a sector, or the financial market.
CBOE Volatility Index (VIX) – A real-time index that represents the market’s expectations for the relative strength of near-term price changes of the S&P 500 Index (SPX). Because it is derived from SPX index options with near-term expiration dates, it produces a 30-day forward volatility projection. Volatility, or how quickly prices change, is often seen as a way to gauge market sentiment, particularly the degree of fear among market participants.
OBOS Indicators—The overbought/Oversold (OBOS) index relates the difference between today’s closing price and the period’s low closing price to the trade margin of the given period.
Purchasing Manager Indexes (PMIs) – Purchasing Managers’ Indexes are survey-based economic indicators designed to provide timely insight into business conditions.
FOMC Meeting –The FOMC (Federal Open Market Committee) holds eight regularly scheduled meetings per year. At these meetings, the Committee reviews economic and financial conditions, determines the appropriate stance of monetary policy, and assesses the risks to its long-term goals of price stability and sustainable economic growth.
Consumer Price Index (CPI) – Measures the monthly change in prices paid by U.S. consumers. The Bureau of Labor Statistics (BLS) calculates the CPI as a weighted average of prices for a basket of goods and services representative of aggregate U.S. consumer spending.
Breakevens: Breakevens are the inflation rate implied by bond markets: the yield difference between a nominal Treasury and an inflation-protected Treasury of the same maturity.
OAS: OAS spreads are the extra yield a bond offers over Treasuries, after adjusting for embedded options, used to gauge credit risk and relative value.
Catastrophic Stop model — Proprietary model used to indicate suggested equity exposure levels.
CDS — Contract designed to transfer credit risk of a referenced borrower.
CDX NA HY 5Y CDS — Five-year CDS index tracking North American high-yield corporate credit risk.
CDX NA IG 5Y CDS — Five-year CDS index tracking North American investment-grade corporate credit risk.
Challenger net hiring — Hires minus layoffs, as reported in Challenger labor market data.
Citigroup U.S. Economic Surprise Index — Index measuring whether U.S. economic data exceed or miss consensus expectations.
ISM Manufacturing PMI — Survey-based indicator of business conditions in the U.S. manufacturing sector.
ISM Services PMI — Survey-based indicator of business conditions in the U.S. services sector.
Managed futures — Typically systematic strategies trading futures across asset classes.
Success rate — Percentage of historical observations producing a positive stated outcome.
For more information, please contact us at:
Day Hagan Asset Management
1000 S. Tamiami Trail, Sarasota, FL 34236
Toll-Free: (800) 594-7930
Office Phone: (941) 330-1702
Websites: https://dayhagan.com or https://dhfunds.com
© 2026 Day Hagan Asset Management
